| |||||||||||||||||||||||||||||||||||||
All 5 Tasmanian seats in the Australian House of Representatives and 6 seats in the Australian Senate | |||||||||||||||||||||||||||||||||||||
---|---|---|---|---|---|---|---|---|---|---|---|---|---|---|---|---|---|---|---|---|---|---|---|---|---|---|---|---|---|---|---|---|---|---|---|---|---|
| |||||||||||||||||||||||||||||||||||||
Results by electorate |
2004 Australian federal election |
---|
National results |
State and territory results |
This is a list of electoral division results for the Australian 2004 federal election in the state of Tasmania. [1] [2] [3]
Party | Votes | % | Swing | Seats | Change | |
---|---|---|---|---|---|---|
Labor | 140,918 | 44.58 | –2.59 | 3 | 2 | |
Liberal | 132,724 | 41.98 | +4.88 | 2 | 2 | |
Greens | 31,242 | 9.88 | +2.07 | |||
Family First | 8,973 | 2.84 | +2.84 | |||
Citizens Electoral Council | 1,158 | 0.37 | +0.32 | |||
Socialist Alliance | 1,108 | 0.35 | +0.35 | |||
Total | 316,123 | 5 | ||||
Two-party-preferred vote | ||||||
Labor | 171,294 | 54.19 | –3.54 | 3 | 2 | |
Liberal/National Coalition | 144,829 | 45.81 | +3.54 | 2 | 2 |
Labor to Liberal: Bass Braddon
Tasmania bucked the national trend against Labor. The party still lost two seats but maintained a primary vote of 44.6%. The Liberal party saw its primary vote jump 5.9% to 42.0%, and the Greens saw their strongest nationwide results capturing 9.9% of the vote. [4]Party | Candidate | Votes | % | ±% | |
---|---|---|---|---|---|
Liberal | Michael Ferguson | 30,678 | 49.13 | +7.68 | |
Labor | Michelle O'Byrne | 24,491 | 39.22 | −3.60 | |
Greens | Jeremy Ball | 5,059 | 8.10 | +1.86 | |
Family First | Christine Bergman | 1,145 | 1.83 | +1.83 | |
Citizens Electoral Council | Caroline Larner | 847 | 1.36 | +1.10 | |
Socialist Alliance | Meredith de Landelles | 219 | 0.35 | +0.35 | |
Total formal votes | 62,439 | 96.10 | +0.37 | ||
Informal votes | 2,534 | 3.90 | −0.37 | ||
Turnout | 64,973 | 95.63 | −0.53 | ||
Two-party-preferred result | |||||
Liberal | Michael Ferguson | 32,860 | 52.63 | +4.69 | |
Labor | Michelle O'Byrne | 29,579 | 47.37 | −4.69 | |
Liberal gain from Labor | Swing | +4.69 |
Party | Candidate | Votes | % | ±% | |
---|---|---|---|---|---|
Liberal | Mark Baker | 30,681 | 47.36 | +8.19 | |
Labor | Sid Sidebottom | 27,893 | 43.05 | −5.35 | |
Greens | Michelle Foale | 3,632 | 5.61 | +0.13 | |
Family First | Wayne de Bomford | 2,581 | 3.98 | +3.98 | |
Total formal votes | 64,787 | 96.39 | −0.28 | ||
Informal votes | 2,426 | 3.61 | +0.28 | ||
Turnout | 67,213 | 96.04 | −0.41 | ||
Two-party-preferred result | |||||
Liberal | Mark Baker | 33,127 | 51.13 | +7.09 | |
Labor | Sid Sidebottom | 31,660 | 48.87 | −7.09 | |
Liberal gain from Labor | Swing | +7.09 |
Party | Candidate | Votes | % | ±% | |
---|---|---|---|---|---|
Labor | Duncan Kerr | 31,602 | 49.51 | −1.87 | |
Liberal | Erick Pastoor | 20,782 | 32.56 | +0.97 | |
Greens | Helen Burnet | 9,318 | 14.60 | +4.15 | |
Family First | Gino Papiccio | 1,578 | 2.47 | +2.47 | |
Socialist Alliance | Kamala Emanuel | 544 | 0.85 | +0.85 | |
Total formal votes | 63,824 | 96.90 | −0.19 | ||
Informal votes | 2,045 | 3.10 | +0.19 | ||
Turnout | 65,869 | 95.26 | −0.36 | ||
Two-party-preferred result | |||||
Labor | Duncan Kerr | 40,397 | 63.29 | −0.97 | |
Liberal | Erick Pastoor | 23,427 | 36.71 | +0.97 | |
Labor hold | Swing | -0.97 |
Party | Candidate | Votes | % | ±% | |
---|---|---|---|---|---|
Labor | Harry Quick | 29,938 | 46.42 | +0.57 | |
Liberal | Henry Finnis | 24,936 | 38.67 | +1.11 | |
Greens | Mathew Woolley | 7,207 | 11.18 | +1.45 | |
Family First | Marc Mumford | 2,063 | 3.20 | +3.20 | |
Socialist Alliance | Glenn Shields | 345 | 0.53 | +0.53 | |
Total formal votes | 64,489 | 96.60 | −0.40 | ||
Informal votes | 2,270 | 3.40 | +0.40 | ||
Turnout | 86,759 | 95.65 | −0.65 | ||
Two-party-preferred result | |||||
Labor | Harry Quick | 37,139 | 57.59 | −0.45 | |
Liberal | Henry Finnis | 27,350 | 42.41 | +0.45 | |
Labor hold | Swing | -0.45 |
Party | Candidate | Votes | % | ±% | |
---|---|---|---|---|---|
Labor | Dick Adams | 26,994 | 44.56 | −2.70 | |
Liberal | Ben Quin | 25,647 | 42.33 | +6.52 | |
Greens | Glenn Millar | 6,036 | 9.95 | +2.91 | |
Family First | Marie Papiccio | 1,606 | 2.65 | +2.65 | |
Citizens Electoral Council | Saul Jenkins | 311 | 0.51 | +0.51 | |
Total formal votes | 60,584 | 96.05 | −0.41 | ||
Informal votes | 2,494 | 3.95 | +0.41 | ||
Turnout | 63,078 | 95.66 | −0.52 | ||
Two-party-preferred result | |||||
Labor | Dick Adams | 32,519 | 53.68 | −4.49 | |
Liberal | Ben Quin | 28,065 | 46.32 | +4.49 | |
Labor hold | Swing | -4.49 |
Brett David Whiteley is an Australian politician. Whiteley was a Member of the House of Representatives representing the federal division of Braddon. He was elected at the 2013 federal election for the Liberal Party, defeating Labor's Sid Sidebottom, but was defeated after one term by Labor's Justine Keay at the 2016 federal election.
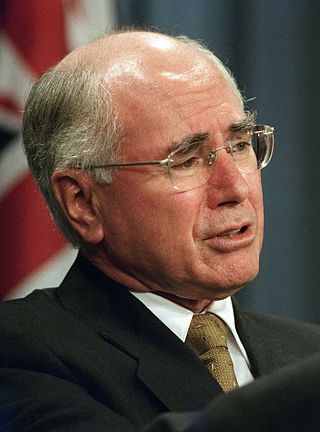
The 2004 Australian federal election was held on Saturday 9 October 2004 and it was the Howard government's opportunity to secure its fourth term of government. The Government consisting of the conservative coalition Liberal Party and National Party headed by John Howard and John Anderson respectively were opposed by Mark Latham and the Labor Party.
The Division of Braddon is an Australian electoral division in the state of Tasmania. The current MP is Gavin Pearce of the Liberal Party, who was elected at the 2019 federal election.
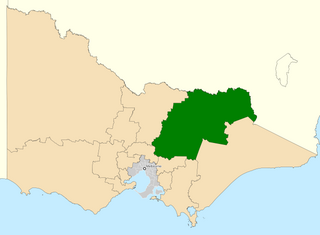
The Division of Indi is an Australian electoral division in the state of Victoria. The division is located in the north-east of the state, adjoining the border with New South Wales. The largest settlements in the division are the regional cities of Wodonga, Wangaratta, and Benalla. Other towns in the electorate include Rutherglen, Mansfield, Beechworth, Myrtleford, Bright, Alexandra, Tallangatta, Corryong and a number of other small villages. While Indi is one of the largest electorates in Victoria, much of it is located within the largely uninhabited Australian Alps. While Wodonga serves as a regional hub for much of the more heavily populated northern part of the electorate, the southern part is closer to Melbourne than Wodonga.
This is a list of electoral results for the Division of Bennelong in Australian federal elections from the electorate's creation in 1949 until the present.
This is a list of electoral results for the Division of Werriwa in Australian federal elections from the division's creation in 1901 until the present.
McEwan, an Australian Electoral Division in the Australian state of Victoria, has existed since 1984.
This is a list of electoral results for the Division of Bass in Australian federal elections from the division's creation in 1903 until the present.
This is a list of electoral results for the Division of Braddon in Australian federal elections from the division's creation in 1955 until the present.
This is a list of electoral results for the Division of Lyons in Australian federal elections from the division's creation in 1984 until the present.
This is a list of electoral results for the Division of Franklin in Australian federal elections from the division's creation in 1903 until the present.
The following tables show state-by-state results in the Australian House of Representatives at the 2016 federal election, Coalition 76, Labor 69, Australian Greens 1, Nick Xenophon Team 1, Katter's Australian Party 1, with 2 independents.
This is a list of electoral division results for the 2016 Australian federal election in the state of Tasmania.
A by-election for the Australian House of Representatives seat of Braddon took place on Saturday 28 July 2018, following the resignation of incumbent Labor MP Justine Keay.
The Tasmanian Nationals are a political party in the Australian state of Tasmania, aligned with the National Party of Australia. The party is not currently registered with the Tasmanian Electoral Commission, and is not separately registered with the Australian Electoral Commission, unlike the other state branches of the Nationals.
This is a list of electoral division results for the 2022 Australian federal election in the state of Queensland.
This is a list of electoral division results for the 2022 Australian federal election in the state of Tasmania.
This is a list of electoral division results for the Australian 2007 federal election in the state of Tasmania.
This is a list of electoral division results for the Australian 2004 federal election in the state of Victoria.
This is a list of electoral division results for the Australian 2001 federal election in the state of Tasmania.