Results of the 2004 Australian federal election (House of Representatives)

Last updated

House of Representatives elections, 2004
Flag of Australia (converted).svg
  2001 9 October 2004 (2004-10-09) 2007  

All 150 seats in the Australian House of Representatives
76 seats needed for a majority
Turnout94.3%
PartyLeader%Seats+/–
Liberal John Howard 40.5%74+6
Labor Mark Latham 37.6%60−5
National John Anderson 5.9%12−1
Country Liberal Terry Mills 0.3%10
This lists parties that won seats. See the complete results below.
Prime Minister beforePrime Minister after
Howard John BANNER.jpg John Howard
Coalition
John Howard
Coalition
Howard John BANNER.jpg

The 2004 Australian federal election was held on Saturday 9 October 2004 and it was the Howard government's opportunity to secure its fourth term of government. The Government consisting of the conservative coalition Liberal Party and National Party headed by John Howard and John Anderson respectively were opposed by Mark Latham and the Labor Party.

Contents

The Howard government would be returned for its fourth term, seeing major gains nationwide. It was able to increase its majority by 10 seats, from 14 to 24, and a secured an increased margin in seats it already held. [1] The Coalition finished the election with 87 seats, to Labor's 60. The remaining seats were held by independents.

The election post-mortem would reveal that there had been a large miscalculation by the Australian Labor Party, pollsters, and media alike. What was predicted to be a close election, possibly even a Labor win by many, resulted in a win for the Coalition and a decline in the primary vote for the Labor Party. [2]

The following table shows results for the Australian House of Representatives at the 2004 federal election, Coalition 87, Australian Labor Party 60, with three independents.

Lead up to the election

In 2001, John Howard's Coalition government narrowly beat the Labor Party in what was deemed by many as an "unwinnable" election for the government. Issues of national security such as the September 11 terrorist attacks and the Tampa refugee crisis, allowed the government to turn its political fortunes around and secure a gain of two seats in the House of Representatives. [3] The years following 2001 saw Australia controversially engage in the Iraq War as a member of the ‘Coalition of the Willing’ along with the United States and United Kingdom. This war was seen by many globally as a failure and it was predicted that the Howard government could be defeated due to the war's unpopularity. Another western democracy, Spain, had seen its pro-Iraq war government defeated in an election earlier that year and it was speculated that the Australian government might suffer the same fate. [4]

Leader of the opposition: Mark Latham Mark Latham 1.jpg
Leader of the opposition: Mark Latham

On the 29th of August 2004, the prime minister announced that a federal election would be held on October 9, 2004. This was an unusual time to announce an election, many thought the ongoing Athens Olympic Games gathering most of the public's attention. It was also an unusually long election campaign at 6 weeks. Many pundits predicted a tight race with Michelle Grattan stating on the day of the announcement that the campaign would be "an unpredictable and exciting election in which neither leader starts with a decisive break, either could take the prize, and absolutely anything could happen in between". However, the Government was campaigning from a strong position politically. [2]

Despite the poignancy of the Iraq War as an issue, issues surrounding the economy such as interest rates, the size of the deficit, taxation and unemployment dominated the political agenda during the election campaign. The sale of Telstra was also an influential topic. The Howard government had delivered several budget surpluses and Australian's were enjoying a period of strong economic growth and low unemployment. [2] The government afforded many tax breaks and concessions to middle-income earners, which despite not being revolutionary policy, bought them favour with large sections of the electorate. Add to this that the Labor Party had found itself in the political wilderness since 2001, spending much of its time between 2001 and 2004 under Simon Crean who suffered consistently poor polling, and the Howard government looked as though it had a strong grip on power. Labor eventually switched leaders in early 2004 to allow itself a better chance at the election. Crean resigned to allow Mark Latham to assume the position of leader in 2003 in a contested ballot against Kim Beazley. [5]

Redistributions in the Lower House

Victoria

In 2002-03 there was a significant redistribution of two Victorian seats. The electorate of McMillan, a marginal Labor electorate was redistributed to become a nominally Liberal seat. The electorate of Gippsland, a seat seen as a fairly safe for the National Party was redistributed to become more marginal. [1]

South Australia

In 2003, the Australian Electoral Commission determined that South Australia would lose a seat and Queensland would gain a seat. It was decided that the electorate of Bonython would be absorbed into the electorate of Wakefield, drastically changing the demographics of this electorate in the process. It was unknown what the change would yield in terms of election results. [1]

Queensland

Queensland's rising population saw it become entitled to an additional seat. This new seat would come in the form of an Eastern Brisbane electorate, Bonner. Bonner was a nominally Liberal electorate that took territory from the electorate of Bowman, a Labor seat. This redistribution would see the seat become nominally Liberal. [1]

Australia

House of Representatives (IRV) — Turnout 94.69% (CV) — Informal 5.18% 2004 Australian House.svg
PartyVotes %SwingSeatsChange
   Liberal 4,741,45840.47+3.3974Increase2.svg 6
  National 690,2755.89+0.2812Decrease2.svg 1
  Country Liberal 39,8550.34+0.021Steady2.svg
Liberal–National coalition 5,471,58846.71+3.7987Increase2.svg 5
  Labor 4,408,82037.63–0.2160Decrease2.svg 5 [lower-alpha 1]
  Greens 841,7347.19+2.230Steady2.svg [lower-alpha 1]
  Family First 235,3152.01+2.01
  Democrats 144,8321.24–4.17
  One Nation 139,9561.19–3.15
Total11,714,835  150
Two-party-preferred vote
  Coalition Win52.74+1.7987Increase2.svg 5
  Labor  47.26–1.7960Decrease2.svg 5
Invalid/blank votes639,8515.18+0.36
Registered voters/turnout13,098,46194.32
Source: Commonwealth Election 2004

States

New South Wales

2004 Australian federal election
(New South Wales)
Flag of New South Wales.svg
  2001 9 October 2004 2007  

All 50 New South Wales seats in the Australian House of Representatives
and 6 seats in the Australian Senate
 First partySecond partyThird party
  Howard2003port.JPG Mark Latham 1.jpg Greens placeholder-01.png
Leader John Howard Mark Latham None
Party Liberal/National coalition Labor Greens
Last election28 seats20 seats0 seats
Seats before28191
Seats won27210
Seat changeDecrease2.svg 1Increase2.svg 2Decrease2.svg 1
Popular vote1,745,1811,412,418311,369
Percentage45.34%36.70%8.09%
SwingIncrease2.svg 2.55Increase2.svg 0.25Increase2.svg 3.34
TPP 51.93%48.07%
TPP swingIncrease2.svg 0.27Decrease2.svg 0.27
Turnout 94.70% (CV) — Informal 6.12% [6]
PartyVotes %SwingSeatsChange
  Liberal 1,391,51136.16+2.5821Steady2.svg
  National 353,6709.19–0.036Decrease2.svg 1
Liberal–National coalition 1,745,18145.34+2.5427Decrease2.svg 1
  Labor 1,412,41836.70+0.2521Increase2.svg 1 [lower-alpha 1]
  Greens 311,3698.093.340Steady2.svg [lower-alpha 1]
  One Nation 53,8811.40-3.37
  Christian Democrats 47,1321.220.00
  Democrats 41,0721.07-3.17
  Family First 29,6210.770.77
  Citizens Electoral Council 11,5000.300.15
  Liberals for Forests 8,1650.210.21
  No GST 7,2290.190.06
  Socialist Alliance 4,4150.110.11
  Progressive Labour 3,7750.10-0.02
  Outdoor Recreation 3,5050.090.09
  Save the ADI Site 3,4900.09-0.07
 Ex-Service, Service and Veterans3,1080.080.08
  New Country 2,8240.070.07
  Fishing Party 2,5160.070.05
  Lower Excise Fuel and Beer 2,0070.05-0.03
  Non-Custodial Parents 1,1320.030.01
  Nuclear Disarmament 0,3410.010.01
  Independents 154,0134.00-0.06
Total4,099,50150
Two-party-preferred vote
  Liberal/National Coalition 1,998,69951.93+0.2727Decrease2.svg 1
  Labor 1,849,99548.07–0.2721Increase2.svg 1
Invalid/blank votes250,8076.12+0.25
Registered voters/turnout4,329,11594.70
Source: AEC Tally Room

Four seats changed hands in NSW during this election, with the Liberal Party experiencing a primary vote of 36.2%, one of its strongest tally's since the 1975 poll and at the expense of the Labor Party. The opposition lost ground in the outer suburbs of Sydney, areas which it once considered to be very strong for its vote. The Nationals' vote remained steady but the Greens' vote increased by 3.3%, the party's second best result in the state. [1]

Victoria

2004 Australian federal election
(Victoria)
Flag of Victoria (Australia).svg
  2001 9 October 2004 2007  

All 37 Victoria seats in the Australian House of Representatives
and 6 seats in the Australian Senate
 First partySecond party
  Howard2003port.JPG Mark Latham 1.jpg
Leader John Howard Mark Latham
Party Liberal/National coalition Labor
Last election18 seats19 seats
Seats won18 seats19 seats
Seat changeSteady2.svgSteady2.svg
Popular vote1,407,6151,217,921
Percentage46.75%40.45%
SwingIncrease2.svg 4.60Increase2.svg 0.08
TPP 51.00%49.00%
TPP swingIncrease2.svg 3.14Decrease2.svg 3.14
Turnout 94.84% (CV) — Informal 5.16% [7]
PartyVotes %SwingSeatsChange
  Liberal 1,302,03843.24+4.1716Steady2.svg
  National 105,5573.51+0.432Steady2.svg
Liberal–National coalition 1,302,03846.75+4.6018Steady2.svg
  Labor 1,217,92140.45–1.2019Steady2.svg
  Greens 224,4237.45+1.55
  Family First 71,7352.38+2.38
  Democrats 32,3631.07–5.18
  Citizens Electoral Council 14,0100.47+0.24
  One Nation 4,1190.14–1.14
  Socialist Alliance 3,6940.120.12
  Democratic Labor 1,3720.050.05
  No GST 5730.02-0.15
 Ex-Service, Service and Veterans5270.020.02
  Christian Democrats 4590.02-0.19
  Aged and Disability Pensioners Party 2850.010.01
  Independents 32,0731.07-0.99
Total3,139,88137
Two-party-preferred vote
  Liberal/National Coalition 1,535,65051.00+3.1418Steady2.svg
  Labor 1,475,51949.00–3.1419Steady2.svg
Invalid/blank votes128,7124.10+0.12
Registered voters/turnout3,309,80094.87
Source: AEC Tally Room

In Victoria, the poor result seen in other states for Labor wasn't reflected. Labor was able to achieve above 40% of the primary vote in this state, its poorest since 1990. The Liberal Party performed strongly in Victoria recording their best results in the state since the election of 1954 with 43.2% of the primary vote. The National's and Green vote held steady in the state, while the Australian Democrat vote fell sharply to 1.1%. [1]

Queensland

2004 Australian federal election
(Queensland)
Flag of Queensland.svg
  2001 9 October 2004 2007  

All 28 Queensland seats in the Australian House of Representatives
and 6 seats in the Australian Senate
 First partySecond party
  Howard2003port.JPG Mark Latham 1.jpg
Leader John Howard Mark Latham
Party Liberal/National coalition Labor
Last election20 seats7 seats
Seats won21 seats6 seats
Seat changeIncrease2.svg 1Decrease2.svg 1
Popular vote1,081,813765,507
Percentage49.15%34.75%
SwingIncrease2.svg 3.56Increase2.svg 0.08
TPP 57.09%42.91%
TPP swingIncrease2.svg 2.23Decrease2.svg 2.23
Turnout 94.84% (CV) — Informal 5.16% [8]
PartyVotes %SwingSeatsChange
  Liberal 867,28939.41+ 2.9517Increase2.svg 1
  National 214,5229.75+0.614Steady2.svg
Liberal/National Coalition 1,081,81149.15+3.5521Increase2.svg 1
  Labor 765,50734.78+0.086Decrease2.svg 1
  Greens 111,3145.06+1.57
  Family First 80,8203.67+3.67
  One Nation 43,6191.98–5.09
  Democrats 30,2551.37–2.94
  Citizens Electoral Council 7,8720.36+ 0.22
  New Country 3,9900.18+0.18
  Great Australians 2,8240.13+0.13
  Socialist Alliance 1,2510.06+0.06
  HEMP 7870.04–0.01
 Ex-Service, Service and Veterans7340.03+0.03
  Independents 70,1043.18–1.45
Total2,320,717 28
Two-party-preferred vote
  Liberal/National Coalition 1,256,53357.09+2.2321Increase2.svg 1
  Labor 944,35542.91–2.236Decrease2.svg 1
Invalid/blank votes119,8295.16+0.33
Registered voters/turnout2,475,61193.74
Source: AEC Tally Room

The Labor Party returned poor polling in the state, especially considering it was enjoying strong results at a state level through to 2004. Indeed, Labor recorded some of its lowest primary vote numbers in this state since the party's foundation in this election, while the Liberal party recorded some of its strongest. Queensland was the poorest state electorally for the Greens, while One Nation also suffered a 5.1% reduction in their primary vote. [1]

Western Australia

2004 Australian federal election
(Western Australia)
Flag of Western Australia.svg
  2001 9 October 2004 2007  

All 15 Western Australian seats in the Australian House of Representatives
and 6 seats in the Australian Senate
 First partySecond party
  Howard2003port.JPG Mark Latham 1.jpg
Leader John Howard Mark Latham
Party Liberal/National coalition Labor
Last election8 seats7 seats
Seats won10 seats5 seats
Seat changeIncrease2.svg 2Decrease2.svg 2
Popular vote534,911381,200
Percentage48.76%34.75%
SwingIncrease2.svg 6.35Decrease2.svg 2.39
TPP 55.40%44.60%
TPP swingIncrease2.svg 3.78Decrease2.svg 3.78
Turnout 92.79% (CV) — Informal 5.32% [9]
PartyVotes %SwingSeatsChange
  Liberal 528,01648.13+ 6.7410Increase2.svg 2
  National 6,8950.63–0.39Steady2.svg
Liberal–National coalition 534,91148.76+6.3510Increase2.svg 2
  Labor 381,20034.75–2.395Decrease2.svg 2
  Greens 84,1007.67+ 1.68
  One Nation 27,6502.52–3.75
 Christian Democratics24,6502.25+1.07
  Democrats 16,2981.49–3.17
  Citizens Electoral Council 6,5390.60+0.33
  Family First 2,6190.24+0.24
  New Country 2,6250.24+0.25
  Socialist Alliance 1,6200.15+0.15
  Independents 14,8611.35+ 0.82
Total1,158,687 15
Two-party-preferred vote
  Liberal/National Coalition 607,82955.40+ 3.7810Increase2.svg 2
  Labor 489,24444.60–3.785Decrease2.svg 2
Invalid/blank votes61,6145.32+0.40
Registered voters/turnout1,248,73292.79
Source: AEC Tally Room

Western Australia saw two seats change hands. The Liberal vote has always been considered strong in this state. It was made stronger in this election due to Kim Beazley's absence as Labor leader. Beazley, a native Western Australian was seen to bolster Labor's poll numbers when he stood in 1998 and 2001. This and the unpopular Labor state Geoff Gallop government of the time saw Labor's polling numbers slide to its lowest since 1977. [1]

South Australia

2004 Australian federal election
(South Australia)
Flag of South Australia.svg
  2001 9 October 2004 2007  

All 11 South Australian seats in the Australian House of Representatives
and 6 seats in the Australian Senate
 First partySecond party
  Howard2003port.JPG Mark Latham 1.jpg
Leader John Howard Mark Latham
Party Liberal/National coalition Labor
Last election9 seats3 seats
Seats won8 seats3 seats
Seat changeDecrease2.svg 1Steady2.svg
Popular vote455,983346,071
Percentage48.42%36.75%
SwingIncrease2.svg 2.51Increase2.svg 3.01
TPP 54.36%45.64%
TPP swingIncrease2.svg 0.28Decrease2.svg 0.28
Turnout 94.79% (CV) — Informal 5.56% [10]
PartyVotes %SwingSeatsChange
  Liberal 446,37247.40+ 1.498Decrease2.svg 1
  National 9,6111.02+1.020Steady2.svg
Liberal–National coalition 455,98348.42+2.528Decrease2.svg 1
  Labor 346,07136.75+ 3.013Steady2.svg
  Greens 51,2005.44+1.80
  Democrats 17,6821.88–8.66
  One Nation 10,6871.13–3.62
  Family First 40,5474.31+4.31
  Independents 19,2042.04+1.16
Total997,10211Decrease2.svg 1
Two-party-preferred vote
  Liberal/National Coalition 511,84554.36+0.288Decrease2.svg 1
  Labor 429,79945.64–0.283Steady2.svg
Invalid/blank votes55,4585.56+0.22
Registered voters/turnout1,051,92394.79
Source: AEC Tally Room

The redistribution saw South Australia lose one seat. This election saw four seats change hands; however, there was no net change in party representation. The Liberal vote rose slightly, as did Labor's (3.1% since 2001). While the Greens recorded a result of 5.4%.

Tasmania

2004 Australian federal election
(Tasmania)
Flag of Tasmania.svg
  2001 9 October 2004 2007  

All 5 Tasmanian seats in the Australian House of Representatives
and 6 seats in the Australian Senate
 First partySecond party
  Mark Latham 1.jpg Howard2003port.JPG
Leader Mark Latham John Howard
Party Labor Liberal/National coalition
Last election5 seats0 seats
Seats won3 seats2 seats
Seat changeDecrease2.svg 2Increase2.svg 2
Popular vote140,918132,724
Percentage44.58%41.98%
SwingDecrease2.svg 2.59Increase2.svg 4.88
TPP 54.19%45.81%
TPP swingDecrease2.svg 3.54Increase2.svg 3.54

2004 Australian federal election in Tasmania.svg
Results by electorate
Turnout 95.64% (CV) — Informal 3.59% [11]
PartyVotes%SwingSeatsChange
  Labor 140,91844.58–2.593Decrease2.svg 2
  Liberal 132,72441.98+4.882Increase2.svg 2
  Greens 31,2429.88+2.07
  Family First 8,9732.84+2.84
  Citizens Electoral Council 1,1580.37+0.32
  Socialist Alliance 1,1080.35+0.35
Total316,1235
Two-party-preferred vote
  Labor 171,29454.19–3.543Decrease2.svg 2
  Liberal/National Coalition 144,82945.81+3.542Increase2.svg 2

Labor to Liberal: Bass Braddon

Tasmania bucked the national trend against Labor. The party still lost two seats but maintained a primary vote of 44.6%. The Liberal party saw its primary vote jump 5.9% to 42.0%, and the Greens saw their strongest nationwide results capturing 9.9% of the vote. [1]

Territories

Australian Capital Territory

2004 Australian federal election
(Australian Capital Territory)
Flag of the Australian Capital Territory.svg
  2001 9 October 2004 2007  

All 2 Australian Capital Territory seats in the Australian House of Representatives
and all 2 seats in the Australian Senate
 First partySecond party
  Mark Latham 1.jpg Howard2003port.JPG
Leader Mark Latham John Howard
Party Labor Liberal/National coalition
Last election2 seats0 seats
Seats won2 seats0 seats
Seat changeSteady2.svgSteady2.svg
Popular vote104,83673,508
Percentage50.20%35.20%
SwingIncrease2.svg 3.30Increase2.svg 2.80
TPP 61.10%38.90%
TPP swingDecrease2.svg 1.40Increase2.svg 1.40
Turnout 95.85% (CV) — Informal 2.31% [12]
PartyVotes%SwingSeatsChange
  Labor 104,83650.2+3.32Steady2.svg
  Liberal 73,50835.2+2.80Steady2.svg
  Greens 22,44010.8+3.7
  Democrats 5,0102.4–5.6
  Socialist Alliance 2,0671.0+1.0
  Citizens Electoral Council 7650.4+0.4
Total208,6262
Two-party-preferred vote
  Labor 61.1–1.42Steady2.svg
  Liberal  38.9+1.40Steady2.svg

Northern Territory

2004 Australian federal election
(Northern Territory)
Flag of the Northern Territory.svg
  2001 9 October 2004 2007  

All 2 Northern Territory seats in the Australian House of Representatives
and all 2 seats in the Australian Senate
 First partySecond party
  Mark Latham 1.jpg Howard2003port.JPG
Leader Mark Latham John Howard
Party Labor Liberal/National coalition
Last election 1 seat 1 seat
Seats won1 seat1 seat
Seat changeSteady2.svgSteady2.svg
Popular vote40,24639,855
Percentage44.27%43.84%
SwingIncrease2.svg 1.34Increase2.svg 3.30
TPP 52.15%47.85%
TPP swingDecrease2.svg 0.34Increase2.svg 0.34
Turnout 86.53% (CV) — Informal 3.85% [13]
PartyVotes%SwingSeatsChange
  Labor 40,24644.27+1.371Steady2.svg
  Country Liberal 39,85543.84+3.301Steady2.svg
  Greens 5,6466.21+2.19
  Democrats 2,1522.37–2.89
  Family First 1,0001.10+1.10
  Citizens Electoral Council 2350.26+0.26
  Independents 1,7811.96–1.49
Total89,9722
Two-party-preferred vote
  Labor 52.15–0.341Steady2.svg
  Country Liberal  47.85+0.340Steady2.svg

Interpretation of results

A polling booth on election day Ac.pollingbooth.jpg
A polling booth on election day

The popularity of John Howard as prime minister and the ineffectiveness of Mark Latham as an opposition leader was what ultimately drove the Coalition's electoral success. The lack of viable alternatives as prime minister in the Coalition government helped consolidate this.

In the Howard government's third term, there had been the widely held view that the economy had been performing well, and economic security had increased. These economic circumstances were unusual for Australia following a tumultuous decade previously, one which saw a recession occur. This bolstered Howard's popularity, an opposition only stood a chance of making significant inroads against a leader much less popular than Howard.

Latham ran at times a scrappy campaign, announcing policy at unusual times and often without the consultation of his party room. Howard exploited this and succeeded in portraying him as inexperienced and risky. He also disregarded connecting to business or financial leaders, something which was viewed by many as a miscalculation. [14]

The two main policy areas that dominated campaigning were that of international security (Iraq War, terrorism) and economic security. They did sway votes and drove people to defect from either party, but to a lesser extent. In polls conducted it was found that 82% of people opposed the war, yet only 4% listed it as their primary issue. Support for the war followed an unusual trajectory. Initially, the country's engagement in a war alongside Britain and the United States was met with outrage in the community. However, once Australia had committed troops to the war, public opinion began shifting. Public support for the war became largely positive in late 2003. There were many people who objected to it on a moral basis but relatively few cared enough to change their vote at the ballot box.

Labor frequently attacked the coalition on their record of providing adequate social services such as Medicare, education funding and social welfare. Policies were announced aimed at addressing these and this resonated with voters. [4] Under the view of many in the electorate, these services had seen decline under the three terms of the coalition. School funding received particular attention with Latham announcing a bold remodelling of how federal funding would be split amongst independent and public schools. Latham suggested that elite private schools, some of the most expensive in the country, would have their funding slashed and redistributed to lower socioeconomic independent schools and government schools. This was seen by many as a departure from modern day political campaigning and a return to old fashioned class-warfare type politics. [15] The media portrayed the policy dishonestly, describing it as removing all private school funding. This wasn't true, the policy ensured that the pool of independent funding remained but was distributed more to low-income schools. Nevertheless, Latham would be scalded in the media for adopting the policy with Victoria's Herald Sun running an editorial against him stating "Mr Latham's commitments are based on the fallacious, ideologically driven premise that all parents who send their children to so called wealthy schools are themselves rich". [15]

The Coalition successfully countered these by running a campaign around interest rates stating that the spending envisaged by a Labor government would inevitably see interest rates increase. The "Keep interest rates low" campaign ran by the Coalition reminded the electorate frequently about the double digit interest rates that existed under the Hawke/Keating Labor governments in the 1980's and 1990's. Labor decided to counter this by quoting a Reuters survey of 14 financial market economists that stated the party in government would make no difference to the level of interest rates over the next term of government. Many in Australia had borrowed heavily at the time to finance their home ownership and were swayed by this line of campaigning by Howard. They were justifiably nervous about their future financial prospects and voted accordingly. People saw the risk of foreclosure as a greater threat than the risk of sub-standard healthcare services or an inequitable public education sector. [16]

See also

Notes

  1. 1 2 3 4 Stephen Martin (Labor) had won the seat of Cunningham at the 2001 election; however, he retired in 2002. Michael Organ (Greens) won the seat at the resulting by-election; however, Sharon Bird regained the seat for Labor at this election.
  2. The independents were Peter Andren, Tony Windsor and Bob Katter.

Related Research Articles

<span class="mw-page-title-main">2001 Australian federal election</span> Election for the 40th Parliament of Australia

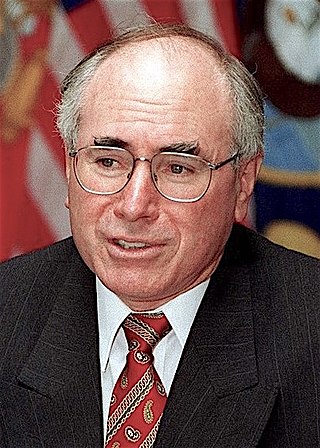
The 2001 Australian federal election was held in Australia on 10 November 2001. All 150 seats in the House of Representatives and 40 seats in the 76-member Senate were up for election. The incumbent Liberal Party of Australia led by Prime Minister of Australia John Howard and coalition partner the National Party of Australia led by John Anderson defeated the opposition Australian Labor Party led by Kim Beazley. Future Opposition Leader Peter Dutton entered parliament at this election. As of 2023 this was the most recent federal election to have a rematch in 11 years, and the most recent repeated election when Howard beat Beazley just 3 years earlier and until 2013 to have both major party leaders running in previous federal elections as major party leaders when in 2013, and the last for both major party leaders to appear in consecutive federal elections in 24 years.

<span class="mw-page-title-main">1998 Australian federal election</span> Election for the 39th Parliament of Australia

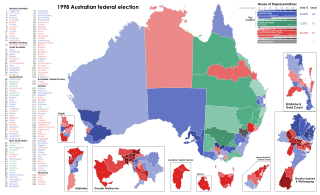
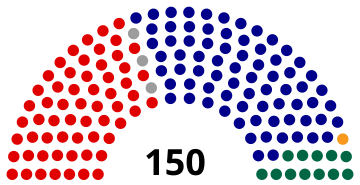
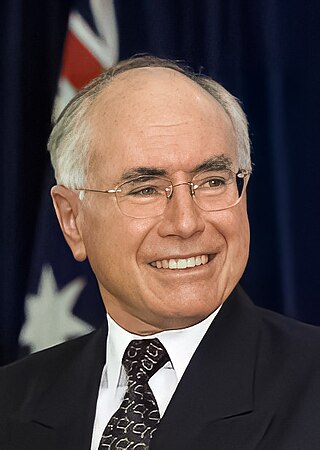
The 1998 Australian federal election was held to determine the members of the 39th Parliament of Australia. It was held on 3 October 1998. All 148 seats of the House of Representatives and 40 seats of the 76-seat Senate were up for election. The incumbent centre-right Liberal/National Coalition government led by Prime Minister John Howard of the Liberal Party and coalition partner Tim Fischer of the National Party defeated the centre-left Australian Labor Party opposition led by Opposition Leader Kim Beazley, despite losing the nationwide popular and two-party preferred vote. However, the Australian Labor Party gained seats from the previous election.

<span class="mw-page-title-main">2004 Australian federal election</span> Election for the 41st Parliament of Australia

The 2004 Australian federal election was held in Australia on 9 October 2004. All 150 seats in the House of Representatives and 40 seats in the 76-member Senate were up for election. The incumbent Liberal Party of Australia led by Prime Minister of Australia John Howard and coalition partner the National Party of Australia led by John Anderson defeated the opposition Australian Labor Party led by Mark Latham.

<span class="mw-page-title-main">1996 Australian federal election</span>

The 1996 Australian federal election was held to determine the members of the 38th Parliament of Australia. It was held on 2 March 1996. All 148 seats of the House of Representatives and 40 seats of the 76-seat Senate were up for election. The centre-right Liberal/National Coalition led by Opposition Leader John Howard of the Liberal Party and coalition partner Tim Fischer of the National Party defeated the incumbent centre-left Australian Labor Party government led by Prime Minister Paul Keating in a landslide victory. The Coalition won 94 seats in the House of Representatives, which is the largest number of seats held by a federal government to date, and only the second time a party had won over 90 seats at a federal election.

<span class="mw-page-title-main">2007 Australian federal election</span> Election for the 42nd Parliament of Australia

The 2007 Australian federal election was held in Australia on 24 November 2007. All 150 seats in the House of Representatives and 40 of the seats in the 76-member Senate were up for election. The election featured a 39-day campaign, with 13.6 million Australians enrolled to vote.

<span class="mw-page-title-main">Division of Brand</span> Australian federal electoral division

The Division of Brand is an Australian electoral division in Perth, Western Australia. Brand was first created in 1984 and is named after Sir David Brand, Premier of Western Australia 1959-71. Brand governed Western Australia at a time when the state was developing its new mining and industrial base.

<span class="mw-page-title-main">Division of Bennelong</span> Australian federal electoral division

The Division of Bennelong is an Australian electoral division in the state of New South Wales. The division was created in 1949 and is named after Woollarawarre Bennelong, an Aboriginal man befriended by the first Governor of New South Wales, Arthur Phillip. The seat is represented by Jerome Laxale since the 2022 Australian federal election.

The Division of Blair is an Australian Electoral Division in Queensland.
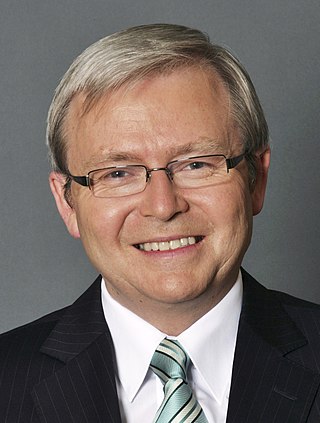
<span class="mw-page-title-main">Division of Melbourne</span> Australian federal electoral division

The Division of Melbourne is an Australian electoral division in the State of Victoria, represented since the 2010 election by Adam Bandt, leader of the Australian Greens.

The Division of Maranoa is an Australian electoral division in Queensland.

The Division of Kooyong is an Australian Electoral Division for the Australian House of Representatives in the state of Victoria, which covers an area of approximately 59 km2 (23 sq mi) in the inner-east of Melbourne. It contains the affluent suburbs of Balwyn, Balwyn North, Camberwell, Canterbury, Deepdene, Kew, Kew East, Mont Albert, Mont Albert North, Surrey Hills and parts of Glen Iris.

<span class="mw-page-title-main">Division of Richmond</span> Australian federal electoral division

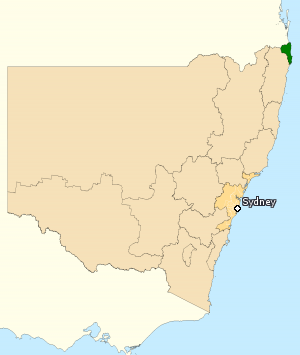
The Division of Richmond is an Australian electoral division in the state of New South Wales.

<span class="mw-page-title-main">1990 Australian federal election</span> Election

The 1990 Australian federal election was held in Australia on 24 March 1990. All 148 seats in the House of Representatives and 40 seats in the 76-member Senate were up for election. The incumbent Australian Labor Party, led by Bob Hawke, defeated the opposition Liberal Party of Australia, led by Andrew Peacock, with its coalition partner, the National Party of Australia, led by Charles Blunt, despite losing the nationwide popular and two-party-preferred vote. The result saw the re-election of the Hawke government for a fourth successive term.

Alfred Cove was an electoral district of the Legislative Assembly of Western Australia. It was located in Perth's southern suburbs, and named after the riverside suburb of Alfred Cove.

<span class="mw-page-title-main">Electoral district of Richmond (Victoria)</span> State electoral district of Victoria, Australia

Richmond is an electoral district of the Legislative Assembly in the Australian state of Victoria. It is currently a 13 km2 electorate in the inner east of Melbourne, encompassing the suburbs of Richmond, Cremorne, Burnley, Abbotsford, Collingwood, Clifton Hill, North Fitzroy and Fitzroy. Historically a very safe seat for the Labor Party, Richmond has in recent elections become increasingly marginal against the Greens, who eventually won the seat at the 2022 Victorian state election.

<span class="mw-page-title-main">Two-party-preferred vote</span> Result of election after distribution of preferences

In Australian politics, the two-party-preferred vote is the result of an election or opinion poll after preferences have been distributed to the highest two candidates, who in some cases can be independents. For the purposes of TPP, the Liberal/National Coalition is usually considered a single party, with Labor being the other major party. Typically the TPP is expressed as the percentages of votes attracted by each of the two major parties, e.g. "Coalition 50%, Labor 50%", where the values include both primary votes and preferences. The TPP is an indicator of how much swing has been attained/is required to change the result, taking into consideration preferences, which may have a significant effect on the result.

<span class="mw-page-title-main">2005 Werriwa by-election</span>

The 2005 Werriwa by-election was held in the Australian electorate of Werriwa in south-western Sydney on 19 March 2005, after the resignation of Labor MP Mark Latham, who had represented the electorate since 1994. Latham had been federal Opposition Leader since 2 December 2003 and led Labor to defeat at the 2004 election. He had become increasingly dissatisfied with politics and was struggling with recurring pancreatitis. He announced his resignation from parliament on 18 January 2005.

<span class="mw-page-title-main">2010 Australian federal election</span> Election for the 43rd Parliament of Australia

The 2010 Australian federal election was held on Saturday, 21 August 2010 to elect members of the 43rd Parliament of Australia. The incumbent centre-left Australian Labor Party led by Prime Minister Julia Gillard won a second term against the opposition centre-right Liberal Party of Australia led by Opposition Leader Tony Abbott and Coalition partner the National Party of Australia, led by Warren Truss, after Labor formed a minority government with the support of three independent MPs and one Australian Greens MP.

<span class="mw-page-title-main">How-to-vote card</span> Handed-out leaflets in Australian elections with voting instructions

In Australia, how-to-vote cards (HTV) are small leaflets that are handed out by party supporters during elections. Voting in the Australian lower house uses a preferential voting system. Voters must rank every candidate on the ballot in order for their vote to count. There are often numerous candidates on the ballot, some with little public profile, so voters may find it difficult to decide on all of them. Parties produce how-to-vote cards ostensibly to help voters. They contain details about the candidate or party as well as instruction how to cast a ranked vote in the order that the party would prefer the voter follow. The flow of preferences can assist the party dispersing the cards directly and indirectly help allied parties.

<span class="mw-page-title-main">2019 New South Wales state election</span> State election for New South Wales, Australia in March 2019

The 2019 New South Wales state election was held on Saturday 23 March 2019 to elect the 57th Parliament of New South Wales, including all 93 seats in the Legislative Assembly and 21 of the 42 seats in the Legislative Council. The election was conducted by the New South Wales Electoral Commission (NSWEC).

References

  1. 1 2 3 4 5 6 7 8 9 Bennett, Scott; Kopras, Andrew; Newman, Gerrard (2005). "Commonwealth Election 2004" (PDF). Research Brief 13. Parliamentary Library. ISSN   1832-2883.
  2. 1 2 3 Wanna, John (January 2005). "The Australian federal election 2004: Howard's scare campaign prompted labor's train‐wreck'". Representation. 41 (4): 291–299. doi:10.1080/00344890508523324. ISSN   0034-4893. S2CID   153711938.
  3. Tavan, Gwenda (3 May 2019). "Issues that swung elections: Tampa and the national security election of 2001". The Conversation. Retrieved 17 May 2021.
  4. 1 2 McAllister, Ian; Bean, Clive (6 December 2006). "Leaders, the Economy or Iraq? Explaining Voting in the 2004 Australian Election*". Australian Journal of Politics & History. 52 (4): 604–620. doi: 10.1111/j.1467-8497.2006.00435a.x .
  5. "Crean accuses Beazley of destabilising Labor". The Age. 23 April 2003. Retrieved 17 May 2021.
  6. "2004 First preference votes for New South Wales". Australian Electoral Commission. Retrieved 6 June 2022.
  7. "2004 First preference votes for Victoria". Australian Electoral Commission. Retrieved 6 June 2022.
  8. "2004 First preference votes for Queensland". Australian Electoral Commission. Retrieved 6 June 2022.
  9. "2004 First preference votes for Western Australia". Australian Electoral Commission. Retrieved 6 June 2022.
  10. "2004 First preference votes for South Australia". Australian Electoral Commission. Retrieved 6 June 2022.
  11. "2004 First preference votes for Tasmania". Australian Electoral Commission. Retrieved 25 May 2022.
  12. "2004 First preference votes for the Australian Capital Territory". Australian Electoral Commission. Retrieved 5 June 2022.
  13. "2004 First preference votes for the Northern Territory". Australian Electoral Commission. Retrieved 5 June 2022.
  14. Stimson, Robert J; Chhetri, Prem; Shyy, Tung-Kai (2007). "Typology of Local patterns of Voter Support for Political Parties at the 2004 Federal Election". People and Place (ERA 2010, 2012, 2015, 2018 Journal(s) Listed). 15: 12 via ePress Monash University.
  15. 1 2 "Australian Federal Election 2004. Labor's school funding policy fuels debate. Barrie Cassidy. Australian Broadcasting Corporation (ABC)". www.abc.net.au. Retrieved 17 May 2021.
  16. "Risky strategy ends in disaster for Labor". The Sydney Morning Herald. 10 October 2004. Retrieved 17 May 2021.