The electoral system of Australia comprises the laws and processes used for the election of members of the Australian Parliament and is governed primarily by the Commonwealth Electoral Act 1918. The system presently has a number of distinctive features including compulsory enrolment; compulsory voting; majority-preferential instant-runoff voting in single-member seats to elect the lower house, the House of Representatives; and the use of the single transferable vote proportional representation system to elect the upper house, the Senate.
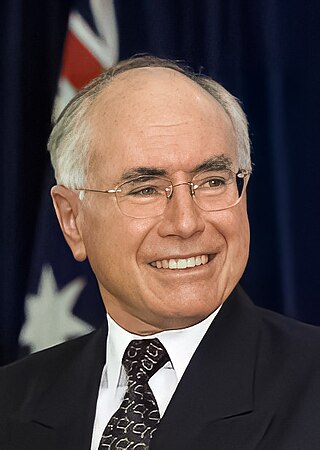
The 2001 Australian federal election was held in Australia on 10 November 2001. All 150 seats in the House of Representatives and 40 seats in the 76-member Senate were up for election. The incumbent Liberal Party of Australia led by Prime Minister of Australia John Howard and coalition partner the National Party of Australia led by John Anderson defeated the opposition Australian Labor Party led by Kim Beazley. Future Opposition Leader Peter Dutton entered parliament at this election. As of 2023 this was the most recent federal election to have a rematch in 11 years, and the most recent repeated election when Howard beat Beazley just 3 years earlier and until 2013 to have both major party leaders running in previous federal elections as major party leaders when in 2013, and the last for both major party leaders to appear in consecutive federal elections in 24 years.
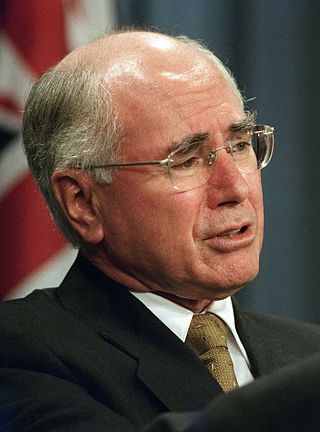
The 2004 Australian federal election was held in Australia on 9 October 2004. All 150 seats in the House of Representatives and 40 seats in the 76-member Senate were up for election. The incumbent Liberal Party of Australia led by Prime Minister of Australia John Howard and coalition partner the National Party of Australia led by John Anderson defeated the opposition Australian Labor Party led by Mark Latham.
The 2004 Australian federal election was held on Saturday 9 October 2004 and it was the Howard government's opportunity to secure its fourth term of government. The Government consisting of the conservative coalition Liberal Party and National Party headed by John Howard and John Anderson respectively were opposed by Mark Latham and the Labor Party.

The Division of Ballarat is an Australian electoral division in the state of Victoria. The division was proclaimed in 1900, and was one of the original 65 divisions to be contested at the first federal election. It was named for the provincial city of the same name by Scottish squatter Archibald Yuille, who established the first settlement − his sheep run called Ballaarat − in 1837, with the name derived from a local Wathawurrung word for the area, balla arat, thought to mean "resting place".
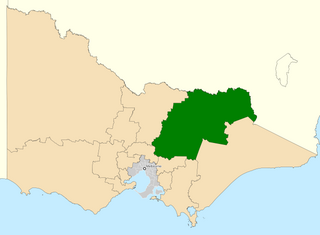
The Division of Indi is an Australian electoral division in the state of Victoria. The division is located in the north-east of the state, adjoining the border with New South Wales. The largest settlements in the division are the regional cities of Wodonga, Wangaratta, and Benalla. Other towns in the electorate include Rutherglen, Mansfield, Beechworth, Myrtleford, Bright, Alexandra, Tallangatta, Corryong and a number of other small villages. While Indi is one of the largest electorates in Victoria, much of it is located within the largely uninhabited Australian Alps. While Wodonga serves as a regional hub for much of the more heavily populated northern part of the electorate, the southern part is closer to Melbourne than Wodonga.
Since 1970, the South Australian House of Assembly — the lower house of the Parliament of South Australia — has consisted of 47 single-member electoral districts consisting of approximately the same number of enrolled voters. The district boundaries are regulated by the State Electoral Office, according to the requirements of the South Australian Constitution and are subject to mandatory redistributions by the South Australian Electoral Districts Boundaries Commission in order to respond to changing demographics.
The Division of Kooyong is an Australian Electoral Division for the Australian House of Representatives in the state of Victoria, which covers an area of approximately 59 km2 (23 sq mi) in the inner-east of Melbourne. It contains the affluent suburbs of Balwyn, Balwyn North, Camberwell, Canterbury, Deepdene, Kew, Kew East, Mont Albert, Mont Albert North, Surrey Hills and parts of Glen Iris.

In Australian politics, the two-party-preferred vote is the result of an election or opinion poll after preferences have been distributed to the highest two candidates, who in some cases can be independents. For the purposes of TPP, the Liberal/National Coalition is usually considered a single party, with Labor being the other major party. Typically the TPP is expressed as the percentages of votes attracted by each of the two major parties, e.g. "Coalition 50%, Labor 50%", where the values include both primary votes and preferences. The TPP is an indicator of how much swing has been attained/is required to change the result, taking into consideration preferences, which may have a significant effect on the result.

The 2010 Australian federal election was held on Saturday, 21 August 2010 to elect members of the 43rd Parliament of Australia. The incumbent centre-left Australian Labor Party led by Prime Minister Julia Gillard won a second term against the opposition centre-right Liberal Party of Australia led by Opposition Leader Tony Abbott and Coalition partner the National Party of Australia, led by Warren Truss, after Labor formed a minority government with the support of three independent MPs and one Australian Greens MP.
McEwan, an Australian Electoral Division in the Australian state of Victoria, has existed since 1984.

The 2019 Australian federal election was held on Saturday 18 May 2019 to elect members of the 46th Parliament of Australia. The election had been called following the dissolution of the 45th Parliament as elected at the 2016 double dissolution federal election. All 151 seats in the House of Representatives and 40 of the 76 seats in the Senate were up for election.

The 2022 Australian federal election was held on Saturday 21 May 2022 to elect members of the 47th Parliament of Australia. The incumbent Liberal/National Coalition government, led by Prime Minister Scott Morrison, sought to win a fourth consecutive term in office but was defeated by the opposition Labor Party, led by Anthony Albanese. Up for election were all 151 seats in the lower house, the House of Representatives, as well as 40 of the 76 seats in the upper house, the Senate.
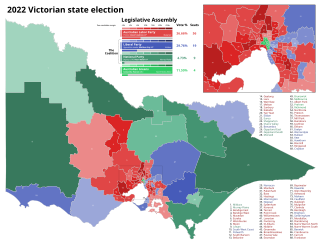
The 2022 Victorian state election was held on Saturday, 26 November 2022 to elect the 60th Parliament of Victoria. All 88 seats in the Legislative Assembly and all 40 seats in the Legislative Council were up for election at the time the writs were issued, however the election in the district of Narracan was deferred due to the death of a candidate.
The next Australian federal election will be held on or before 27 September 2025 to elect members of the 48th Parliament of Australia. All 150 seats in the House of Representatives and likely 40 of the 76 seats in the Senate will be contested. It is expected that at this election, the Labor government of Prime Minister Anthony Albanese will be seeking re-election to a second term in office, opposed by the Liberal/National Coalition under Leader of the Opposition Peter Dutton.

This is a list of electoral division results for the Australian 2004 federal election in the state of Tasmania.

This is a list of electoral division results for the Australian 2007 federal election in the state of Victoria.
This is a list of electoral division results for the Australian 2004 federal election in the state of Queensland.

The 2026 Victorian state election is expected to be held on 28 November 2026 to elect the 61st Parliament of Victoria. All 88 seats in the Legislative Assembly and all 40 seats in the Legislative Council will be up for election, presuming there are no new electorates added in a redistribution.