This is a list of electoral results for the Division of Gellibrand in Australian federal elections from the division's creation in 1949 until the present.
Member | Party | Term | |
---|---|---|---|
Jack Mullens | Labor | 1949–1955 | |
Labor (A-C) | 1955 | ||
Hector McIvor | Labor | 1955–1972 | |
Ralph Willis | Labor | 1972–1998 | |
Nicola Roxon | Labor | 1998–2013 | |
Tim Watts | Labor | 2013–present |
Party | Candidate | Votes | % | ±% | |
---|---|---|---|---|---|
Labor | Tim Watts | 39,382 | 42.72 | −6.30 | |
Liberal | Monica Clark | 24,869 | 26.97 | −3.80 | |
Greens | Suzette Rodoreda | 15,241 | 16.53 | +2.67 | |
United Australia | Abraham Isac | 5,080 | 5.51 | −0.14 | |
One Nation | Rob Braddock | 2,802 | 3.04 | +3.04 | |
Liberal Democrats | Chloe Glasson | 2,185 | 2.37 | +2.37 | |
Victorian Socialists | Andrew Charles | 1,503 | 1.63 | +1.63 | |
Australian Federation | Sharynn Moors | 1,135 | 1.23 | +1.23 | |
Total formal votes | 92,197 | 95.12 | −1.25 | ||
Informal votes | 4,729 | 4.88 | +1.25 | ||
Turnout | 96,926 | 89.67 | −1.22 | ||
Two-party-preferred result | |||||
Labor | Tim Watts | 56,738 | 61.54 | −1.48 | |
Liberal | Monica Clark | 35,459 | 38.46 | +1.48 | |
Labor hold | Swing | −1.48 |
Party | Candidate | Votes | % | ±% | |
---|---|---|---|---|---|
Labor | Tim Watts | 47,942 | 48.66 | +2.43 | |
Liberal | Anthony Mitchell | 28,895 | 29.33 | −0.46 | |
Greens | Bernadette Thomas | 16,303 | 16.55 | −2.40 | |
United Australia | Lisa Bentley | 5,391 | 5.47 | +5.47 | |
Total formal votes | 98,531 | 96.49 | +0.40 | ||
Informal votes | 3,582 | 3.51 | −0.40 | ||
Turnout | 102,113 | 91.83 | +2.77 | ||
Two-party-preferred result | |||||
Labor | Tim Watts | 63,878 | 64.83 | −0.29 | |
Liberal | Anthony Mitchell | 34,653 | 35.17 | +0.29 | |
Labor hold | Swing | −0.29 |
Party | Candidate | Votes | % | ±% | |
---|---|---|---|---|---|
Labor | Tim Watts | 43,340 | 46.90 | +0.86 | |
Liberal | Ben Willis | 24,607 | 26.63 | −0.08 | |
Greens | Jonathon Marsden | 19,855 | 21.48 | +4.75 | |
Independent | David Tran | 4,615 | 4.99 | +4.99 | |
Total formal votes | 92,417 | 95.98 | +1.60 | ||
Informal votes | 3,868 | 4.02 | −1.60 | ||
Turnout | 96,285 | 88.77 | −1.84 | ||
Two-party-preferred result | |||||
Labor | Tim Watts | 63,060 | 68.23 | +1.70 | |
Liberal | Ben Willis | 29,357 | 31.77 | −1.70 | |
Labor hold | Swing | +1.70 |
Party | Candidate | Votes | % | ±% | |
---|---|---|---|---|---|
Labor | Tim Watts | 40,236 | 46.04 | −12.90 | |
Liberal | David McConnell | 23,343 | 26.71 | +4.29 | |
Greens | Rod Swift | 14,623 | 16.73 | +1.50 | |
Palmer United | Dwayne Singleton | 3,413 | 3.91 | +3.91 | |
Sex Party | Allan Cashion | 2,540 | 2.91 | +2.91 | |
Family First | Kerry Arch | 2,266 | 2.59 | +0.21 | |
Christians | Anthony O'Neill | 967 | 1.11 | +1.11 | |
Total formal votes | 87,388 | 94.38 | −0.29 | ||
Informal votes | 5,202 | 5.62 | +0.29 | ||
Turnout | 92,590 | 90.65 | −0.91 | ||
Two-party-preferred result | |||||
Labor | Tim Watts | 58,139 | 66.53 | −7.60 | |
Liberal | David McConnell | 29,249 | 33.47 | +7.60 | |
Labor hold | Swing | −7.60 |
Party | Candidate | Votes | % | ±% | |
---|---|---|---|---|---|
Labor | Nicola Roxon | 48,971 | 58.81 | −1.41 | |
Liberal | David McConnell | 19,070 | 22.90 | +0.06 | |
Greens | Rodney Solin | 12,779 | 15.35 | +5.97 | |
Family First | Liz Mumby | 1,440 | 1.73 | −0.29 | |
Socialist Alliance | Ben Courtice | 528 | 0.63 | −0.96 | |
Socialist Equality | Tania Baptist | 475 | 0.57 | +0.57 | |
Total formal votes | 83,263 | 95.00 | −0.78 | ||
Informal votes | 4,378 | 5.00 | +0.78 | ||
Turnout | 87,641 | 91.66 | −2.50 | ||
Two-party-preferred result | |||||
Labor | Nicola Roxon | 61,531 | 73.90 | +2.44 | |
Liberal | David McConnell | 21,732 | 26.10 | −2.44 | |
Labor hold | Swing | +2.44 |
Party | Candidate | Votes | % | ±% | |
---|---|---|---|---|---|
Labor | Nicola Roxon | 50,681 | 60.22 | +5.60 | |
Liberal | Wayne Tseng | 19,220 | 22.84 | −8.73 | |
Greens | Robert Gibson | 7,898 | 9.38 | +0.30 | |
Independent | Dave O'Neil | 1,950 | 2.32 | +2.32 | |
Family First | Mukesh Garg | 1,700 | 2.02 | +0.18 | |
Socialist Alliance | Ben Courtice | 1,334 | 1.59 | +0.95 | |
Democrats | Rachel Richards | 1,088 | 1.29 | −0.01 | |
Citizens Electoral Council | Rodney Doel | 285 | 0.34 | +0.15 | |
Total formal votes | 84,156 | 95.78 | +2.35 | ||
Informal votes | 3,712 | 4.22 | −2.35 | ||
Turnout | 87,868 | 94.20 | +0.80 | ||
Two-party-preferred result | |||||
Labor | Nicola Roxon | 60,134 | 71.46 | +6.51 | |
Liberal | Wayne Tseng | 24,022 | 28.54 | −6.51 | |
Labor hold | Swing | +6.51 | |||
Party | Candidate | Votes | % | ±% | |
---|---|---|---|---|---|
Labor | Nicola Roxon | 43,383 | 54.62 | −4.78 | |
Liberal | David McConnell | 25,069 | 31.57 | +5.38 | |
Greens | Nam Bui | 7,210 | 9.08 | +2.78 | |
Family First | Michael Lee | 1,463 | 1.84 | +1.84 | |
Democrats | Max Grarock | 1,032 | 1.30 | −5.91 | |
Independent | Wajde Assaf | 606 | 0.76 | +0.76 | |
Socialist Alliance | Linda Waldron | 508 | 0.64 | +0.64 | |
Citizens Electoral Council | Kel Isherwood | 149 | 0.19 | +0.19 | |
Total formal votes | 79,420 | 93.43 | −1.90 | ||
Informal votes | 5,587 | 6.57 | +1.90 | ||
Turnout | 85,007 | 93.40 | −0.47 | ||
Two-party-preferred result | |||||
Labor | Nicola Roxon | 51,587 | 64.95 | −5.46 | |
Liberal | David McConnell | 27,833 | 35.05 | +5.46 | |
Labor hold | Swing | −5.46 | |||
Party | Candidate | Votes | % | ±% | |
---|---|---|---|---|---|
Labor | Nicola Roxon | 46,124 | 60.40 | −7.07 | |
Liberal | Christopher Tann | 19,191 | 25.13 | +5.15 | |
Democrats | Rachel Richards | 5,256 | 6.88 | +2.40 | |
Greens | Michele Finey | 4,831 | 6.33 | +3.47 | |
Jorge Jorquera | 963 | 1.26 | +1.26 | ||
Total formal votes | 76,365 | 95.10 | −0.68 | ||
Informal votes | 3,938 | 4.90 | +0.68 | ||
Turnout | 80,303 | 93.31 | |||
Two-party-preferred result | |||||
Labor | Nicola Roxon | 54,814 | 71.78 | −4.13 | |
Liberal | Christopher Tann | 21,551 | 28.22 | +4.13 | |
Labor hold | Swing | −4.13 | |||
Party | Candidate | Votes | % | ±% | |
---|---|---|---|---|---|
Labor | Nicola Roxon | 51,443 | 67.47 | +4.02 | |
Liberal | Anthony Cursio | 15,233 | 19.98 | −1.81 | |
Democrats | David Wark | 3,420 | 4.49 | −0.82 | |
One Nation | Nikolas Kavalenka | 2,638 | 3.46 | +3.46 | |
Greens | Liz Ingham | 2,180 | 2.86 | −0.44 | |
Unity | Adrian Shorland | 1,078 | 1.41 | +1.41 | |
Natural Law | Michael Pollock | 249 | 0.33 | −0.09 | |
Total formal votes | 76,241 | 95.78 | +1.21 | ||
Informal votes | 3,360 | 4.22 | −1.21 | ||
Turnout | 79,601 | 93.75 | −0.61 | ||
Two-party-preferred result | |||||
Labor | Nicola Roxon | 57,875 | 75.91 | +4.68 | |
Liberal | Anthony Cursio | 18,366 | 24.09 | −4.68 | |
Labor hold | Swing | +4.68 | |||
Party | Candidate | Votes | % | ±% | |
---|---|---|---|---|---|
Labor | Ralph Willis | 46,533 | 63.45 | −5.85 | |
Liberal | John Best | 15,978 | 21.79 | −0.88 | |
Democrats | Khiet Nguyen | 3,889 | 5.30 | +2.03 | |
Greens | Janet Rice | 2,440 | 3.33 | +3.33 | |
Call to Australia | Peter Sanko | 1,630 | 2.22 | +1.30 | |
Independent | John Kelly | 1,392 | 1.90 | +1.90 | |
Against Further Immigration | Luke Spencer | 1,166 | 1.59 | +1.59 | |
Natural Law | Marco Andreacchio | 306 | 0.42 | −0.44 | |
Total formal votes | 73,334 | 94.57 | −1.37 | ||
Informal votes | 4,214 | 5.43 | +1.37 | ||
Turnout | 77,548 | 94.35 | −0.70 | ||
Two-party-preferred result | |||||
Labor | Ralph Willis | 51,902 | 71.23 | −4.33 | |
Liberal | John Best | 20,965 | 28.77 | +4.33 | |
Labor hold | Swing | −4.33 | |||
Party | Candidate | Votes | % | ±% | |
---|---|---|---|---|---|
Labor | Ralph Willis | 47,968 | 69.11 | +14.55 | |
Liberal | Chris Macgregor | 15,779 | 22.73 | −3.79 | |
Democrats | Alan Parker | 2,275 | 3.28 | −7.29 | |
Nada Benson | 2,236 | 3.22 | +3.22 | ||
Natural Law | Leon Staropoli | 585 | 0.84 | +0.84 | |
Call to Australia | Peter Sanko | 570 | 0.82 | +0.82 | |
Total formal votes | 69,413 | 95.93 | +2.47 | ||
Informal votes | 2,944 | 4.07 | −2.47 | ||
Turnout | 72,357 | 95.05 | |||
Two-party-preferred result | |||||
Labor | Ralph Willis | 52,259 | 75.38 | +6.87 | |
Liberal | Chris Macgregor | 17,072 | 24.62 | −6.87 | |
Labor hold | Swing | +6.87 | |||
Party | Candidate | Votes | % | ±% | |
---|---|---|---|---|---|
Labor | Ralph Willis | 36,267 | 54.6 | −10.3 | |
Liberal | Tim Warner | 17,631 | 26.5 | +2.0 | |
Democrats | Frank Fichera | 7,023 | 10.6 | +4.4 | |
Independent | Richard Phillips | 2,487 | 3.7 | +3.7 | |
Independent | Don Veitch | 1,593 | 2.4 | +2.4 | |
Democratic Socialist | Garry Walters | 1,478 | 2.2 | +2.2 | |
Total formal votes | 66,479 | 93.5 | |||
Informal votes | 4,649 | 6.5 | |||
Turnout | 71,128 | 94.7 | |||
Two-party-preferred result | |||||
Labor | Ralph Willis | 45,444 | 68.5 | −2.1 | |
Liberal | Tim Warner | 20,888 | 31.5 | +2.1 | |
Labor hold | Swing | −2.1 | |||
Party | Candidate | Votes | % | ±% | |
---|---|---|---|---|---|
Labor | Ralph Willis | 38,451 | 64.9 | −4.6 | |
Liberal | Tim Warner | 14,506 | 24.5 | +0.5 | |
Democrats | Susan Holmes | 3,665 | 6.2 | +2.5 | |
Independent | Rosalba Vicari | 1,569 | 2.6 | +2.6 | |
Socialist Workers | James Doughney | 1,097 | 1.9 | +0.8 | |
Total formal votes | 59,288 | 91.9 | |||
Informal votes | 5,245 | 8.1 | |||
Turnout | 64,533 | 93.4 | |||
Two-party-preferred result | |||||
Labor | Ralph Willis | 41,804 | 70.6 | −2.8 | |
Liberal | Tim Warner | 17,390 | 29.4 | +2.8 | |
Labor hold | Swing | −2.8 | |||
Party | Candidate | Votes | % | ±% | |
---|---|---|---|---|---|
Labor | Ralph Willis | 40,777 | 69.5 | −0.6 | |
Liberal | Christopher Gowing | 14,073 | 24.0 | +2.7 | |
Democrats | Shirley Bold | 2,148 | 3.7 | −0.3 | |
Democratic Labor | Margaret Reed | 982 | 1.7 | +1.7 | |
Socialist Workers | James Doughney | 672 | 1.1 | −3.1 | |
Total formal votes | 58,652 | 88.1 | |||
Informal votes | 7,913 | 11.9 | |||
Turnout | 66,565 | 94.6 | |||
Two-party-preferred result | |||||
Labor | Ralph Willis | 43,000 | 73.3 | −2.2 | |
Liberal | Christopher Gowing | 15,624 | 26.7 | +2.2 | |
Labor hold | Swing | −2.2 | |||
Party | Candidate | Votes | % | ±% | |
---|---|---|---|---|---|
Labor | Ralph Willis | 47,412 | 70.4 | +4.9 | |
Liberal | Peter Goudge | 14,120 | 21.0 | −1.2 | |
Socialist Workers | James Doughney | 2,842 | 4.2 | +0.8 | |
Democrats | Barry McLeod | 2,695 | 4.0 | −5.0 | |
Australian National Party | Augustus Titter | 304 | 0.5 | +0.5 | |
Total formal votes | 67,373 | 96.2 | |||
Informal votes | 2,678 | 3.8 | |||
Turnout | 70,051 | 95.4 | |||
Two-party-preferred result | |||||
Labor | Ralph Willis | 75.9 | +2.5 | ||
Liberal | Peter Goudge | 24.1 | −2.5 | ||
Labor hold | Swing | +2.5 | |||
Party | Candidate | Votes | % | ±% | |
---|---|---|---|---|---|
Labor | Ralph Willis | 43,474 | 65.5 | +7.2 | |
Liberal | John Kelly | 14,711 | 22.2 | −0.9 | |
Democrats | Shirley Bold | 5,955 | 9.0 | +0.4 | |
Socialist Workers | Lynne Bryer | 2,268 | 3.4 | +3.4 | |
Total formal votes | 66,408 | 94.4 | |||
Informal votes | 3,184 | 4.6 | |||
Turnout | 69,592 | 95.0 | |||
Two-party-preferred result | |||||
Labor | Ralph Willis | 73.4 | +8.9 | ||
Liberal | John Kelly | 26.6 | −8.9 | ||
Labor hold | Swing | +8.9 | |||
Party | Candidate | Votes | % | ±% | |
---|---|---|---|---|---|
Labor | Ralph Willis | 38,433 | 58.3 | −3.1 | |
Liberal | Anton Zajc | 15,241 | 23.1 | −6.6 | |
Democratic Labor | Bert Bailey | 6,606 | 10.0 | +1.0 | |
Democrats | June Smith | 5,663 | 8.6 | +8.6 | |
Total formal votes | 65,943 | 95.2 | |||
Informal votes | 3,295 | 4.8 | |||
Turnout | 69,238 | 95.6 | |||
Two-party-preferred result | |||||
Labor | Ralph Willis | 64.5 | +2.3 | ||
Liberal | Anton Zajc | 35.5 | −2.3 | ||
Labor hold | Swing | +2.3 | |||
Party | Candidate | Votes | % | ±% | |
---|---|---|---|---|---|
Labor | Ralph Willis | 32,669 | 61.4 | −4.5 | |
Liberal | Iris Williams | 15,779 | 29.7 | +7.2 | |
Democratic Labor | Bert Bailey | 4,769 | 9.0 | −0.3 | |
Total formal votes | 53,217 | 97.1 | |||
Informal votes | 1,591 | 2.9 | |||
Turnout | 54,808 | 95.5 | |||
Two-party-preferred result | |||||
Labor | Ralph Willis | 62.2 | −5.9 | ||
Liberal | Iris Williams | 37.8 | +5.9 | ||
Labor hold | Swing | −5.9 | |||
Party | Candidate | Votes | % | ±% | |
---|---|---|---|---|---|
Labor | Ralph Willis | 35,578 | 65.9 | +1.5 | |
Liberal | Cecile Storey | 12,158 | 22.5 | −3.1 | |
Democratic Labor | Bert Bailey | 5,009 | 9.3 | −0.7 | |
Australia | Veronica Schwarz | 1,252 | 2.3 | +2.3 | |
Total formal votes | 53,997 | 96.3 | |||
Informal votes | 2,054 | 3.7 | |||
Turnout | 56,051 | 95.7 | |||
Two-party-preferred result | |||||
Labor | Ralph Willis | 68.1 | +2.7 | ||
Liberal | Cecile Storey | 31.9 | −2.7 | ||
Labor hold | Swing | +2.7 | |||
Party | Candidate | Votes | % | ±% | |
---|---|---|---|---|---|
Labor | Ralph Willis | 32,029 | 64.4 | +2.1 | |
Liberal | David Munro | 12,722 | 25.6 | +1.4 | |
Democratic Labor | Robin Thomas | 4,951 | 10.0 | −3.5 | |
Total formal votes | 49,702 | 96.0 | |||
Informal votes | 2,056 | 4.0 | |||
Turnout | 51,758 | 95.1 | |||
Two-party-preferred result | |||||
Labor | Ralph Willis | 65.4 | +1.7 | ||
Liberal | David Munro | 34.6 | −1.7 | ||
Labor hold | Swing | +1.7 | |||
Party | Candidate | Votes | % | ±% | |
---|---|---|---|---|---|
Labor | Hector McIvor | 31,458 | 62.3 | +8.0 | |
Liberal | Ian Crouch | 12,245 | 24.2 | −1.2 | |
Democratic Labor | Robin Thomas | 6,798 | 13.5 | +1.2 | |
Total formal votes | 50,501 | 94.7 | |||
Informal votes | 2,849 | 5.3 | |||
Turnout | 53,350 | 95.4 | |||
Two-party-preferred result | |||||
Labor | Hector McIvor | 63.7 | +1.9 | ||
Liberal | Ian Crouch | 36.3 | −1.9 | ||
Labor hold | Swing | +1.9 | |||
Party | Candidate | Votes | % | ±% | |
---|---|---|---|---|---|
Labor | Hector McIvor | 19,913 | 55.3 | −8.9 | |
Liberal | John McArthur | 8,777 | 24.4 | +3.4 | |
Democratic Labor | Robin Thomas | 4,426 | 12.3 | +1.1 | |
Communist | Ian Daykin | 2,890 | 8.0 | +4.4 | |
Total formal votes | 36,006 | 94.1 | |||
Informal votes | 2,274 | 5.9 | |||
Turnout | 38,280 | 95.9 | |||
Two-party-preferred result | |||||
Labor | Hector McIvor | 62.8 | −5.9 | ||
Liberal | John McArthur | 37.2 | +5.9 | ||
Labor hold | Swing | −5.9 | |||
Party | Candidate | Votes | % | ±% | |
---|---|---|---|---|---|
Labor | Hector McIvor | 25,035 | 64.2 | −0.9 | |
Liberal | Harley Price | 8,183 | 21.0 | +0.6 | |
Democratic Labor | Jan Roszkowski | 4,375 | 11.2 | −0.7 | |
Communist | David Davies | 1,395 | 3.6 | +1.1 | |
Total formal votes | 38,988 | 97.0 | |||
Informal votes | 1,193 | 3.0 | |||
Turnout | 40,181 | 96.6 | |||
Two-party-preferred result | |||||
Labor | Hector McIvor | 68.7 | +0.2 | ||
Liberal | Harley Price | 31.3 | −0.2 | ||
Labor hold | Swing | +0.2 | |||
Party | Candidate | Votes | % | ±% | |
---|---|---|---|---|---|
Labor | Hector McIvor | 25,634 | 65.1 | +2.1 | |
Liberal | Reginald Cannon | 8,031 | 20.4 | +2.3 | |
Democratic Labor | Jan Roszkowski | 4,691 | 11.9 | −5.1 | |
Communist | Frank Johnson | 1,000 | 2.5 | +0.6 | |
Total formal votes | 39,356 | 96.5 | |||
Informal votes | 1,439 | 3.5 | |||
Turnout | 40,795 | 96.2 | |||
Two-party-preferred result | |||||
Labor | Hector McIvor | 68.5 | +2.0 | ||
Liberal | Reginald Cannon | 31.5 | −2.0 | ||
Labor hold | Swing | +2.0 | |||
Party | Candidate | Votes | % | ±% | |
---|---|---|---|---|---|
Labor | Hector McIvor | 25,054 | 63.0 | +1.6 | |
Liberal | Barry Maddern | 7,211 | 18.1 | −4.0 | |
Democratic Labor | James Eudey | 6,760 | 17.0 | +2.5 | |
Communist | Frank Johnson | 758 | 1.9 | −0.1 | |
Total formal votes | 39,783 | 96.4 | |||
Informal votes | 1,465 | 3.6 | |||
Turnout | 41,248 | 96.3 | |||
Two-party-preferred result | |||||
Labor | Hector McIvor | 66.5 | +0.4 | ||
Liberal | Barry Maddern | 33.5 | −0.4 | ||
Labor hold | Swing | +0.4 | |||
Party | Candidate | Votes | % | ±% | |
---|---|---|---|---|---|
Labor | Hector McIvor | 24,324 | 61.4 | −10.0 | |
Liberal | John Bown | 8,741 | 22.1 | −2.0 | |
Labor (A-C) | James Eudey | 5,733 | 14.5 | +14.5 | |
Communist | Frank Johnson | 788 | 2.0 | −2.3 | |
Total formal votes | 39,586 | 96.0 | |||
Informal votes | 1,654 | 4.0 | |||
Turnout | 41,240 | 95.2 | |||
Two-party-preferred result | |||||
Labor | Hector McIvor | 66.1 | −9.1 | ||
Liberal | John Bown | 33.9 | +9.1 | ||
Labor hold | Swing | −9.1 | |||
Party | Candidate | Votes | % | ±% | |
---|---|---|---|---|---|
Labor | John Mullens | 25,637 | 66.7 | +1.8 | |
Liberal | George Carrington | 10,235 | 26.6 | +1.6 | |
Communist | Alex Dobbin | 2,584 | 6.7 | −3.3 | |
Total formal votes | 38,456 | 98.5 | |||
Informal votes | 605 | 1.5 | |||
Turnout | 39,061 | 96.3 | |||
Two-party-preferred result | |||||
Labor | John Mullens | 72.8 | −1.6 | ||
Liberal | George Carrington | 27.2 | +1.6 | ||
Labor hold | Swing | −1.6 | |||
Party | Candidate | Votes | % | ±% | |
---|---|---|---|---|---|
Labor | John Mullens | 25,863 | 64.9 | +13.6 | |
Liberal | Gordon Trewin | 9,973 | 25.0 | −2.8 | |
Communist | Alex Dobbin | 4,003 | 10.0 | +6.5 | |
Total formal votes | 39,839 | 97.8 | |||
Informal votes | 896 | 2.2 | |||
Turnout | 40,735 | 96.5 | |||
Two-party-preferred result | |||||
Labor | John Mullens | 74.4 | +4.7 | ||
Liberal | Gordon Trewin | 25.6 | −4.7 | ||
Labor hold | Swing | +4.7 | |||
Party | Candidate | Votes | % | ±% | |
---|---|---|---|---|---|
Labor | John Mullens | 20,519 | 51.3 | −22.5 | |
Liberal | William Massey | 8,904 | 22.2 | −4.0 | |
Independent Labor | Angus Macdonald | 6,323 | 15.8 | +15.8 | |
Independent | William Anderson | 2,865 | 7.2 | +7.2 | |
Communist | John Arrowsmith | 1,418 | 3.5 | +3.5 | |
Total formal votes | 40,029 | 97.5 | |||
Informal votes | 1,011 | 2.5 | |||
Turnout | 41,040 | 97.1 | |||
Two-party-preferred result | |||||
Labor | John Mullens | 69.7 | −4.1 | ||
Liberal | William Massey | 30.3 | +4.1 | ||
Labor notional hold | Swing | −4.1 | |||
This is a list of electoral results for the Division of Aston in Australian federal elections from the division's creation in 1984 until the present.
This is a list of electoral results for the Division of Ballarat in Australian federal elections from the division's creation in 1901 until the present. The seat was known as Ballaarat from 1901 until 1977.
This is a list of electoral results for the Division of Bruce in Australian federal elections from the division's creation in 1955 until the present.
This is a list of electoral results for the Division of Deakin in Australian federal elections from the division's creation in 1937 until the present.
This is a list of electoral results for the Division of Dunkley in Australian federal elections from the division's creation in 1984 until the present.
This is a list of electoral results for the Division of Gippsland in Australian federal elections from the division's creation in 1901 until the present.
This is a list of electoral results for the Division of Higgins in Australian federal elections from the division's creation in 1949 until the present.
This is a list of electoral results for the Division of Hotham in Australian federal elections from the division's creation in 1969 until the present.
This is a list of electoral results for the Division of Jagajaga in Australian federal elections from the division's creation in 1984 until the present.
This is a list of electoral results for the Division of Kooyong in Australian federal elections from the division's creation in 1901 until the present.
This is a list of electoral results for the Division of Lalor in Australian federal elections from the division's creation in 1949 until the present.
This is a list of electoral results for the Division of Mallee in Australian federal elections from the division's creation in 1949 until the present.
This is a list of electoral results for the Division of Maribyrnong in Australian federal elections from the division's creation in 1906 until the present.
This is a list of electoral results for the Division of Melbourne in Australian federal elections from the division's creation in 1901 until the present.
This is a list of electoral results for the Division of Scullin in Australian federal elections from the division's creation in 1969 until the present.
This is a list of electoral results for the Division of Wannon in Australian federal elections from the division's creation in 1901 until the present.
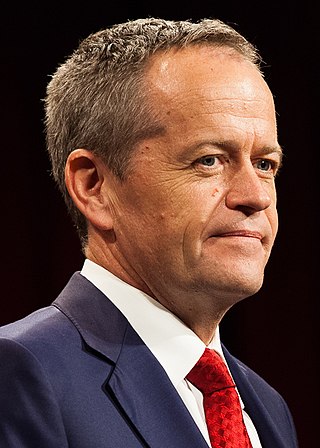
This is a list of electoral division results for the 2016 Australian federal election in the state of Victoria.
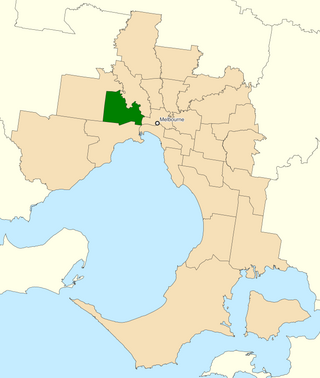
The Division of Fraser is an Australian electoral division in the state of Victoria, which was contested for the first time at the 2019 federal election.
This is a list of electoral division results for the 2019 Australian federal election in the state of Victoria. Victoria bucked the national trend, seeing a swing from the Coalition to Labor, whereas the swing across Australia was from Labor to the Coalition.
This is a list of electoral division results for the 2022 Australian federal election in the state of Victoria.