This is a list of electoral results for the Division of Fawkner in Australian federal elections from the division's creation in 1906 until its abolition in 1969.
Member | Party | Term | |
---|---|---|---|
George Fairbairn | Ind. Protectionist | 1906–1909 | |
Liberal | 1909–1913 | ||
Joseph Hannan | Labor | 1913–1917 | |
George Maxwell | Nationalist | 1917–1929 | |
Independent Nationalist | 1929–1929 | ||
Australian | 1929–1930 | ||
Independent | 1930–1931 | ||
United Australia | 1931–1935 | ||
Harold Holt | United Australia | 1935–1945 | |
Liberal | 1945–1949 | ||
Bill Bourke | Labor | 1949–1955 | |
Labor (A-C) | 1955 | ||
Peter Howson | Liberal | 1955–1969 |
Party | Candidate | Votes | % | ±% | |
---|---|---|---|---|---|
Liberal | Peter Howson | 17,955 | 55.4 | +0.9 | |
Labor | Robert Vernon | 8,883 | 27.4 | -7.1 | |
Democratic Labor | Yvonne Abolins | 3,511 | 10.8 | +2.6 | |
Liberal Reform Group | George Gabriel | 1,699 | 5.2 | +5.2 | |
Independent | Anthony Sanders | 367 | 1.1 | +1.1 | |
Total formal votes | 32,415 | 95.3 | |||
Informal votes | 1,586 | 4.7 | |||
Turnout | 34,001 | 92.5 | |||
Two-party-preferred result | |||||
Liberal | Peter Howson | 69.7 | +6.1 | ||
Labor | Robert Vernon | 30.3 | -6.1 | ||
Liberal hold | Swing | +6.1 | |||
Party | Candidate | Votes | % | ±% | |
---|---|---|---|---|---|
Liberal | Peter Howson | 18,614 | 54.5 | +5.9 | |
Labor | Gwendolyn Noad | 11,774 | 34.5 | -1.3 | |
Democratic Labor | John Speed | 2,818 | 8.2 | -7.4 | |
Independent | George Gabriel | 966 | 2.8 | +2.8 | |
Total formal votes | 34,172 | 98.1 | |||
Informal votes | 651 | 1.9 | |||
Turnout | 34,823 | 94.4 | |||
Two-party-preferred result | |||||
Liberal | Peter Howson | 63.6 | +0.8 | ||
Labor | Gwendolyn Noad | 36.4 | -0.8 | ||
Liberal hold | Swing | +0.8 | |||
Party | Candidate | Votes | % | ±% | |
---|---|---|---|---|---|
Liberal | Peter Howson | 16,580 | 48.6 | +0.3 | |
Labor | Gwendolyn Noad | 12,223 | 35.8 | +2.9 | |
Democratic Labor | Richard Coyne | 5,336 | 15.6 | -3.1 | |
Total formal votes | 34,139 | 97.2 | |||
Informal votes | 987 | 2.8 | |||
Turnout | 35,126 | 93.0 | |||
Two-party-preferred result | |||||
Liberal | Peter Howson | 21,438 | 62.8 | -2.0 | |
Labor | Gwendolyn Noad | 12,701 | 37.2 | +2.0 | |
Liberal hold | Swing | -2.0 | |||
Party | Candidate | Votes | % | ±% | |
---|---|---|---|---|---|
Liberal | Peter Howson | 17,312 | 48.3 | +2.1 | |
Labor | George Smart | 11,797 | 32.9 | +6.4 | |
Democratic Labor | Bill Bourke | 6,709 | 18.7 | -8.6 | |
Total formal votes | 35,818 | 97.3 | |||
Informal votes | 996 | 2.7 | |||
Turnout | 36,814 | 94.4 | |||
Two-party-preferred result | |||||
Liberal | Peter Howson | 23,198 | 64.8 | +12.5 | |
Labor | George Smart | 12,620 | 35.2 | +35.2 | |
Liberal hold | Swing | +12.5 | |||
Party | Candidate | Votes | % | ±% | |
---|---|---|---|---|---|
Liberal | Peter Howson | 17,645 | 46.2 | -4.7 | |
Labor (A-C) | Bill Bourke | 10,450 | 27.3 | +27.3 | |
Labor | Patrick Thompson | 10,132 | 26.5 | -22.6 | |
Total formal votes | 38,227 | 97.0 | |||
Informal votes | 1,166 | 3.0 | |||
Turnout | 39,393 | 93.1 | |||
Two-party-preferred result | |||||
Liberal | Peter Howson | 19,992 | 52.3 | +1.4 | |
Labor (A-C) | Bill Bourke | 18,235 | 47.7 | -1.4 | |
Liberal hold | Swing | +1.4 | |||
Party | Candidate | Votes | % | ±% | |
---|---|---|---|---|---|
Labor | Bill Bourke | 18,038 | 50.2 | -1.4 | |
Liberal | Peter Howson | 17,920 | 49.8 | +2.2 | |
Total formal votes | 35,958 | 99.0 | |||
Informal votes | 378 | 1.0 | |||
Turnout | 36,336 | 95.5 | |||
Labor hold | Swing | -1.8 | |||
Party | Candidate | Votes | % | ±% | |
---|---|---|---|---|---|
Labor | Bill Bourke | 20,158 | 51.6 | +1.6 | |
Liberal | Peter Howson | 18,586 | 47.6 | -2.4 | |
Independent | Colin Kennedy | 332 | 0.8 | +0.8 | |
Total formal votes | 39,076 | 98.3 | |||
Informal votes | 681 | 1.7 | |||
Turnout | 39,757 | 95.7 | |||
Two-party-preferred result | |||||
Labor | Bill Bourke | 52.0 | +2.0 | ||
Liberal | Peter Howson | 48.0 | -2.0 | ||
Labor hold | Swing | +2.0 | |||
Party | Candidate | Votes | % | ±% | |
---|---|---|---|---|---|
Labor | Bill Bourke | 20,228 | 50.0 | +2.3 | |
Liberal | Magnus Cormack | 20,201 | 50.0 | +1.8 | |
Total formal votes | 40,429 | 98.1 | |||
Informal votes | 782 | 1.9 | |||
Turnout | 41,211 | 95.2 | |||
Labor hold | Swing | -0.8 | |||
Party | Candidate | Votes | % | ±% | |
---|---|---|---|---|---|
Liberal | Harold Holt | 39,047 | 53.5 | +20.1 | |
Labor | Bill Bourke | 30,835 | 42.2 | +9.4 | |
Independent | Mascotte Brown | 2,121 | 2.9 | +2.9 | |
Services | Harold Rettig | 1,042 | 1.4 | +1.4 | |
Total formal votes | 73,045 | 97.1 | |||
Informal votes | 2,155 | 2.9 | |||
Turnout | 75,200 | 89.5 | |||
Two-party-preferred result | |||||
Liberal | Harold Holt | 56.2 | -1.8 | ||
Labor | Bill Bourke | 43.8 | +1.8 | ||
Liberal hold | Swing | -1.8 | |||
Party | Candidate | Votes | % | ±% | |
---|---|---|---|---|---|
United Australia | Harold Holt | 23,931 | 33.4 | -27.4 | |
Labor | Thomas Jude | 23,508 | 32.8 | -3.0 | |
Independent | William Cremor | 15,958 | 22.3 | +22.3 | |
Independent | Vernon Margetts | 3,437 | 4.8 | +4.8 | |
Communist | Malcolm Good | 3,300 | 4.6 | +4.6 | |
Independent | Charles Kennett | 1,196 | 1.7 | +1.7 | |
Independent | Ruth Ravenscroft | 381 | 0.5 | +0.5 | |
Total formal votes | 71,711 | 95.6 | |||
Informal votes | 3,275 | 4.4 | |||
Turnout | 74,986 | 92.9 | |||
Two-party-preferred result | |||||
United Australia | Harold Holt | 41,602 | 58.0 | -4.5 | |
Labor | Thomas Jude | 30,109 | 42.0 | +4.5 | |
United Australia hold | Swing | -4.5 | |||
Party | Candidate | Votes | % | ±% | |
---|---|---|---|---|---|
United Australia | Harold Holt | 38,387 | 60.8 | -5.7 | |
Labor | Arthur Fraser | 22,558 | 35.8 | +7.4 | |
Independent | Alexander Mills | 2,152 | 3.4 | +3.4 | |
Total formal votes | 63,097 | 98.0 | |||
Informal votes | 1,293 | 2.0 | |||
Turnout | 64,390 | 93.9 | |||
Two-party-preferred result | |||||
United Australia | Harold Holt | 62.5 | +0.1 | ||
Labor | Arthur Fraser | 37.5 | -0.1 | ||
United Australia hold | Swing | +0.1 | |||
Party | Candidate | Votes | % | ±% | |
---|---|---|---|---|---|
United Australia | Harold Holt | 33,277 | 55.1 | -12.4 | |
Labor | William Doran | 17,124 | 28.4 | +2.7 | |
Independent | William Bottomley | 9,941 | 16.5 | +16.5 | |
Total formal votes | 60,342 | 97.4 | |||
Informal votes | 1,602 | 2.6 | |||
Turnout | 61,944 | 93.8 | |||
Two-party-preferred result | |||||
United Australia | Harold Holt | 62.4 | -8.5 | ||
Labor | William Doran | 37.6 | +8.5 | ||
United Australia hold | Swing | -8.5 | |||
Party | Candidate | Votes | % | ±% | |
---|---|---|---|---|---|
United Australia | Harold Holt | 24,594 | 59.9 | -6.6 | |
Labor | Don Cameron | 16,433 | 40.1 | +12.4 | |
Total formal votes | 41,027 | 97.7 | |||
Informal votes | 946 | 2.3 | |||
Turnout | 41,973 | 87.4 | |||
United Australia hold | Swing | -9.5 | |||
Party | Candidate | Votes | % | ±% | |
---|---|---|---|---|---|
United Australia | George Maxwell | 30,029 | 66.5 | -1.2 | |
Labor | William Smith | 12,515 | 27.7 | +0.5 | |
Social Credit | Frederick Paice | 2,592 | 5.7 | +5.7 | |
Total formal votes | 45,136 | 96.6 | |||
Informal votes | 1,569 | 3.4 | |||
Turnout | 46,705 | 93.7 | |||
Two-party-preferred result | |||||
United Australia | George Maxwell | 69.4 | -0.9 | ||
Labor | William Smith | 30.6 | +0.9 | ||
United Australia hold | Swing | -0.9 | |||
Party | Candidate | Votes | % | ±% | |
---|---|---|---|---|---|
United Australia | George Maxwell | 28,586 | 67.7 | +29.3 | |
Labor | John McKenna | 11,508 | 27.2 | +27.2 | |
Independent | David Robertson | 2,159 | 5.1 | +5.1 | |
Total formal votes | 42,253 | 98.0 | |||
Informal votes | 880 | 2.0 | |||
Turnout | 43,133 | 93.1 | |||
Two-party-preferred result | |||||
United Australia | George Maxwell | 70.3 | +21.7 | ||
Labor | John McKenna | 29.7 | +29.7 | ||
United Australia gain from Ind. Nationalist | Swing | +21.7 |
Party | Candidate | Votes | % | ±% | |
---|---|---|---|---|---|
Ind. Nationalist | George Maxwell | 25,564 | 59.4 | +59.4 | |
Nationalist | Arthur Robinson | 16,547 | 38.4 | -23.3 | |
Independent | James Ronald | 950 | 2.2 | +2.2 | |
Total formal votes | 43,061 | 98.7 | |||
Informal votes | 584 | 1.3 | |||
Turnout | 43,645 | 93.5 | |||
Two-party-preferred result | |||||
Ind. Nationalist | George Maxwell | 61.4 | +61.4 | ||
Nationalist | Arthur Robinson | 38.6 | -23.1 | ||
Ind. Nationalist gain from Nationalist | Swing | +23.1 |
Party | Candidate | Votes | % | ±% | |
---|---|---|---|---|---|
Nationalist | George Maxwell | 25,388 | 61.7 | +2.3 | |
Labor | Nicholas Roberts | 15,731 | 38.3 | -2.3 | |
Total formal votes | 41,119 | 96.8 | |||
Informal votes | 1,356 | 3.2 | |||
Turnout | 42,475 | 92.1 | |||
Nationalist hold | Swing | +2.3 | |||
Party | Candidate | Votes | % | ±% | |
---|---|---|---|---|---|
Nationalist | George Maxwell | 26,028 | 59.4 | +7.2 | |
Labor | Alfred Foster | 17,809 | 40.6 | -0.8 | |
Total formal votes | 43,837 | 98.8 | |||
Informal votes | 543 | 1.2 | |||
Turnout | 44,380 | 92.7 | |||
Nationalist hold | Swing | +1.4 | |||
Party | Candidate | Votes | % | ±% | |
---|---|---|---|---|---|
Nationalist | George Maxwell | 12,472 | 52.2 | -6.3 | |
Labor | Alfred Foster | 9,881 | 41.4 | +5.3 | |
Liberal | John Murphy | 1,533 | 6.4 | +6.4 | |
Total formal votes | 23,886 | 96.9 | |||
Informal votes | 766 | 3.1 | |||
Turnout | 24,652 | 55.0 | |||
Two-party-preferred result | |||||
Nationalist | George Maxwell | 58.0 | -5.5 | ||
Labor | Alfred Foster | 42.0 | +5.5 | ||
Nationalist hold | Swing | -5.5 | |||
Party | Candidate | Votes | % | ±% | |
---|---|---|---|---|---|
Nationalist | George Maxwell | 15,819 | 51.5 | +0.4 | |
Labor | Joseph Hannan | 14,927 | 48.5 | +0.2 | |
Total formal votes | 30,746 | 99.2 | |||
Informal votes | 251 | 0.8 | |||
Turnout | 30,997 | 77.1 | |||
Nationalist hold | Swing | +0.1 | |||
Party | Candidate | Votes | % | ±% | |
---|---|---|---|---|---|
Nationalist | George Maxwell | 16,907 | 51.1 | +10.4 | |
Labor | Joseph Hannan | 15,976 | 48.3 | -11.0 | |
Independent | Frank Henty | 203 | 0.6 | +0.6 | |
Total formal votes | 33,086 | 97.2 | |||
Informal votes | 959 | 2.8 | |||
Turnout | 34,045 | 84.7 | |||
Nationalist gain from Labor | Swing | +10.7 |
Party | Candidate | Votes | % | ±% | |
---|---|---|---|---|---|
Labor | Joseph Hannan | 17,483 | 59.3 | +6.0 | |
Liberal | Frank Carse | 11,981 | 40.7 | -6.0 | |
Total formal votes | 29,464 | 97.9 | |||
Informal votes | 626 | 2.1 | |||
Turnout | 30,090 | 75.7 | |||
Labor hold | Swing | +6.0 | |||
Party | Candidate | Votes | % | ±% | |
---|---|---|---|---|---|
Labor | Joseph Hannan | 16,643 | 53.3 | +2.8 | |
Liberal | George Fairbairn | 14,610 | 46.7 | -2.8 | |
Total formal votes | 31,253 | 97.7 | |||
Informal votes | 720 | 2.3 | |||
Turnout | 31,973 | 73.0 | |||
Labor hold | Swing | +2.8 | |||
Party | Candidate | Votes | % | ±% | |
---|---|---|---|---|---|
Liberal | George Fairbairn | 14,544 | 58.9 | -8.3 | |
Labour | Joseph Hannan | 10,161 | 41.1 | +8.3 | |
Total formal votes | 24,705 | 98.5 | |||
Informal votes | 379 | 1.5 | |||
Turnout | 25,084 | 60.6 | |||
Liberal hold | Swing | -5.0 | |||
Party | Candidate | Votes | % | ±% | |
---|---|---|---|---|---|
Ind. Protectionist | George Fairbairn | 12,212 | 60.5 | +60.5 | |
Labour | Thomas Smith | 6,621 | 32.8 | +32.8 | |
Protectionist | John Miller | 1,360 | 6.7 | +6.7 | |
Total formal votes | 20,193 | 96.4 | |||
Informal votes | 759 | 3.6 | |||
Turnout | 20,952 | 57.3 | |||
Ind. Protectionist win | (new seat) | ||||
The Division of Higgins is an Australian Electoral Division in Victoria for the Australian House of Representatives. The division covers 41 km2 (16 sq mi) in Melbourne's inner south-eastern suburbs. The main suburbs include Armadale, Ashburton, Carnegie, Glen Iris, Kooyong, Malvern, Malvern East, Murrumbeena, Prahran and Toorak; along with parts of Camberwell, Ormond and South Yarra. Though historically a safe conservative seat, Higgins was won by the Liberal Party by a margin of just 3.9 percent over the Labor Party at the 2019 election, the closest result in the seat’s history. It then flipped to Labor in the 2022 election.
In Australia, electoral districts for the Australian House of Representatives are called divisions or more commonly referred to as electorates or seats. There are currently 151 single-member electorates for the Australian House of Representatives.
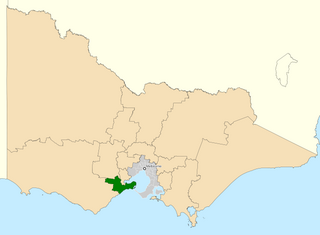
The Division of Corangamite is an Australian electoral division in the state of Victoria. The division was proclaimed in 1900, and was one of the original 65 divisions to be contested at the first federal election. It is named for Lake Corangamite, although the lake no longer falls within the division's boundaries.
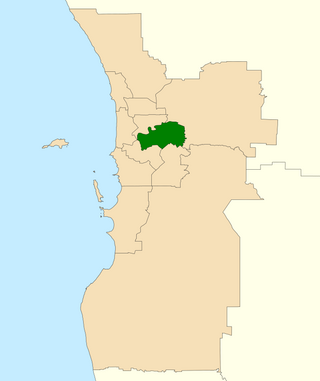
The Division of Swan is an Australian electoral division located in Western Australia.
The Division of Ballarat is an Australian electoral division in the state of Victoria. The division was proclaimed in 1900, and was one of the original 65 divisions to be contested at the first federal election. It was named for the provincial city of the same name by Scottish squatter Archibald Yuille, who established the first settlement − his sheep run called Ballaarat − in 1837, with the name derived from a local Wathawurrung word for the area, balla arat, thought to mean "resting place".
The Division of Batman was an Australian Electoral Division in the state of Victoria. It took its name from John Batman, one of the founders of the city of Melbourne. The division was created in 1906, replacing the Division of Northern Melbourne, and was abolished in 2019 and replaced by the Division of Cooper.
The Division of Bendigo is an Australian electoral division in the state of Victoria. The division was proclaimed in 1900, and was one of the original 65 divisions to be contested at the first federal election. It is named for the city of Bendigo.
The Division of Herbert is an Australian electoral division in the state of Queensland. Eligible voters within the Division elect a single representative, known as the member for Herbert, to the Australian House of Representatives.
The Division of Braddon is an Australian electoral division in the state of Tasmania. The current MP is Gavin Pearce of the Liberal Party, who was elected at the 2019 federal election.
The Division of Macquarie is an Australian electoral division in the state of New South Wales. The division was created in 1900 and was one of the original 65 divisions contested at the first federal election. It is named for Lachlan Macquarie, who was Governor of New South Wales between 1810 and 1821.
The Division of Maranoa is an Australian electoral division in Queensland.
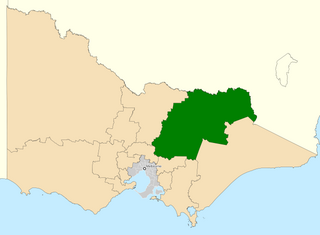
The Division of Indi is an Australian electoral division in the state of Victoria. The division is located in the north-east of the state, adjoining the border with New South Wales. The largest settlements in the division are the regional cities of Wodonga, Wangaratta, and Benalla. Other towns in the electorate include Rutherglen, Mansfield, Beechworth, Myrtleford, Bright, Alexandra, Tallangatta, Corryong and a number of other small villages. While Indi is one of the largest electorates in Victoria, much of it is located within the largely uninhabited Australian Alps. While Wodonga serves as a regional hub for much of the more heavily populated northern part of the electorate, the southern part is closer to Melbourne than Wodonga.
The Division of Page is an Australian electoral division in the state of New South Wales.
The Australian People's Party was a registered political party in Australia. It was registered by the Australian Electoral Commission in March 2017. It was formed in 2014. The party recruited enough members to gain registration in March 2017. The party said its aim was to improve standards of living and rights for all Australians through commonsense policies. The party describes itself as a centrist party. The party was de-registered in November 2021 by the Australian Electoral Commission for not having 500 members.
In Australia, a redistribution is the process of redrawing the boundaries of electoral divisions for the House of Representatives arising from changes in population and changes in the number of representatives. There is no redistribution for the Senate as each State constitutes a division, though with multiple members. The Australian Electoral Commission (AEC), an independent statutory authority, oversees the apportionment and redistribution process for federal divisions, taking into account a number of factors. Politicians, political parties and the public may make submissions to the AEC on proposed new boundaries, but any interference with their deliberations is considered a serious offence.
The Division of Flynn is an Australian Electoral Division in Queensland.
This is a list of electoral results for the Division of Warringah in Australian federal elections from the division's creation in 1922 until the present.
This is a list of electoral results for the Division of Wentworth in Australian federal elections from the division's creation in 1901 until the present.
This is a list of electoral results for the Division of Batman in Australian federal elections from the division's creation in 1906 until its abolition in 2019. The Division was then renamed Cooper
The Division of Monash is an Australian Electoral Division in the state of Victoria, which was contested for the first time at the 2019 federal election.