This is a list of electoral results for the Division of Menzies in Australian federal elections from the division's creation in 1984 until the present.
Member | Party | Term | |
---|---|---|---|
Neil Brown | Liberal | 1984–1991 | |
Kevin Andrews | 1991–2022 | ||
Keith Wolahan | 2022–present |
Party | Candidate | Votes | % | ±% | |
---|---|---|---|---|---|
Liberal | Keith Wolahan | 42,526 | 42.10 | −8.77 | |
Labor | Naomi Oakley | 33,635 | 33.30 | +2.77 | |
Greens | Bill Pheasant | 14,289 | 14.14 | +4.01 | |
Liberal Democrats | Greg Cheesman | 3,646 | 3.61 | +3.61 | |
United Australia | Nathan Scaglione | 3,643 | 3.61 | +1.19 | |
One Nation | John Hayes | 2,312 | 2.29 | +2.29 | |
Australian Federation | Sanjeev Sabhlok | 968 | 0.96 | +0.96 | |
Total formal votes | 101,019 | 96.79 | +0.42 | ||
Informal votes | 3,355 | 3.21 | −0.42 | ||
Turnout | 104,374 | 92.58 | −2.65 | ||
Two-party-preferred result | |||||
Liberal | Keith Wolahan | 51,198 | 50.68 | −6.34 | |
Labor | Naomi Oakley | 49,821 | 49.32 | +6.34 | |
Liberal hold | Swing | −6.34 |
Party | Candidate | Votes | % | ±% | |
---|---|---|---|---|---|
Liberal | Kevin Andrews | 50,863 | 51.73 | +1.89 | |
Labor | Stella Yee | 29,539 | 30.04 | +3.12 | |
Greens | Robert Humphreys | 10,264 | 10.44 | +0.05 | |
Democratic Labour | Teresa Kelleher | 3,026 | 3.08 | +3.08 | |
United Australia | Brett Fuller | 2,605 | 2.65 | +2.65 | |
Reason | Rachel Payne | 2,029 | 2.06 | +2.06 | |
Total formal votes | 98,326 | 96.68 | +1.23 | ||
Informal votes | 3,376 | 3.32 | −1.23 | ||
Turnout | 101,702 | 94.34 | −0.91 | ||
Two-party-preferred result | |||||
Liberal | Kevin Andrews | 56,568 | 57.53 | −0.28 | |
Labor | Stella Yee | 41,758 | 42.47 | +0.28 | |
Liberal hold | Swing | −0.28 |
Party | Candidate | Votes | % | ±% | |
---|---|---|---|---|---|
Liberal | Kevin Andrews | 45,133 | 51.72 | −7.16 | |
Labor | Adam Rundell | 21,468 | 24.60 | −1.06 | |
Greens | Richard Cranston | 7,921 | 9.08 | +0.45 | |
Independent | Stephen Mayne | 5,863 | 6.72 | +6.72 | |
Family First | David Clark | 2,842 | 3.26 | +1.10 | |
Animal Justice | Antony Hulbert | 2,327 | 2.67 | +2.67 | |
Voluntary Euthanasia | Jay Franklin | 973 | 1.12 | +1.12 | |
Independent | Ramon Robinson | 730 | 0.84 | −0.61 | |
Total formal votes | 87,257 | 94.98 | −0.72 | ||
Informal votes | 4,615 | 5.02 | +0.72 | ||
Turnout | 91,872 | 92.61 | −1.46 | ||
Two-party-preferred result | |||||
Liberal | Kevin Andrews | 52,842 | 60.56 | −3.89 | |
Labor | Adam Rundell | 34,415 | 39.44 | +3.89 | |
Liberal hold | Swing | −3.89 |
Party | Candidate | Votes | % | ±% | |
---|---|---|---|---|---|
Liberal | Kevin Andrews | 52,290 | 58.88 | +5.33 | |
Labor | Manoj Kumar | 22,788 | 25.66 | −6.52 | |
Greens | Richard Cranston | 7,663 | 8.63 | −2.09 | |
Palmer United | Agostino Guardiani | 2,353 | 2.65 | +2.65 | |
Family First | Andrew Conlon | 1,917 | 2.16 | −1.39 | |
Independent | Ramon Robinson | 1,287 | 1.45 | +1.45 | |
Rise Up Australia | Phil Baker | 508 | 0.57 | +0.57 | |
Total formal votes | 88,806 | 95.70 | −0.20 | ||
Informal votes | 3,987 | 4.30 | +0.20 | ||
Turnout | 92,793 | 94.13 | −0.06 | ||
Two-party-preferred result | |||||
Liberal | Kevin Andrews | 57,235 | 64.45 | +5.80 | |
Labor | Manoj Kumar | 31,571 | 35.55 | −5.80 | |
Liberal hold | Swing | +5.80 |
Party | Candidate | Votes | % | ±% | |
---|---|---|---|---|---|
Liberal | Kevin Andrews | 43,932 | 53.63 | +2.03 | |
Labor | Joy Banerji | 26,287 | 32.09 | −2.69 | |
Greens | Chris Padgham | 8,802 | 10.75 | +4.46 | |
Family First | Ken Smithies | 2,892 | 3.53 | +1.11 | |
Total formal votes | 81,913 | 95.91 | −1.33 | ||
Informal votes | 3,497 | 4.09 | +1.33 | ||
Turnout | 85,410 | 93.89 | −2.26 | ||
Two-party-preferred result | |||||
Liberal | Kevin Andrews | 48,102 | 58.72 | +2.70 | |
Labor | Joy Banerji | 33,811 | 41.28 | −2.70 | |
Liberal hold | Swing | +2.70 |
Party | Candidate | Votes | % | ±% | |
---|---|---|---|---|---|
Liberal | Kevin Andrews | 43,393 | 51.60 | −5.19 | |
Labor | Andrew Campbell | 29,249 | 34.78 | +1.99 | |
Greens | David Ellis | 5,291 | 6.29 | −0.17 | |
Independent | Philip Nitschke | 3,297 | 3.92 | +3.92 | |
Family First | Ken Smithies | 2,036 | 2.42 | +0.28 | |
Democrats | Damian Wise | 822 | 0.98 | −0.53 | |
Total formal votes | 84,088 | 97.24 | +0.85 | ||
Informal votes | 2,385 | 2.76 | −0.85 | ||
Turnout | 86,473 | 96.12 | +0.68 | ||
Two-party-preferred result | |||||
Liberal | Kevin Andrews | 47,104 | 56.02 | −4.65 | |
Labor | Andrew Campbell | 36,984 | 43.98 | +4.65 | |
Liberal hold | Swing | -4.65 | |||
Party | Candidate | Votes | % | ±% | |
---|---|---|---|---|---|
Liberal | Kevin Andrews | 46,132 | 56.79 | +3.46 | |
Labor | Brian Jones | 26,635 | 32.79 | −0.41 | |
Greens | Matthew Wright | 5,251 | 6.46 | +0.97 | |
Family First | John Bridge | 1,739 | 2.14 | +2.14 | |
Democrats | Anne Page | 1,226 | 1.51 | −5.09 | |
Citizens Electoral Council | Jordon Davidson | 256 | 0.32 | +0.32 | |
Total formal votes | 81,239 | 96.39 | −0.22 | ||
Informal votes | 3,039 | 3.61 | +0.22 | ||
Turnout | 84,278 | 95.44 | −0.37 | ||
Two-party-preferred result | |||||
Liberal | Kevin Andrews | 49,288 | 60.67 | +1.76 | |
Labor | Brian Jones | 31,951 | 39.33 | −1.76 | |
Liberal hold | Swing | +1.76 | |||
Party | Candidate | Votes | % | ±% | |
---|---|---|---|---|---|
Liberal | Kevin Andrews | 41,565 | 53.28 | +6.39 | |
Labor | Olga Vasilopoulos | 25,895 | 33.19 | +0.34 | |
Democrats | Michael Ryan | 5,113 | 6.55 | +0.74 | |
Greens | Barry Watson | 4,301 | 5.51 | +5.51 | |
No GST | Brendan Griffin | 1,135 | 1.45 | +1.45 | |
Total formal votes | 78,009 | 96.55 | −0.27 | ||
Informal votes | 2,784 | 3.45 | +0.27 | ||
Turnout | 80,793 | 95.78 | |||
Two-party-preferred result | |||||
Liberal | Kevin Andrews | 45,977 | 58.94 | +3.54 | |
Labor | Olga Vasilopoulos | 32,032 | 41.06 | −3.54 | |
Liberal hold | Swing | +3.54 | |||
Party | Candidate | Votes | % | ±% | |
---|---|---|---|---|---|
Liberal | Kevin Andrews | 35,415 | 46.89 | −8.63 | |
Labor | Peter Allan | 24,812 | 32.85 | −1.02 | |
Independent | Philip Nitschke | 6,843 | 9.06 | +9.06 | |
Democrats | Damian Wise | 4,395 | 5.82 | −3.02 | |
One Nation | John Casley | 1,383 | 1.83 | +1.83 | |
Unity | Mohamed Morsy | 1,383 | 1.83 | +1.83 | |
Independent | Marcia Riordan | 1,060 | 1.40 | +1.40 | |
Natural Law | Mark Bunn | 240 | 0.32 | −1.46 | |
Total formal votes | 75,531 | 96.82 | −0.71 | ||
Informal votes | 2,480 | 3.18 | +0.71 | ||
Turnout | 78,011 | 95.79 | −0.85 | ||
Two-party-preferred result | |||||
Liberal | Kevin Andrews | 41,844 | 55.40 | −5.59 | |
Labor | Peter Allan | 33,687 | 44.60 | +5.59 | |
Liberal hold | Swing | -5.59 | |||
Party | Candidate | Votes | % | ±% | |
---|---|---|---|---|---|
Liberal | Kevin Andrews | 41,479 | 55.52 | −2.14 | |
Labor | Peter De Angelis | 25,307 | 33.87 | −3.05 | |
Democrats | Angela Carter | 6,602 | 8.84 | +4.53 | |
Natural Law | Susan Brown | 1,328 | 1.78 | +0.66 | |
Total formal votes | 74,716 | 97.53 | +0.27 | ||
Informal votes | 1,891 | 2.47 | −0.27 | ||
Turnout | 76,607 | 96.64 | −0.53 | ||
Two-party-preferred result | |||||
Liberal | Kevin Andrews | 45,330 | 60.99 | +1.73 | |
Labor | Peter De Angelis | 28,993 | 39.01 | −1.73 | |
Liberal hold | Swing | +1.73 | |||
Party | Candidate | Votes | % | ±% | |
---|---|---|---|---|---|
Liberal | Kevin Andrews | 40,200 | 57.37 | −1.08 | |
Labor | Peter De Angelis | 26,154 | 37.32 | +9.46 | |
Democrats | John Dobinson | 2,955 | 4.22 | −7.38 | |
Natural Law | Denis Quinlan | 762 | 1.09 | +1.09 | |
Total formal votes | 70,071 | 97.18 | +0.24 | ||
Informal votes | 2,030 | 2.82 | −0.24 | ||
Turnout | 72,101 | 97.17 | |||
Two-party-preferred result | |||||
Liberal | Kevin Andrews | 41,488 | 59.23 | −5.02 | |
Labor | Peter De Angelis | 28,553 | 40.77 | +5.02 | |
Liberal hold | Swing | -5.02 | |||
Party | Candidate | Votes | % | ±% | |
---|---|---|---|---|---|
Liberal | Kevin Andrews | 40,154 | 67.7 | +9.3 | |
Democrats | Ken Peak | 13,070 | 22.0 | +10.4 | |
Against Further Immigration | Denis McCormack | 4,055 | 6.8 | +6.8 | |
Independent | Jim Bernard | 2,035 | 3.4 | +3.4 | |
Total formal votes | 59,314 | 95.0 | |||
Informal votes | 3,103 | 5.0 | |||
Turnout | 62,417 | 86.1 | |||
Two-party-preferred result | |||||
Liberal | Kevin Andrews | 42,719 | 72.0 | +7.7 | |
Democrats | Ken Peak | 16,578 | 28.0 | +28.0 | |
Liberal hold | Swing | +7.7 | |||
Party | Candidate | Votes | % | ±% | |
---|---|---|---|---|---|
Liberal | Neil Brown | 38,844 | 58.4 | +3.4 | |
Labor | Ivana Csar | 18,521 | 27.9 | −6.9 | |
Democrats | Elizabeth Piper-Johnson | 7,710 | 11.6 | +3.0 | |
Call to Australia | Ron Suter | 1,384 | 2.1 | +2.1 | |
Total formal votes | 66,459 | 96.9 | |||
Informal votes | 2,094 | 3.1 | |||
Turnout | 68,553 | 96.6 | |||
Two-party-preferred result | |||||
Liberal | Neil Brown | 42,684 | 64.3 | +5.0 | |
Labor | Ivana Csar | 23,742 | 35.7 | −5.0 | |
Liberal hold | Swing | +5.0 | |||
Party | Candidate | Votes | % | ±% | |
---|---|---|---|---|---|
Liberal | Neil Brown | 32,401 | 53.0 | +2.4 | |
Labor | Ivana Csar | 22,505 | 36.8 | −4.0 | |
Democrats | Marjorie White | 5,266 | 8.6 | +2.3 | |
Unite Australia | Bruce Plain | 972 | 1.6 | +1.6 | |
Total formal votes | 61,144 | 95.3 | |||
Informal votes | 2,999 | 4.7 | |||
Turnout | 64,143 | 95.1 | |||
Two-party-preferred result | |||||
Liberal | Neil Brown | 35,049 | 57.3 | +1.6 | |
Labor | Ivana Csar | 26,085 | 42.7 | −1.6 | |
Liberal hold | Swing | +1.6 | |||
Party | Candidate | Votes | % | ±% | |
---|---|---|---|---|---|
Liberal | Neil Brown | 28,395 | 50.6 | +1.6 | |
Labor | David McKenzie | 22,901 | 40.8 | −2.2 | |
Democrats | Lynden Kenyon | 3,519 | 6.3 | +0.0 | |
Democratic Labor | Vin Considine | 1,306 | 2.3 | +0.9 | |
Total formal votes | 56,121 | 92.7 | |||
Informal votes | 4,388 | 7.3 | |||
Turnout | 60,509 | 96.0 | |||
Two-party-preferred result | |||||
Liberal | Neil Brown | 31,264 | 55.7 | +2.3 | |
Labor | David McKenzie | 24,840 | 44.3 | −2.3 | |
Liberal notional hold | Swing | +2.3 | |||
This is a list of electoral results for the Division of Aston in Australian federal elections from the division's creation in 1984 until the present.
This is a list of electoral results for the Division of Ballarat in Australian federal elections from the division's creation in 1901 until the present. The seat was known as Ballaarat from 1901 until 1977.
This is a list of electoral results for the Division of Bruce in Australian federal elections from the division's creation in 1955 until the present.
This is a list of electoral results for the Division of Casey in Australian federal elections from the division's creation in 1969 until the present.
This is a list of electoral results for the Division of Dunkley in Australian federal elections from the division's creation in 1984 until the present.
This is a list of electoral results for the Division of Gellibrand in Australian federal elections from the division's creation in 1949 until the present.
This is a list of electoral results for the Division of Gorton in Australian federal elections from the division's creation in 2004 until the present.
This is a list of electoral results for the Division of Higgins in Australian federal elections from the division's creation in 1949 until the present.
This is a list of electoral results for the Division of Hotham in Australian federal elections from the division's creation in 1969 until the present.
This is a list of electoral results for the Division of Indi in Australian federal elections from the division's creation in 1901 until the present.
This is a list of electoral results for the Division of Isaacs in Australian federal elections from the division's creation in 1969 until the present.
This is a list of electoral results for the Division of Jagajaga in Australian federal elections from the division's creation in 1984 until the present.
This is a list of electoral results for the Division of Kooyong in Australian federal elections from the division's creation in 1901 until the present.
This is a list of electoral results for the Division of Lalor in Australian federal elections from the division's creation in 1949 until the present.
This is a list of electoral results for the Division of Mallee in Australian federal elections from the division's creation in 1949 until the present.
This is a list of electoral results for the Division of Melbourne in Australian federal elections from the division's creation in 1901 until the present.
This is a list of electoral results for the Division of Wannon in Australian federal elections from the division's creation in 1901 until the present.
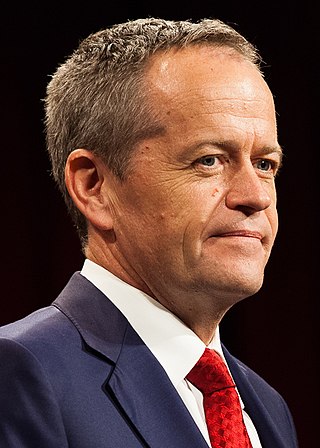
This is a list of electoral division results for the 2016 Australian federal election in the state of Victoria.
This is a list of electoral division results for the 2019 Australian federal election in the state of Victoria. Victoria bucked the national trend, seeing a swing from the Coalition to Labor, whereas the swing across Australia was from Labor to the Coalition.
This is a list of electoral division results for the 2022 Australian federal election in the state of Victoria.