![]() | |||||||||||||||||||||||||||||||||||||||||||||
| |||||||||||||||||||||||||||||||||||||||||||||
All 38 Victorian seats in the Australian House of Representatives and 6 seats in the Australian Senate | |||||||||||||||||||||||||||||||||||||||||||||
---|---|---|---|---|---|---|---|---|---|---|---|---|---|---|---|---|---|---|---|---|---|---|---|---|---|---|---|---|---|---|---|---|---|---|---|---|---|---|---|---|---|---|---|---|---|
| |||||||||||||||||||||||||||||||||||||||||||||
This is a list of electoral division results for the 2019 Australian federal election in the state of Victoria. Victoria bucked the national trend, seeing a swing from the Coalition to Labor, whereas the swing across Australia was from Labor to the Coalition. [1]
![]() 2019 Australian federal election |
---|
|
National results |
State and territory results |
This election was held using instant-runoff voting. At this election, there were two "turn-overs" in Victoria. Labor won the seats of Dunkley and Macnamara despite the Liberals finishing first; while an independent won the seat of Indi despite the Liberals finishing first.
Party | Votes | % | Swing | Seats | Change | ||
---|---|---|---|---|---|---|---|
Liberal/National Coalition | |||||||
Liberal Party of Australia | 1,288,805 | 34.88 | −2.13 | 12 | ![]() | ||
National Party of Australia | 136,737 | 3.70 | −1.05 | 3 | ![]() | ||
Coalition total | 1,425,542 | 38.58 | -3.18 | 15 | ![]() | ||
Australian Labor Party | 1,361,913 | 36.86 | +1.28 | 21 | ![]() | ||
Australian Greens | 439,169 | 11.89 | −1.24 | 1 | ![]() | ||
United Australia Party | 134,581 | 3.64 | +3.64 | ||||
Animal Justice Party | 41,333 | 1.12 | −0.77 | ||||
Pauline Hanson's One Nation | 35,177 | 0.95 | +0.95 | ||||
Derryn Hinch's Justice Party | 26,803 | 0.73 | +0.33 | ||||
Victorian Socialists | 12,453 | 0.34 | +0.34 | ||||
Shooters, Fishers and Farmers Party | 12,384 | 0.34 | +0.30 | ||||
Fraser Anning's Conservative National Party | 11,504 | 0.31 | +0.31 | ||||
Democratic Labour Party | 11,397 | 0.31 | +0.31 | ||||
Rise Up Australia Party | 10,772 | 0.29 | −0.86 | ||||
Reason Party | 8,895 | 0.24 | +0.24 | ||||
Sustainable Australia | 6,809 | 0.18 | +0.18 | ||||
Australia First Party | 4,094 | 0.11 | +0.02 | ||||
Citizens Electoral Council | 3,267 | 0.09 | +0.03 | ||||
The Great Australian Party | 2,457 | 0.07 | +0.07 | ||||
Socialist Equality Party | 823 | 0.02 | +0.01 | ||||
Science Party | 497 | 0.01 | +0.01 | ||||
Independent | 144,043 | 3.90 | +1.18 | 1 | ![]() | ||
Non Affiliated | 1,119 | 0.03 | +0.03 | ||||
Total | 3,695,032 | 38 | ![]() | ||||
Two-party-preferred vote | |||||||
Labor | 1,963,410 | 53.14 | +1.31 | ||||
Liberal/National Coalition | 1,731,622 | 46.86 | −1.31 | ||||
Invalid/blank votes | 180,426 | 4.66 | −0.11 | ||||
Registered voters/turnout | 4,184,076 | 92.62 | +1.48 | ||||
Source: AEC Tally Room |
Party | Candidate | Votes | % | ±% | |
---|---|---|---|---|---|
Liberal | Alan Tudge | 54,744 | 54.69 | +5.24 | |
Labor | Kadira Pethiyagoda | 29,839 | 29.81 | −1.17 | |
Greens | Asher Cookson | 8,867 | 8.86 | −0.14 | |
United Australia | Matthew Sirianni-Duffy | 3,611 | 3.61 | +3.61 | |
Democratic Labour | Anna Kennedy | 3,029 | 3.03 | +3.03 | |
Total formal votes | 100,090 | 96.32 | +0.52 | ||
Informal votes | 3,829 | 3.68 | −0.52 | ||
Turnout | 103,919 | 94.18 | −0.69 | ||
Two-party-preferred result | |||||
Liberal | Alan Tudge | 60,180 | 60.13 | +2.72 | |
Labor | Kadira Pethiyagoda | 39,910 | 39.87 | −2.72 | |
Liberal hold | Swing | +2.72 | |||
Party | Candidate | Votes | % | ±% | |
---|---|---|---|---|---|
Labor | Catherine King | 49,077 | 47.79 | +4.50 | |
Liberal | Tim Vo | 31,462 | 30.64 | −4.05 | |
Greens | Karen McAloon | 9,077 | 8.84 | −2.01 | |
United Australia | Peter Cozyn | 4,741 | 4.62 | +4.62 | |
Animal Justice | Bryn Hills | 4,393 | 4.28 | +4.28 | |
Independent | Nick Shady | 2,288 | 2.23 | +2.23 | |
Independent | Alex Graham | 1,645 | 1.60 | +1.60 | |
Total formal votes | 102,683 | 95.63 | +0.92 | ||
Informal votes | 4,689 | 4.37 | −0.92 | ||
Turnout | 107,372 | 93.40 | +1.03 | ||
Two-party-preferred result | |||||
Labor | Catherine King | 62,615 | 60.98 | +3.62 | |
Liberal | Tim Vo | 40,068 | 39.02 | −3.62 | |
Labor hold | Swing | +3.62 | |||
Party | Candidate | Votes | % | ±% | |
---|---|---|---|---|---|
Labor | Lisa Chesters | 44,340 | 43.62 | +5.06 | |
Liberal | Sam Gayed | 32,210 | 31.68 | −6.06 | |
Greens | Robert Holian | 11,381 | 11.20 | +0.29 | |
One Nation | Vaughan Williams | 6,278 | 6.18 | +6.18 | |
United Australia | Adam Veitch | 4,321 | 4.25 | +4.25 | |
Conservative National | Julie Hoskin | 1,667 | 1.64 | +1.64 | |
Rise Up Australia | Sharon Budde | 1,464 | 1.44 | −0.70 | |
Total formal votes | 101,661 | 95.93 | +0.55 | ||
Informal votes | 4,318 | 4.07 | −0.55 | ||
Turnout | 105,979 | 93.99 | +0.51 | ||
Two-party-preferred result | |||||
Labor | Lisa Chesters | 60,016 | 59.04 | +5.17 | |
Liberal | Sam Gayed | 41,645 | 40.96 | −5.17 | |
Labor hold | Swing | +5.17 | |||
Party | Candidate | Votes | % | ±% | |
---|---|---|---|---|---|
Labor | Julian Hill | 51,713 | 55.58 | +1.41 | |
Liberal | John MacIsaac | 27,170 | 29.20 | −1.12 | |
Greens | Rhonda Garad | 6,801 | 7.31 | +0.77 | |
United Australia | Mubahil Ahmed | 3,979 | 4.28 | +4.28 | |
Conservative National | Tim Boyanton | 3,377 | 3.63 | +3.63 | |
Total formal votes | 93,040 | 94.40 | −0.26 | ||
Informal votes | 5,521 | 5.60 | +0.26 | ||
Turnout | 98,561 | 90.26 | −0.85 | ||
Two-party-preferred result | |||||
Labor | Julian Hill | 59,689 | 64.15 | +0.10 | |
Liberal | John MacIsaac | 33,351 | 35.85 | −0.10 | |
Labor hold | Swing | +0.10 | |||
Party | Candidate | Votes | % | ±% | |
---|---|---|---|---|---|
Labor | Maria Vamvakinou | 47,115 | 53.88 | −4.80 | |
Liberal | Genevieve Hamilton | 21,978 | 25.13 | −0.52 | |
Greens | Polly Morgan | 5,893 | 6.74 | −1.27 | |
Victorian Socialists | Jerome Small | 3,984 | 4.56 | +4.56 | |
United Australia | Prakul Chhabra | 3,037 | 3.47 | +3.47 | |
Citizens Electoral Council | Keith Kerr | 2,851 | 3.26 | +3.26 | |
Conservative National | Adam Vail | 1,771 | 2.03 | +2.03 | |
Socialist Equality | Peter Byrne | 823 | 0.94 | +0.94 | |
Total formal votes | 87,452 | 90.78 | −2.34 | ||
Informal votes | 8,884 | 9.22 | +2.34 | ||
Turnout | 96,336 | 89.61 | +4.25 | ||
Two-party-preferred result | |||||
Labor | Maria Vamvakinou | 60,164 | 68.80 | −0.93 | |
Liberal | Genevieve Hamilton | 27,288 | 31.20 | +0.93 | |
Labor hold | Swing | −0.93 | |||
Party | Candidate | Votes | % | ±% | |
---|---|---|---|---|---|
Liberal | Tony Smith | 45,168 | 45.25 | −2.29 | |
Labor | Bill Brindle | 28,551 | 28.60 | +0.41 | |
Greens | Jenny Game-Lopata | 10,919 | 10.94 | −1.90 | |
Justice | Ryan Clark | 3,309 | 3.31 | +2.59 | |
Animal Justice | Travis Barker | 3,105 | 3.11 | −1.19 | |
United Australia | Wendy Starkey | 2,607 | 2.61 | +2.61 | |
Independent | Peter Charleton | 2,302 | 2.31 | −0.32 | |
Democratic Labour | Ross McPhee | 2,246 | 2.25 | +2.25 | |
Rise Up Australia | Antony Calabro | 820 | 0.82 | −1.63 | |
Great Australian | Jayden O'Connor | 801 | 0.80 | +0.80 | |
Total formal votes | 99,828 | 93.54 | −2.43 | ||
Informal votes | 6,892 | 6.46 | +2.43 | ||
Turnout | 106,720 | 94.19 | +0.54 | ||
Two-party-preferred result | |||||
Liberal | Tony Smith | 54,551 | 54.64 | +0.10 | |
Labor | Bill Brindle | 45,277 | 45.36 | −0.10 | |
Liberal hold | Swing | +0.10 | |||
Party | Candidate | Votes | % | ±% | |
---|---|---|---|---|---|
Liberal | Gladys Liu | 41,172 | 43.38 | −3.71 | |
Labor | Jennifer Yang | 32,561 | 34.30 | −0.39 | |
Greens | Luke Arthur | 11,235 | 11.84 | +0.30 | |
Independent | Ian Dobby | 2,319 | 2.44 | +2.44 | |
Justice | Anne Wicks | 2,063 | 2.17 | +2.17 | |
Animal Justice | Rosemary Lavin | 1,780 | 1.88 | −0.24 | |
Democratic Labour | Philip Jenkins | 1,702 | 1.79 | +1.79 | |
United Australia | George Zoraya | 1,517 | 1.60 | +1.60 | |
Rise Up Australia | Angela Dorian | 571 | 0.60 | −0.63 | |
Total formal votes | 94,920 | 95.51 | −1.77 | ||
Informal votes | 4,463 | 4.49 | +1.77 | ||
Turnout | 99,383 | 93.47 | −0.96 | ||
Two-party-preferred result | |||||
Liberal | Gladys Liu | 48,005 | 50.57 | −2.34 | |
Labor | Jennifer Yang | 46,915 | 49.43 | +2.34 | |
Liberal hold | Swing | −2.34 | |||
Julia Banks was elected as the Liberal member for Chisholm in 2016, but resigned from the party in November 2018 and sat as an independent. She unsuccessfully contested Flinders as an independent.
Party | Candidate | Votes | % | ±% | |
---|---|---|---|---|---|
Labor | Ged Kearney | 45,601 | 46.78 | +11.73 | |
Greens | David Risstrom | 20,605 | 21.14 | −15.53 | |
Liberal | Andrew Bell | 19,012 | 19.50 | −0.20 | |
Victorian Socialists | Kath Larkin | 4,125 | 4.23 | +4.23 | |
Animal Justice | Nadine Richings | 2,476 | 2.54 | +0.87 | |
Reason | Sarah Russell | 2,110 | 2.16 | +2.16 | |
United Australia | Brett Nangle | 1,892 | 1.94 | +1.94 | |
Independent | Teresa van Lieshout | 1,660 | 1.70 | +1.70 | |
Total formal votes | 97,481 | 95.13 | +2.77 | ||
Informal votes | 4,986 | 4.87 | −2.77 | ||
Turnout | 102,467 | 92.45 | +2.94 | ||
Notional two-party-preferred count | |||||
Labor | Ged Kearney | 74,402 | 76.32 | +4.23 | |
Liberal | Andrew Bell | 23,079 | 23.68 | −4.23 | |
Two-candidate-preferred result | |||||
Labor | Ged Kearney | 63,017 | 64.65 | +13.38 | |
Greens | David Risstrom | 34,464 | 35.35 | −13.38 | |
Labor hold | Swing | +13.38 | |||
Party | Candidate | Votes | % | ±% | |
---|---|---|---|---|---|
Liberal | Sarah Henderson | 43,017 | 42.33 | −1.34 | |
Labor | Libby Coker | 36,047 | 35.47 | +1.41 | |
Greens | Simon Northeast | 9,184 | 9.04 | −3.05 | |
Independent | Damien Cole | 5,131 | 5.05 | +5.05 | |
Justice | Mandy Grimley | 2,724 | 2.68 | +0.41 | |
United Australia | Neil Harvey | 2,257 | 2.22 | +2.22 | |
Animal Justice | Naomi Adams | 2,143 | 2.11 | −0.13 | |
Rise Up Australia | Ian Erskine | 1,117 | 1.10 | −0.07 | |
Total formal votes | 101,620 | 96.03 | +0.73 | ||
Informal votes | 4,196 | 3.97 | −0.73 | ||
Turnout | 105,816 | 94.82 | +3.83 | ||
Two-party-preferred result | |||||
Labor | Libby Coker | 51,895 | 51.07 | +1.04 | |
Liberal | Sarah Henderson | 49,725 | 48.93 | −1.04 | |
Labor notional hold | Swing | +1.04 | |||
As a result of the 2018 boundary redistribution, the Liberal-held seats of Corangamite and Dunkley became notionally marginal Labor seats.
Party | Candidate | Votes | % | ±% | |
---|---|---|---|---|---|
Labor | Richard Marles | 47,010 | 47.60 | +4.18 | |
Liberal | Alastair Thomson | 33,426 | 33.85 | −2.78 | |
Greens | Amber Forbes | 12,902 | 13.07 | +1.38 | |
United Australia | Desmond Sanborn | 5,414 | 5.48 | +5.48 | |
Total formal votes | 98,752 | 96.44 | +1.10 | ||
Informal votes | 3,648 | 3.56 | −1.10 | ||
Turnout | 102,400 | 92.83 | +0.70 | ||
Two-party-preferred result | |||||
Labor | Richard Marles | 59,572 | 60.32 | +2.12 | |
Liberal | Alastair Thomson | 39,180 | 39.68 | −2.12 | |
Labor hold | Swing | +2.12 | |||
Party | Candidate | Votes | % | ±% | |
---|---|---|---|---|---|
Liberal | Michael Sukkar | 46,536 | 47.84 | −2.47 | |
Labor | Shireen Morris | 31,648 | 32.54 | +2.46 | |
Greens | Sophia Sun | 8,730 | 8.98 | −2.37 | |
Justice | Ellie Sullivan | 3,386 | 3.48 | +3.48 | |
United Australia | Milton Wilde | 1,997 | 2.05 | +2.05 | |
Animal Justice | Vinita Costantino | 1,964 | 2.02 | −0.96 | |
Independent | Vickie Janson | 1,614 | 1.66 | +1.66 | |
Democratic Labour | Joel van der Horst | 1,394 | 1.43 | +1.43 | |
Total formal votes | 97,269 | 95.90 | −1.09 | ||
Informal votes | 4,155 | 4.10 | +1.09 | ||
Turnout | 101,424 | 94.35 | −0.64 | ||
Two-party-preferred result | |||||
Liberal | Michael Sukkar | 53,288 | 54.78 | −1.66 | |
Labor | Shireen Morris | 43,981 | 45.22 | +1.66 | |
Liberal hold | Swing | −1.66 | |||
Party | Candidate | Votes | % | ±% | |
---|---|---|---|---|---|
Liberal | Chris Crewther | 38,616 | 39.88 | −1.22 | |
Labor | Peta Murphy | 37,301 | 38.52 | +2.00 | |
Greens | Emily Green | 8,125 | 8.39 | −1.09 | |
Justice | Lachlan O'Connell | 5,027 | 5.19 | +0.19 | |
Animal Justice | Elizabeth Johnston | 2,961 | 3.06 | +0.18 | |
United Australia | Ron Jean | 2,513 | 2.60 | +2.60 | |
Conservative National | Christopher James | 1,337 | 1.38 | +1.38 | |
Rise Up Australia | Yvonne Gentle | 948 | 0.98 | +0.34 | |
Total formal votes | 96,828 | 94.86 | +0.90 | ||
Informal votes | 5,250 | 5.14 | −0.90 | ||
Turnout | 102,078 | 92.26 | +1.10 | ||
Two-party-preferred result | |||||
Labor | Peta Murphy | 51,066 | 52.74 | +1.71 | |
Liberal | Chris Crewther | 45,762 | 47.26 | −1.71 | |
Labor notional hold | Swing | +1.71 | |||
As a result of the 2018 boundary redistribution, the Liberal-held seats of Corangamite and Dunkley became notionally marginal Labor seats.
Party | Candidate | Votes | % | ±% | |
---|---|---|---|---|---|
Liberal | Greg Hunt | 45,293 | 46.72 | −3.78 | |
Labor | Josh Sinclair | 23,982 | 24.74 | −2.80 | |
Independent | Julia Banks | 13,367 | 13.79 | +13.79 | |
Greens | Nathan Lesslie | 6,599 | 6.81 | −4.18 | |
United Australia | Christine McShane | 2,447 | 2.52 | +2.52 | |
Animal Justice | James Persson | 2,304 | 2.38 | −1.45 | |
Sustainable Australia | Reade Smith | 1,072 | 1.11 | +1.11 | |
Independent | Susie Beveridge | 948 | 0.98 | +0.98 | |
Independent | Harry Dreger | 940 | 0.97 | +0.97 | |
Total formal votes | 96,952 | 94.06 | −1.90 | ||
Informal votes | 6,124 | 5.94 | +1.90 | ||
Turnout | 103,076 | 93.11 | +2.28 | ||
Two-party-preferred result | |||||
Liberal | Greg Hunt | 53,943 | 55.64 | −1.37 | |
Labor | Josh Sinclair | 43,009 | 44.36 | +1.37 | |
Liberal hold | Swing | −1.37 | |||
Party | Candidate | Votes | % | ±% | |
---|---|---|---|---|---|
Labor | Daniel Mulino | 46,709 | 50.46 | −8.05 | |
Liberal | Peter Bain | 23,929 | 25.85 | +0.47 | |
Greens | Rebecca Scorgie | 7,645 | 8.26 | −1.50 | |
United Australia | Vinh Van Chau | 7,314 | 7.90 | +7.90 | |
Independent | Van Tran | 5,306 | 5.73 | +4.25 | |
Great Australian | Tony Dobran | 1,656 | 1.79 | +1.79 | |
Total formal votes | 92,559 | 93.87 | −0.48 | ||
Informal votes | 6,046 | 6.13 | +0.48 | ||
Turnout | 98,605 | 90.13 | +1.25 | ||
Two-party-preferred result | |||||
Labor | Daniel Mulino | 59,403 | 64.18 | −5.61 | |
Liberal | Peter Bain | 33,156 | 35.82 | +5.61 | |
Labor notional hold | Swing | −5.61 | |||
Fraser was a new seat as a result of the 2018 boundary redistribution and was notionally held by Labor with a margin of 19.79%.
Party | Candidate | Votes | % | ±% | |
---|---|---|---|---|---|
Labor | Tim Watts | 47,942 | 48.66 | +2.43 | |
Liberal | Anthony Mitchell | 28,895 | 29.33 | −0.46 | |
Greens | Bernadette Thomas | 16,303 | 16.55 | −2.40 | |
United Australia | Lisa Bentley | 5,391 | 5.47 | +5.47 | |
Total formal votes | 98,531 | 96.49 | +0.40 | ||
Informal votes | 3,582 | 3.51 | −0.40 | ||
Turnout | 102,113 | 91.83 | +2.77 | ||
Two-party-preferred result | |||||
Labor | Tim Watts | 63,878 | 64.83 | −0.29 | |
Liberal | Anthony Mitchell | 34,653 | 35.17 | +0.29 | |
Labor hold | Swing | −0.29 | |||
Party | Candidate | Votes | % | ±% | |
---|---|---|---|---|---|
National | Darren Chester | 52,202 | 54.00 | −1.84 | |
Labor | Antoinette Holm | 22,426 | 23.20 | +2.99 | |
Shooters, Fishers, Farmers | David Snelling | 6,872 | 7.11 | +7.11 | |
Greens | Deb Foskey | 5,835 | 6.04 | −1.79 | |
United Australia | Kerri Brewer | 4,257 | 4.40 | +4.40 | |
Independent | Sonia Buckley | 3,043 | 3.15 | +3.15 | |
Conservative National | Neville Tickner | 2,043 | 2.11 | +2.11 | |
Total formal votes | 96,678 | 94.78 | +1.64 | ||
Informal votes | 5,320 | 5.22 | −1.64 | ||
Turnout | 101,998 | 92.27 | −0.58 | ||
Two-party-preferred result | |||||
National | Darren Chester | 64,456 | 66.67 | −1.54 | |
Labor | Antoinette Holm | 32,222 | 33.33 | +1.54 | |
National hold | Swing | −1.54 | |||
Party | Candidate | Votes | % | ±% | |
---|---|---|---|---|---|
Liberal | Tim Wilson | 52,320 | 52.67 | −3.66 | |
Labor | Daniel Pollock | 28,118 | 28.31 | +6.43 | |
Greens | Sue Pennicuik | 13,951 | 14.04 | −1.86 | |
United Australia | Wayne Connolly | 1,945 | 1.96 | +1.96 | |
Sustainable Australia | Brandon Hoult | 1,653 | 1.66 | +1.66 | |
Independent | John Tiger Casley | 1,349 | 1.36 | +1.36 | |
Total formal votes | 99,336 | 97.79 | +0.25 | ||
Informal votes | 2,244 | 2.21 | −0.25 | ||
Turnout | 101,580 | 93.61 | +2.19 | ||
Two-party-preferred result | |||||
Liberal | Tim Wilson | 57,408 | 57.79 | −4.89 | |
Labor | Daniel Pollock | 41,928 | 42.21 | +4.89 | |
Liberal hold | Swing | −4.89 | |||
Party | Candidate | Votes | % | ±% | |
---|---|---|---|---|---|
Labor | Brendan O'Connor | 47,398 | 50.08 | −11.16 | |
Liberal | Nathan Di Noia | 24,677 | 26.07 | −2.69 | |
Independent | Jarrod Bingham | 8,363 | 8.84 | +8.84 | |
United Australia | Richard Turton | 7,473 | 7.90 | +7.90 | |
Greens | Harkirat Singh | 6,730 | 7.11 | −2.89 | |
Total formal votes | 94,641 | 94.08 | −0.87 | ||
Informal votes | 5,957 | 5.92 | +0.87 | ||
Turnout | 100,598 | 91.11 | +4.10 | ||
Two-party-preferred result | |||||
Labor | Brendan O'Connor | 61,861 | 65.36 | −3.13 | |
Liberal | Nathan Di Noia | 32,780 | 34.64 | +3.13 | |
Labor hold | Swing | −3.13 | |||
Party | Candidate | Votes | % | ±% | |
---|---|---|---|---|---|
Liberal | Katie Allen | 48,091 | 47.86 | −3.72 | |
Labor | Fiona McLeod | 25,498 | 25.38 | +8.85 | |
Greens | Jason Ball | 22,573 | 22.47 | −1.72 | |
Animal Justice | Alicia Walker | 1,729 | 1.72 | +0.15 | |
Sustainable Australia | Michaela Moran | 1,338 | 1.33 | +1.33 | |
United Australia | Tim Ryan | 1,249 | 1.24 | +1.24 | |
Total formal votes | 100,478 | 97.99 | +1.74 | ||
Informal votes | 2,063 | 2.01 | −1.74 | ||
Turnout | 102,541 | 92.37 | +1.49 | ||
Two-party-preferred result | |||||
Liberal | Katie Allen | 54,139 | 53.88 | −6.09 | |
Labor | Fiona McLeod | 46,339 | 46.12 | +6.09 | |
Liberal hold | Swing | −6.09 | |||
Party | Candidate | Votes | % | ±% | |
---|---|---|---|---|---|
Labor | Anthony Byrne | 48,031 | 50.73 | +1.92 | |
Liberal | Jennifer Van Den Broek | 33,963 | 35.87 | +2.11 | |
Greens | Jess Wheelock | 6,735 | 7.11 | +0.59 | |
United Australia | Jatinder Singh | 5,958 | 6.29 | +6.29 | |
Total formal votes | 94,687 | 95.88 | +0.78 | ||
Informal votes | 4,069 | 4.12 | −0.78 | ||
Turnout | 98,756 | 92.46 | +4.39 | ||
Two-party-preferred result | |||||
Labor | Anthony Byrne | 55,577 | 58.70 | −1.24 | |
Liberal | Jennifer Van Den Broek | 39,110 | 41.30 | +1.24 | |
Labor hold | Swing | −1.24 | |||
Party | Candidate | Votes | % | ±% | |
---|---|---|---|---|---|
Labor | Clare O'Neil | 43,310 | 45.18 | +2.10 | |
Liberal | George Hua | 37,447 | 39.06 | −1.28 | |
Greens | Jess Gonsalvez | 8,722 | 9.10 | +0.04 | |
United Australia | Jin Luan | 3,483 | 3.63 | +3.63 | |
Sustainable Australia | Dennis Bilic | 1,772 | 1.85 | +1.85 | |
Rise Up Australia | Peter Dorian | 1,134 | 1.18 | −0.41 | |
Total formal votes | 95,868 | 96.21 | +0.12 | ||
Informal votes | 3,780 | 3.79 | −0.12 | ||
Turnout | 99,648 | 92.41 | −0.89 | ||
Two-party-preferred result | |||||
Labor | Clare O'Neil | 53,597 | 55.91 | +1.70 | |
Liberal | George Hua | 42,271 | 44.09 | −1.70 | |
Labor hold | Swing | +1.70 | |||
Party | Candidate | Votes | % | ±% | |
---|---|---|---|---|---|
Liberal | Steve Martin | 35,426 | 35.09 | +7.29 | |
Independent | Helen Haines | 32,664 | 32.35 | −1.06 | |
Labor | Eric Kerr | 12,202 | 12.09 | +2.03 | |
National | Mark Byatt | 9,538 | 9.45 | −8.30 | |
Greens | Helen Robinson | 4,255 | 4.21 | +0.25 | |
United Australia | Shane Wheatland | 3,980 | 3.94 | +3.94 | |
Justice | Jason Whalley | 2,891 | 2.86 | +2.86 | |
Total formal votes | 100,956 | 95.64 | +2.21 | ||
Informal votes | 4,601 | 4.36 | −2.21 | ||
Turnout | 105,557 | 93.60 | +0.13 | ||
Notional two-party-preferred count | |||||
Liberal | Steve Martin | 63,332 | 62.73 | +7.72 | |
Labor | Eric Kerr | 37,624 | 37.27 | −7.72 | |
Two-candidate-preferred result | |||||
Independent | Helen Haines | 51,886 | 51.39 | −4.13 | |
Liberal | Steve Martin | 49,070 | 48.61 | +4.13 | |
Independent gain from Independent | Swing | −4.13 | |||
Sitting member Cathy McGowan (independent) did not contest the election and endorsed the candidacy of Helen Haines (independent).
Party | Candidate | Votes | % | ±% | |
---|---|---|---|---|---|
Labor | Mark Dreyfus | 43,364 | 44.78 | +3.84 | |
Liberal | Jeremy Hearn | 34,089 | 35.20 | −7.45 | |
Greens | Kim Samiotis | 10,822 | 11.18 | +0.46 | |
United Australia | Tony Seals | 3,813 | 3.94 | +3.94 | |
Animal Justice | Bronwyn Currie | 3,607 | 3.72 | −0.62 | |
Rise Up Australia | Ash Puvimanasinghe | 1,142 | 1.18 | +0.53 | |
Total formal votes | 96,837 | 95.86 | −0.73 | ||
Informal votes | 4,180 | 4.14 | +0.73 | ||
Turnout | 101,017 | 93.28 | +1.03 | ||
Two-party-preferred result | |||||
Labor | Mark Dreyfus | 54,645 | 56.43 | +3.45 | |
Liberal | Jeremy Hearn | 42,192 | 43.57 | −3.45 | |
Labor hold | Swing | +3.45 | |||
Party | Candidate | Votes | % | ±% | |
---|---|---|---|---|---|
Labor | Kate Thwaites | 41,086 | 42.02 | +0.90 | |
Liberal | Richard Welch | 37,755 | 38.62 | −1.47 | |
Greens | Paul Kennedy | 13,929 | 14.25 | +0.82 | |
United Australia | Maria Rigoni | 3,652 | 3.74 | +3.74 | |
Rise Up Australia | Jeff Truscott | 1,345 | 1.38 | +1.38 | |
Total formal votes | 97,767 | 96.86 | −0.07 | ||
Informal votes | 3,169 | 3.14 | +0.07 | ||
Turnout | 100,936 | 93.85 | +0.43 | ||
Two-party-preferred result | |||||
Labor | Kate Thwaites | 55,304 | 56.57 | +0.97 | |
Liberal | Richard Welch | 42,463 | 43.43 | −0.97 | |
Labor hold | Swing | +0.97 | |||
Party | Candidate | Votes | % | ±% | |
---|---|---|---|---|---|
Liberal | Josh Frydenberg | 48,928 | 49.41 | −8.24 | |
Greens | Julian Burnside | 21,035 | 21.24 | +2.65 | |
Labor | Jana Stewart | 16,666 | 16.83 | −3.70 | |
Independent | Oliver Yates | 8,890 | 8.98 | +8.98 | |
United Australia | Steven D'Elia | 1,185 | 1.20 | +1.20 | |
Animal Justice | Davina Hinkley | 1,117 | 1.13 | +1.00 | |
Independent | Bill Chandler | 669 | 0.68 | +0.68 | |
Independent | Angelina Zubac | 539 | 0.54 | −2.32 | |
Total formal votes | 99,029 | 97.03 | −0.97 | ||
Informal votes | 3,033 | 2.97 | +0.97 | ||
Turnout | 102,062 | 94.14 | +0.48 | ||
Notional two-party-preferred count | |||||
Liberal | Josh Frydenberg | 56,127 | 56.68 | −6.14 | |
Labor | Jana Stewart | 42,902 | 43.32 | +6.14 | |
Two-candidate-preferred result | |||||
Liberal | Josh Frydenberg | 55,159 | 55.70 | −7.64 | |
Greens | Julian Burnside | 43,870 | 44.30 | +44.30 | |
Liberal hold | Swing | N/A | |||
Party | Candidate | Votes | % | ±% | |
---|---|---|---|---|---|
Liberal | Jason Wood | 45,123 | 45.72 | +1.59 | |
Labor | Simon Curtis | 34,040 | 34.49 | +2.35 | |
Greens | Amy Gregorovich | 7,752 | 7.86 | −0.43 | |
One Nation | Esther Baker | 4,796 | 4.86 | +4.86 | |
Justice | Asher Calwell-Browne | 3,525 | 3.57 | +0.70 | |
United Australia | Duncan Dean | 2,506 | 2.54 | +2.54 | |
Rise Up Australia | Norman Baker | 947 | 0.96 | −1.01 | |
Total formal votes | 98,689 | 95.53 | +1.21 | ||
Informal votes | 4,616 | 4.47 | −1.21 | ||
Turnout | 103,305 | 93.30 | +5.19 | ||
Two-party-preferred result | |||||
Liberal | Jason Wood | 53,776 | 54.49 | +1.27 | |
Labor | Simon Curtis | 44,913 | 45.51 | −1.27 | |
Liberal hold | Swing | +1.27 | |||
Party | Candidate | Votes | % | ±% | |
---|---|---|---|---|---|
Labor | Joanne Ryan | 48,332 | 51.70 | −0.86 | |
Liberal | Gayle Murphy | 28,209 | 30.18 | −0.05 | |
Greens | Jay Dessi | 7,273 | 7.78 | −1.83 | |
United Australia | Jeffrey Robinson | 4,451 | 4.76 | +4.76 | |
Australia First | Susan Jakobi | 4,094 | 4.38 | +1.28 | |
Aijaz Moinuddin | 1,119 | 1.20 | +1.20 | ||
Total formal votes | 93,478 | 95.57 | +0.12 | ||
Informal votes | 4,337 | 4.43 | −0.12 | ||
Turnout | 97,815 | 91.60 | +4.05 | ||
Two-party-preferred result | |||||
Labor | Joanne Ryan | 58,341 | 62.41 | −1.78 | |
Liberal | Gayle Murphy | 35,137 | 37.59 | +1.78 | |
Labor hold | Swing | −1.78 | |||
Party | Candidate | Votes | % | ±% | |
---|---|---|---|---|---|
Liberal | Kate Ashmor | 36,283 | 37.37 | −4.60 | |
Labor | Josh Burns | 30,855 | 31.78 | +5.24 | |
Greens | Steph Hodgins-May | 23,534 | 24.24 | +0.08 | |
Animal Justice | Craig McPherson | 1,919 | 1.98 | 0.00 | |
United Australia | Helen Paton | 1,136 | 1.17 | +1.17 | |
Independent | Ruby O'Rourke | 1,108 | 1.14 | +1.14 | |
Sustainable Australia | Steven Armstrong | 974 | 1.00 | +1.00 | |
Independent | Chris Wallis | 918 | 0.95 | +0.95 | |
Rise Up Australia | Christine Kay | 365 | 0.38 | +0.38 | |
Total formal votes | 97,092 | 95.77 | 0.00 | ||
Informal votes | 4,288 | 4.23 | 0.00 | ||
Turnout | 101,380 | 89.08 | +2.80 | ||
Two-party-preferred result | |||||
Labor | Josh Burns | 54,613 | 56.25 | +5.04 | |
Liberal | Kate Ashmor | 42,479 | 43.75 | −5.04 | |
Labor notional hold | Swing | +5.04 | |||
Macnamara was a new electorate, notionally held by Labor.
Party | Candidate | Votes | % | ±% | |
---|---|---|---|---|---|
National | Anne Webster | 26,142 | 27.86 | −28.06 | |
Liberal | Serge Petrovich | 17,665 | 18.83 | +11.74 | |
Labor | Carole Hart | 14,722 | 15.69 | −6.85 | |
Independent | Jason Modica | 8,795 | 9.37 | +9.37 | |
Independent | Ray Kingston | 8,621 | 9.19 | +9.19 | |
Shooters, Fishers, Farmers | Dan Straub | 5,512 | 5.87 | +5.87 | |
Greens | Nicole Rowan | 3,297 | 3.51 | −3.50 | |
United Australia | Rick Millar | 3,171 | 3.38 | +3.38 | |
Independent | Cecilia Moar | 2,761 | 2.94 | +2.94 | |
Conservative National | Rick Grosvenor | 1,309 | 1.40 | +1.40 | |
Rise Up Australia | Philip Mollison | 919 | 0.98 | −3.50 | |
Science | Leigh Firman | 497 | 0.53 | +0.53 | |
Citizens Electoral Council | Chris Lahy | 416 | 0.44 | −1.23 | |
Total formal votes | 93,827 | 88.84 | −6.41 | ||
Informal votes | 11,792 | 11.16 | +6.41 | ||
Turnout | 105,619 | 92.84 | −1.48 | ||
Two-party-preferred result | |||||
National | Anne Webster | 62,143 | 66.23 | −3.57 | |
Labor | Carole Hart | 31,684 | 33.77 | +3.57 | |
National hold | Swing | −3.57 | |||
Party | Candidate | Votes | % | ±% | |
---|---|---|---|---|---|
Labor | Bill Shorten | 47,487 | 47.05 | +4.99 | |
Liberal | Christine Stow | 34,877 | 34.56 | +0.83 | |
Greens | James Williams | 14,943 | 14.81 | −2.42 | |
United Australia | MD Sarwar Hasan | 3,617 | 3.58 | +3.58 | |
Total formal votes | 100,924 | 97.10 | +1.07 | ||
Informal votes | 3,014 | 2.90 | −1.07 | ||
Turnout | 103,938 | 92.09 | +2.72 | ||
Two-party-preferred result | |||||
Labor | Bill Shorten | 61,767 | 61.20 | +0.80 | |
Liberal | Christine Stow | 39,157 | 38.80 | −0.80 | |
Labor hold | Swing | +0.80 | |||
Party | Candidate | Votes | % | ±% | |
---|---|---|---|---|---|
Labor | Rob Mitchell | 37,911 | 39.44 | −2.77 | |
Liberal | Phillip Fusco | 33,162 | 34.50 | −1.32 | |
Greens | Neil Barker | 8,026 | 8.35 | −0.24 | |
One Nation | Ronnie Graham | 5,693 | 5.92 | +5.92 | |
Justice | Deb Butler | 3,878 | 4.03 | +4.03 | |
United Australia | Chris Hayman | 3,016 | 3.14 | +3.14 | |
Animal Justice | Ruth Parramore | 2,890 | 3.01 | +0.17 | |
Independent | Robert Hyndman | 1,552 | 1.61 | +1.61 | |
Total formal votes | 96,128 | 94.74 | +0.31 | ||
Informal votes | 5,334 | 5.26 | −0.31 | ||
Turnout | 101,462 | 93.91 | +4.20 | ||
Two-party-preferred result | |||||
Labor | Rob Mitchell | 52,892 | 55.02 | −0.98 | |
Liberal | Phillip Fusco | 43,236 | 44.98 | +0.98 | |
Labor hold | Swing | −0.98 | |||
Party | Candidate | Votes | % | ±% | |
---|---|---|---|---|---|
Greens | Adam Bandt | 45,876 | 49.30 | +4.70 | |
Liberal | Lauren Sherson | 19,979 | 21.47 | −3.32 | |
Labor | Luke Creasey | 18,371 | 19.74 | −4.22 | |
Reason | Judy Ryan | 4,756 | 5.11 | +5.11 | |
Animal Justice | Lawrence Pope | 1,849 | 1.99 | +0.18 | |
Independent | Dave Blake | 1,154 | 1.24 | +1.24 | |
United Australia | Tony Pecora | 1,079 | 1.16 | +1.16 | |
Total formal votes | 93,064 | 96.98 | −0.52 | ||
Informal votes | 2,896 | 3.02 | +0.52 | ||
Turnout | 95,960 | 89.21 | +4.94 | ||
Notional two-party-preferred count | |||||
Labor | Luke Creasey | 62,410 | 67.06 | +0.06 | |
Liberal | Lauren Sherson | 30,654 | 32.94 | −0.06 | |
Two-candidate-preferred result | |||||
Greens | Adam Bandt | 66,852 | 71.83 | +2.79 | |
Liberal | Lauren Sherson | 26,212 | 28.17 | −2.79 | |
Greens hold | Swing | +2.79 | |||
Party | Candidate | Votes | % | ±% | |
---|---|---|---|---|---|
Liberal | Kevin Andrews | 50,863 | 51.73 | +1.89 | |
Labor | Stella Yee | 29,539 | 30.04 | +3.12 | |
Greens | Robert Humphreys | 10,264 | 10.44 | +0.05 | |
Democratic Labour | Teresa Kelleher | 3,026 | 3.08 | +3.08 | |
United Australia | Brett Fuller | 2,605 | 2.65 | +2.65 | |
Reason | Rachel Payne | 2,029 | 2.06 | +2.06 | |
Total formal votes | 98,326 | 96.68 | +1.23 | ||
Informal votes | 3,376 | 3.32 | −1.23 | ||
Turnout | 101,702 | 94.34 | −0.91 | ||
Two-party-preferred result | |||||
Liberal | Kevin Andrews | 56,568 | 57.53 | −0.28 | |
Labor | Stella Yee | 41,758 | 42.47 | +0.28 | |
Liberal hold | Swing | −0.28 | |||
Party | Candidate | Votes | % | ±% | |
---|---|---|---|---|---|
Liberal | Russell Broadbent | 46,501 | 46.28 | −3.58 | |
Labor | Jessica O'Donnell | 29,656 | 29.51 | +1.75 | |
One Nation | Jeff Waddell | 7,656 | 7.62 | +7.62 | |
Greens | William Hornstra | 7,047 | 7.01 | −3.09 | |
United Australia | Matthew Sherry | 4,028 | 4.01 | +4.01 | |
Independent | Michael Fozard | 2,870 | 2.86 | +2.86 | |
Independent | John Verhoeven | 2,723 | 2.71 | +2.71 | |
Total formal votes | 100,481 | 95.59 | +0.88 | ||
Informal votes | 4,636 | 4.41 | −0.88 | ||
Turnout | 105,117 | 93.45 | +2.08 | ||
Two-party-preferred result | |||||
Liberal | Russell Broadbent | 57,631 | 57.36 | −0.15 | |
Labor | Jessica O'Donnell | 42,850 | 42.64 | +0.15 | |
Liberal notional hold | Swing | −0.15 | |||
Monash was a new seat notionally held by the Liberal Party.
Party | Candidate | Votes | % | ±% | |
---|---|---|---|---|---|
National | Damian Drum | 48,855 | 51.27 | +18.58 | |
Labor | Bill Lodwick | 18,493 | 19.41 | +2.32 | |
One Nation | Rikkie-Lee Tyrrell | 10,754 | 11.29 | +11.29 | |
United Australia | Stewart Hine | 5,077 | 5.33 | +5.33 | |
Independent | Andrew Bock | 4,581 | 4.81 | +3.39 | |
Greens | Nickee Freeman | 4,011 | 4.21 | −0.23 | |
Independent | Jeremy Parker | 1,772 | 1.86 | +1.86 | |
Independent | Nigel Hicks | 1,749 | 1.84 | +1.00 | |
Total formal votes | 95,292 | 92.54 | +1.16 | ||
Informal votes | 7,679 | 7.46 | −1.16 | ||
Turnout | 102,971 | 92.65 | −0.80 | ||
Two-party-preferred result | |||||
National | Damian Drum | 66,732 | 70.03 | −2.49 | |
Labor | Bill Lodwick | 28,560 | 29.97 | +2.49 | |
National notional hold | Swing | −2.49 | |||
Nicholls was a new seat, notionally held by the Nationals.
Party | Candidate | Votes | % | ±% | |
---|---|---|---|---|---|
Labor | Andrew Giles | 55,467 | 60.42 | +1.03 | |
Liberal | Gurpal Singh | 20,484 | 22.31 | −3.54 | |
Greens | Cynthia Smith | 6,128 | 6.67 | −0.55 | |
United Australia | Firas Hasan | 4,625 | 5.04 | +5.04 | |
Animal Justice | Rod Whitfield | 3,500 | 3.81 | +0.51 | |
Independent | Yassin Akram Albarri | 1,605 | 1.75 | +1.75 | |
Total formal votes | 91,809 | 94.78 | +0.60 | ||
Informal votes | 5,055 | 5.22 | −0.60 | ||
Turnout | 96,864 | 92.12 | +2.21 | ||
Two-party-preferred result | |||||
Labor | Andrew Giles | 65,787 | 71.66 | +2.08 | |
Liberal | Gurpal Singh | 26,022 | 28.34 | −2.08 | |
Labor hold | Swing | +2.08 | |||
Party | Candidate | Votes | % | ±% | |
---|---|---|---|---|---|
Liberal | Dan Tehan | 53,094 | 51.11 | +0.69 | |
Labor | Maurice Billi | 27,150 | 26.13 | −3.87 | |
Independent | Alex Dyson | 10,797 | 10.39 | +10.39 | |
Greens | Zephlyn Taylor | 6,590 | 6.34 | −1.86 | |
United Australia | Joshua Wallace | 6,258 | 6.02 | +6.02 | |
Total formal votes | 103,889 | 96.15 | +0.55 | ||
Informal votes | 4,161 | 3.85 | −0.55 | ||
Turnout | 108,050 | 94.31 | −1.18 | ||
Two-party-preferred result | |||||
Liberal | Dan Tehan | 62,733 | 60.38 | +1.23 | |
Labor | Maurice Billi | 41,156 | 39.62 | −1.23 | |
Liberal hold | Swing | +1.23 | |||
Party | Candidate | Votes | % | ±% | |
---|---|---|---|---|---|
Labor | Peter Khalil | 42,355 | 44.08 | +6.17 | |
Greens | Adam Pulford | 25,575 | 26.62 | −4.29 | |
Liberal | Peter Killin | 17,241 | 17.94 | −3.60 | |
Victorian Socialists | Sue Bolton | 4,344 | 4.52 | +4.52 | |
Animal Justice | Chris Miles | 3,596 | 3.74 | +2.08 | |
United Australia | Manju Venkat | 2,979 | 3.10 | +3.10 | |
Total formal votes | 96,090 | 95.77 | +2.61 | ||
Informal votes | 4,243 | 4.23 | −2.61 | ||
Turnout | 100,333 | 90.67 | +3.25 | ||
Notional two-party-preferred count | |||||
Labor | Peter Khalil | 72,888 | 75.85 | +4.18 | |
Liberal | Peter Killin | 23,202 | 24.15 | −4.18 | |
Two-candidate-preferred result | |||||
Labor | Peter Khalil | 55,898 | 58.17 | +3.24 | |
Greens | Adam Pulford | 40,192 | 41.83 | −3.24 | |
Labor hold | Swing | +3.24 | |||
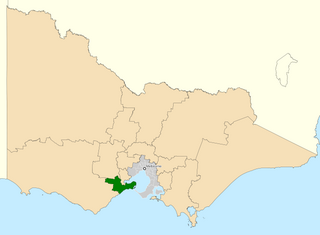
The Division of Corangamite is an Australian electoral division in the state of Victoria. The division was proclaimed in 1900, and was one of the original 65 divisions to be contested at the first federal election. It is named for Lake Corangamite, although the lake no longer falls within the division's boundaries.
The Division of Chisholm is an Australian Electoral Division in Victoria located in the eastern suburbs of Melbourne. The division was created in 1949 and is named after Caroline Chisholm, a social worker and promoter of women's immigration.
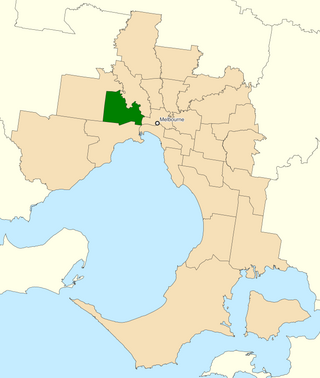
The Division of Dunkley is an Australian electoral division in the state of Victoria. The division is located south-east of Melbourne on the Mornington Peninsula. It covers an area of approximately 152 square kilometres (59 sq mi) from Seaford in the north to Mount Eliza in the south and Langwarrin South in the southeast. Following the 2024 Dunkley by-election, Jodie Belyea currently represents the seat.
The Division of Flinders is an Australian Electoral Division in Victoria. The division is one of the original 65 divisions contested at the first federal election. It is named after Matthew Flinders, the first man to circumnavigate Australia, and the person credited with giving Australia its name.
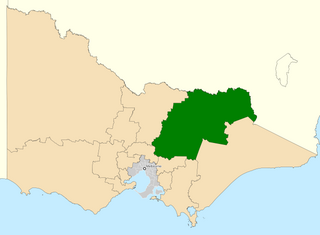
The Division of Indi ( "IN-dye") is an Australian electoral division in the state of Victoria. The division is located in the north-east of the state, adjoining the border with New South Wales. The largest settlements in the division are the regional cities of Wodonga, Wangaratta, and Benalla. Other towns in the electorate include Rutherglen, Mansfield, Beechworth, Myrtleford, Bright, Alexandra, Tallangatta, Corryong and a number of other small villages. While Indi is one of the largest electorates in Victoria, much of it is located within the largely uninhabited Australian Alps. While Wodonga serves as a regional hub for much of the more heavily populated northern part of the electorate, the southern part is closer to Melbourne than Wodonga.
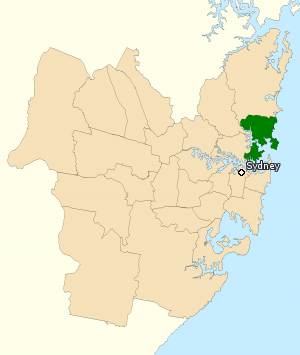
The Division of Warringah is an Australian electoral division in the state of New South Wales.
In Australia, a redistribution is the process of redrawing the boundaries of electoral divisions for the House of Representatives arising from changes in population and changes in the number of representatives. There is no redistribution for the Senate as each State constitutes a division, though with multiple members. The Australian Electoral Commission (AEC), an independent statutory authority, oversees the apportionment and redistribution process for federal divisions, taking into account a number of factors. Politicians, political parties and the public may make submissions to the AEC on proposed new boundaries, but any interference with their deliberations is considered a serious offence.
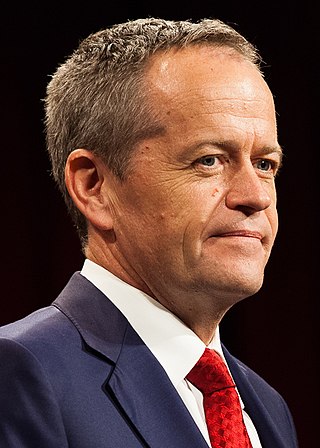
Robert Leslie Chynoweth is an Australian politician. He was an Australian Labor Party member of the Australian House of Representatives from 1983 to 1990 and again from 1993 to 1996.
This is a list of electoral results for the Division of Corangamite in Australian federal elections from the division's creation in 1901 until the present.
This is a list of electoral results for the Division of Dunkley in Australian federal elections from the division's creation in 1984 until the present.
This is a list of electoral results for the Division of Wills in Australian federal elections from the division's creation in 1949 until the present.
At the 2016 federal election of the 150 House of Representatives seats the Liberal/National Coalition won 76, a one-seat majority, Labor won 69 seats and crossbenchers won the remaining five. A redistribution in 2017/18 changed the representation entitlements. For the next election, the number of seats in the House will increase to 151, South Australia will lose a seat, Victoria and the Australian Capital Territory (ACT) will gain one seat each.
The 2019 Australian federal election was held on Saturday 18 May 2019 to elect members of the 46th Parliament of Australia. The election had been called following the dissolution of the 45th Parliament as elected at the 2016 double dissolution federal election. All 151 seats in the House of Representatives and 40 of the 76 seats in the Senate were up for election.
This is a list of electoral division results for the 2016 Australian federal election in the state of Victoria.
The Division of Nicholls is an Australian Electoral Division in the state of Victoria, which was contested for the first time at the 2019 federal election.
The Division of Monash is an Australian Electoral Division in the state of Victoria, which was contested for the first time at the 2019 federal election.
The Division of Cooper is an Australian Electoral Division in the state of Victoria. It takes in the northern suburbs of Melbourne. The division was contested for the first time at the 2019 federal election, with Ged Kearney of the Australian Labor Party (ALP) elected as its inaugural member of parliament. She had previously represented the Division of Batman since the 2018 by-election.
The Division of Macnamara is an Australian Electoral Division in the state of Victoria, which was contested for the first time at the 2019 federal election. The division is named in honour of Dame Jean Macnamara, a medical researcher and doctor who specialised in the polio virus and was involved in children's health initiatives.
The Division of Fraser is an Australian electoral division in the state of Victoria, which was contested for the first time at the 2019 federal election.
This is a list of electoral division results for the 2022 Australian federal election in the state of Victoria.