| ||||||||||||||||||||||||||||||||||
All 5 Tasmanian seats in the Australian House of Representatives and 6 seats in the Australian Senate | ||||||||||||||||||||||||||||||||||
---|---|---|---|---|---|---|---|---|---|---|---|---|---|---|---|---|---|---|---|---|---|---|---|---|---|---|---|---|---|---|---|---|---|---|
| ||||||||||||||||||||||||||||||||||
Results by electorate |
This is a list of electoral division results for the 2019 Australian federal election in the state of Tasmania. [1]
2019 Australian federal election |
---|
|
National results |
State and territory results |
Party | Votes | % | Swing | Seats | Change | ||
---|---|---|---|---|---|---|---|
Liberal/National Coalition | |||||||
Liberal Party of Australia | 106,596 | 30.63 | −4.81 | 2 | 2 | ||
National Party of Australia | 13,819 | 3.97 | +3.97 | 0 | |||
Coalition total | 120,415 | 34.60 | -0.84 | 2 | 2 | ||
Australian Labor Party | 116,955 | 33.61 | −4.29 | 2 | 2 | ||
Australian Greens | 35,229 | 10.12 | −0.10 | ||||
United Australia Party | 16,868 | 4.85 | +4.85 | ||||
Pauline Hanson's One Nation | 9,699 | 2.79 | +2.79 | ||||
Fraser Anning's Conservative National Party | 1,969 | 0.57 | +0.57 | ||||
Animal Justice Party | 1,667 | 0.48 | +0.48 | ||||
Independent | 45,190 | 12.99 | +4.24 | 1 | |||
Total | 347,992 | 5 | |||||
Two-party-preferred vote | |||||||
Labor | 194,746 | 55.96 | −1.40 | ||||
Liberal/National Coalition | 153,246 | 44.04 | +1.40 | ||||
Invalid/blank votes | 15,970 | 4.39 | +0.41 | – | – | ||
Registered voters/turnout | 385,816 | 94.34 | +0.75 | – | – | ||
Source: AEC Tally Room |
Party | Candidate | Votes | % | ±% | |
---|---|---|---|---|---|
Liberal | Bridget Archer | 29,094 | 42.33 | +3.14 | |
Labor | Ross Hart | 23,878 | 34.74 | −4.91 | |
Greens | Tom Hall | 7,202 | 10.48 | −0.57 | |
United Australia | Allan Roark | 3,342 | 4.86 | +4.86 | |
Independent | Todd Lambert | 2,607 | 3.79 | +3.79 | |
Animal Justice | Susan Woodbury | 1,667 | 2.43 | +2.43 | |
National | Carl Cooper | 943 | 1.37 | +1.37 | |
Total formal votes | 68,733 | 95.50 | −0.53 | ||
Informal votes | 3,240 | 4.50 | +0.53 | ||
Turnout | 71,973 | 94.04 | +0.19 | ||
Two-party-preferred result | |||||
Liberal | Bridget Archer | 34,648 | 50.41 | +5.83 | |
Labor | Ross Hart | 34,085 | 49.59 | −5.83 | |
Liberal gain from Labor | Swing | +5.83 | |||
Party | Candidate | Votes | % | ±% | |
---|---|---|---|---|---|
Liberal | Gavin Pearce | 26,513 | 37.89 | −4.14 | |
Labor | Justine Keay | 22,434 | 32.06 | −7.51 | |
Independent | Craig Brakey | 7,619 | 10.89 | +10.89 | |
One Nation | Graham Gallaher | 3,879 | 5.54 | +5.54 | |
Greens | Phill Parsons | 3,384 | 4.84 | −1.99 | |
United Australia | Karen Spaulding | 2,575 | 3.68 | +3.68 | |
National | Sally Milbourne | 1,654 | 2.36 | +2.36 | |
Independent | Brett Smith | 1,203 | 1.72 | +1.72 | |
Conservative National | Shane Allan | 712 | 1.02 | +1.02 | |
Total formal votes | 69,973 | 92.92 | −1.96 | ||
Informal votes | 5,330 | 7.08 | +1.96 | ||
Turnout | 75,303 | 95.09 | +1.44 | ||
Two-party-preferred result | |||||
Liberal | Gavin Pearce | 37,151 | 53.09 | +4.82 | |
Labor | Justine Keay | 32,822 | 46.91 | −4.82 | |
Liberal gain from Labor | Swing | +4.82 | |||
Party | Candidate | Votes | % | ±% | |
---|---|---|---|---|---|
Independent | Andrew Wilkie | 33,761 | 50.05 | +6.02 | |
Labor | Ben McGregor | 13,641 | 20.22 | −2.80 | |
Liberal | Amanda-Sue Markham | 11,719 | 17.37 | −2.55 | |
Greens | Juniper Shaw | 6,458 | 9.57 | −1.04 | |
United Australia | Jim Starkey | 1,882 | 2.79 | +2.79 | |
Total formal votes | 67,461 | 97.56 | +0.48 | ||
Informal votes | 1,689 | 2.44 | −0.48 | ||
Turnout | 69,150 | 93.64 | +0.45 | ||
Notional two-party-preferred count | |||||
Labor | Ben McGregor | 44,642 | 66.17 | +0.84 | |
Liberal | Amanda-Sue Markham | 22,819 | 33.83 | −0.84 | |
Two-candidate-preferred result | |||||
Independent | Andrew Wilkie | 48,653 | 72.12 | +4.35 | |
Labor | Ben McGregor | 18,808 | 27.88 | −4.35 | |
Independent hold | Swing | +4.35 | |||
Party | Candidate | Votes | % | ±% | |
---|---|---|---|---|---|
Labor | Julie Collins | 30,911 | 43.99 | −2.86 | |
Liberal | Dean Young | 21,969 | 31.27 | −3.95 | |
Greens | Kit Darko | 11,420 | 16.25 | +2.72 | |
United Australia | Darren Winter | 4,704 | 6.70 | +6.70 | |
Conservative National | Darren Hawes | 1,257 | 1.79 | +1.79 | |
Total formal votes | 70,261 | 96.85 | +0.26 | ||
Informal votes | 2,284 | 3.15 | −0.26 | ||
Turnout | 72,545 | 94.68 | +0.80 | ||
Two-party-preferred result | |||||
Labor | Julie Collins | 43,706 | 62.21 | +1.48 | |
Liberal | Dean Young | 26,555 | 37.79 | −1.48 | |
Labor hold | Swing | +1.48 | |||
Party | Candidate | Votes | % | ±% | |
---|---|---|---|---|---|
Labor | Brian Mitchell | 26,091 | 36.46 | −3.93 | |
Liberal | Jessica Whelan | 17,301 | 24.18 | −16.44 | |
National | Deanna Hutchinson | 11,222 | 15.68 | +15.68 | |
Greens | Gary Whisson | 6,765 | 9.45 | +0.26 | |
One Nation | Tennille Murtagh | 5,820 | 8.13 | +8.13 | |
United Australia | Michael Warne | 4,365 | 6.10 | +6.10 | |
Total formal votes | 71,564 | 95.43 | −0.14 | ||
Informal votes | 3,427 | 4.57 | +0.14 | ||
Turnout | 74,991 | 94.18 | +0.76 | ||
Two-party-preferred result | |||||
Labor | Brian Mitchell | 39,491 | 55.18 | +1.35 | |
Liberal | Jessica Whelan | 32,073 | 44.82 | −1.35 | |
Labor hold | Swing | +1.35 | |||
The Division of Bass is an Australian electoral division in Tasmania.
The Division of Braddon is an Australian electoral division in the state of Tasmania. The current MP is Gavin Pearce of the Liberal Party, who was elected at the 2019 federal election.
The Division of Denison was an Australian electoral division in Tasmania, before being replaced by the Division of Clark as part of a 2016–17 redistribution.
The Division of Lyons is an Australian electoral division in Tasmania.
This is a list of electoral results for the Division of Bass in Australian federal elections from the division's creation in 1903 until the present.
This is a list of electoral results for the Division of Braddon in Australian federal elections from the division's creation in 1955 until the present.
This is a list of electoral results for the Division of Lyons in Australian federal elections from the division's creation in 1984 until the present.
This is a list of electoral results for the Division of Franklin in Australian federal elections from the division's creation in 1903 until the present.
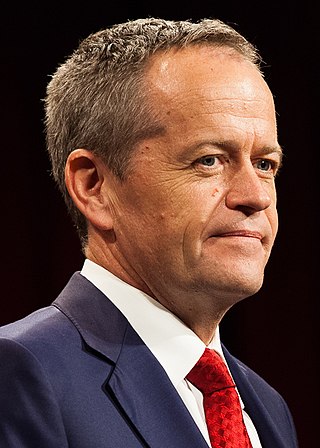
This is a list of electoral division results for the 2016 Australian federal election in the state of Tasmania.
The Division of Clark is an Australian Electoral Division in the state of Tasmania, first contested at the 2019 federal election.
This is a list of electoral results for the Division of Clark in Australian federal elections from the division's creation in 2019 until the present.
This is a list of electoral division results for the 2019 Australian federal election in the state of New South Wales.
This is a list of electoral division results for the 2019 Australian federal election in the state of Victoria. Victoria bucked the national trend, seeing a swing from the Coalition to Labor, whereas the swing across Australia was from Labor to the Coalition.
This is a list of electoral division results for the 2019 Australian federal election in the state of Queensland.
This is a list of electoral division results for the 2019 Australian federal election in the state of Western Australia.
This is a list of electoral division results for the 2019 Australian federal election in the state of South Australia.
The state-by-state results in the Australian House of Representatives at the 2019 federal election were: Coalition 77, Labor 68, Australian Greens 1, Centre Alliance 1, Katter's Australian Party 1, and Independents 3.
These are the results for the Australian Senate at the 2019 Australian federal election.
This is a list of electoral division results for the 2022 Australian federal election in the state of Victoria.
This is a list of electoral division results for the 2022 Australian federal election in the state of Tasmania.