Results of the 2019 Australian federal election (House of Representatives)

Last updated

2019 Australian federal election
(House of Representatives)
Flag of Australia (converted).svg
  2016 18 May 2019 (2019-05-18) 2022  

All 151 seats in the Australian House of Representatives
76 seats needed for a majority
Turnout91.9%
PartyLeader%Seats+/–
Labor Bill Shorten 33.3%68-1
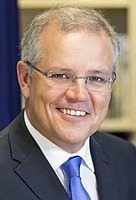
Liberal Scott Morrison 28.0%44-1
Liberal National Deb Frecklington 8.7%23+2
National Michael McCormack 4.5%100
Greens Richard Di Natale 10.4%10
Katter's Australian Bob Katter 0.5%10
Centre Alliance None0.3%10
Independents 3.4%3+1
This lists parties that won seats. See the complete results below.
2019 Australian federal election - Vote Strength.svg
Results of the election. The top map shows the first party preference by electorate. The bottom map shows the final two-party preferred vote result by electorate.
Prime Minister beforePrime Minister after
Scott Morrison 2014 crop.jpg Scott Morrison
Coalition
Scott Morrison
Coalition
Scott Morrison 2014 crop.jpg

The state-by-state results in the Australian House of Representatives at the 2019 federal election were: Coalition 77, Labor 68, Australian Greens 1, Centre Alliance 1, Katter's Australian Party 1, and Independents 3. [1] [2]

Contents

Australia

House of Representatives (IRV) – Turnout 91.89% (CV) [1]
2019 Australian House.svg
PartyVotes %Swing (pp)SeatsChange (seats)
  Liberal/National Coalition
  Liberal Party of Australia 3,989,40427.99−0.6844Decrease2.svg 1
  Liberal National Party (Qld) 1,236,4018.67+0.1523Increase2.svg 2
  National Party of Australia 642,2334.51−0.1010Steady2.svg
  Country Liberal Party (NT)38,8370.27+0.030Steady2.svg
Coalition total 5,906,87541.44−0.6077Increase2.svg 1
  Australian Labor Party 4,752,16033.34−1.3968Decrease2.svg 1
  Australian Greens 1,482,92310.40+0.171Steady2.svg
  Katter's Australian Party 69,7360.49−0.051Steady2.svg
  Centre Alliance 46,9310.33−1.521Steady2.svg
  Independent 479,8363.37+0.563 [lower-alpha 1] Increase2.svg 1
Total14,253,393100.00151Increase2.svg1
Two-party-preferred vote
  Liberal/National Coalition 7,344,81351.53+1.17
  Labor 6,908,58048.47−1.17
Invalid/blank votes835,2235.54+0.49
Registered voters [3] /turnout16,419,54391.89
Source: AEC Tally Room
Popular vote
Labor
33.34%
Liberal
27.99%
Greens
10.40%
LNP (QLD)
8.67%
National
4.51%
UAP
3.43%
One Nation
3.08%
CLP (NT)
0.27%
Independents
3.37%
Other
4.94%
Seats per party
Labor
45.03%
Liberal
29.14%
LNP (QLD)
15.23%
National
6.62%
Greens
0.66%
Centre Alliance
0.66%
Katter's
0.66%
Independents
1.99%

States

New South Wales

2019 Australian federal election
(New South Wales)
Flag of New South Wales.svg
  2016 18 May 2019 2022  

All 47 New South Wales seats in the Australian House of Representatives
and 6 seats in the Australian Senate
 First partySecond party
  Scott Morrison 2014 crop.jpg Bill Shorten-crop.jpg
Leader Scott Morrison Bill Shorten
Party Liberal/National coalition Labor
Last election23 seats24 seats
Seats won22 seats24 seats
Seat changeDecrease2.svg 1Steady2.svg
Popular vote1,930,4261,568,223
Percentage42.54%34.56%
SwingIncrease2.svg 0.22Decrease2.svg 2.37
TPP 51.78%48.22%
TPP swingIncrease2.svg 1.25Decrease2.svg 1.25

New South Wales - 2019 Federal Election.png
Sydney 2019 Federal Election.png
PartyVotes %SwingSeatsChange
Liberal/National Coalition
   Liberal Party of Australia 1,461,56032.21−0.4715Decrease2.svg 1
  National Party of Australia 468,86610.33+0.697Steady2.svg
Coalition total 1,930,42642.54+0.2222Decrease2.svg 1
  Australian Labor Party 1,568,22334.56−2.3724Steady2.svg
  Australian Greens 395,2388.71−0.24
  United Australia Party 153,4773.38+3.38
  Christian Democratic Party 97,5132.15−1.74
  Pauline Hanson's One Nation 59,4641.31+0.68
  Animal Justice Party 29,9810.66+0.19
  Sustainable Australia 27,3990.60+0.59
  Liberal Democratic Party 19,2910.43−0.03
  Shooters, Fishers and Farmers Party 18,1290.40+0.32
  Science Party 10,7910.24−0.10
  Fraser Anning's Conservative National Party 7,6540.17+0.17
  Australian Better Families 2,0720.05+0.05
  Australian Workers Party 1,6760.04+0.04
  Socialist Equality Party 1,3890.030.00
  Australia First Party 1,3720.03−0.04
  Non-Custodial Parents Party (Equal Parenting) 1,2130.03−0.05
  Involuntary Medication Objectors 1,1790.03+0.03
  The Great Australian Party 1,0860.02+0.02
  Independent 209,7634.62+0.681Increase2.svg 1
Total4,537,33647
Two-party-preferred vote
  Liberal/National Coalition 2,349,64151.78+1.25Decrease2.svg 1
  Labor 2,187,69548.22−1.25Steady2.svg
Invalid/blank votes342,0517.01+0.84
Registered voters/turnout5,294,46892.16+0.67
Source: AEC Tally Room

Victoria

2019 Australian federal election
(Victoria)
Flag of Victoria (Australia).svg
  2016 18 May 2019 2022  

All 38 Victorian seats in t he Australian House of Representatives
and 6 seats in the Australian Senate
 First partySecond partyThird party
  Bill Shorten-crop.jpg Scott Morrison 2014 crop.jpg Richard Di Natale 2020 (cropped).jpg
Leader Bill Shorten Scott Morrison Richard Di Natale
Party Labor Liberal/National coalition Greens
Last election18 seats17 seats1 seat
Seats won 21 seats15 seats1 seat
Seat changeIncrease2.svg 3Decrease2.svg 2Steady2.svg
Popular vote1,361,913 1,425,542439,169
Percentage36.86%38.58%11.89%
SwingIncrease2.svg 1.28Decrease2.svg 3.18Decrease2.svg 1.24
TPP 53.14%46.86%
TPP swingIncrease2.svg 1.63Decrease2.svg 1.63

2019 Federal Election Victoria (Party Vote).png
2019 Federal Election Results - Victoria (Primary).png
2019 Federal Election - Victoria (TCP).png
PartyVotes %SwingSeatsChange
Liberal/National Coalition
   Liberal Party of Australia 1,288,80534.88−2.1312Decrease2.svg 2
  National Party of Australia 136,7373.70−1.053Steady2.svg
Coalition total 1,425,54238.58-3.1815Decrease2.svg 2
  Australian Labor Party 1,361,91336.86+1.2821Increase2.svg 3
  Australian Greens 439,16911.89−1.241Steady2.svg
  United Australia Party 134,5813.64+3.64
  Animal Justice Party 41,3331.12−0.77
  Pauline Hanson's One Nation 35,1770.95+0.95
  Derryn Hinch's Justice Party 26,8030.73+0.33
  Victorian Socialists 12,4530.34+0.34
  Shooters, Fishers and Farmers Party 12,3840.34+0.30
  Fraser Anning's Conservative National Party 11,5040.31+0.31
  Democratic Labour Party 11,3970.31+0.31
  Rise Up Australia Party 10,7720.29−0.86
  Reason Party 8,8950.24+0.24
  Sustainable Australia 6,8090.18+0.18
  Australia First Party 4,0940.11+0.02
  Citizens Electoral Council 3,2670.09+0.03
  The Great Australian Party 2,4570.07+0.07
  Socialist Equality Party 8230.02+0.01
  Science Party 4970.01+0.01
  Independent 144,0433.90+1.181Steady2.svg
 Non Affiliated1,1190.03+0.03
Total3,695,03238Increase2.svg 1
Two-party-preferred vote
  Labor 1,963,41053.14+1.31
  Liberal/National Coalition 1,731,62246.86−1.31
 
Invalid/blank votes180,4264.66−0.11
Registered voters/turnout4,184,07692.62+1.48
Source: AEC Tally Room

Queensland

2019 Australian federal election
(Queensland)
Flag of Queensland.svg
  2016 18 May 2019 2022  

All 30 Queensland seats in the House of Representatives
and 6 seats in the Australian Senate
 First partySecond partyThird party
  Scott Morrison 2014 crop.jpg Bill Shorten-crop.jpg Bob Katter 2016.png
Leader Scott Morrison Bill Shorten Bob Katter
Party Coalition Labor Katter's Australian
Leader since3 June 2011 (2011-06-03)
Leader's seat Kennedy (Qld.)
Last election21 seats8 seats1 seat
Seats won 23 seats6 seats1 seat
Seat changeIncrease2.svg 2Decrease2.svg 2Steady2.svg
Popular vote1,236,401754,79269,736
Percentage43.70%26.68%2.47%
SwingIncrease2.svg 0.51Decrease2.svg 4.23Decrease2.svg 0.26
TPP 58.44%41.56%
TPP swingIncrease2.svg 4.34Decrease2.svg 4.34

2019 Australian federal election - QLD.jpg
Results by electorate.
PartyVotes %SwingSeatsChange
  Liberal National Party 1,236,40143.70+0.5123Increase2.svg 2
  Australian Labor Party 754,79226.68−4.236Decrease2.svg 2
  Australian Greens 292,05910.32+1.49
  Pauline Hanson's One Nation 250,7798.86+3.34
  United Australia Party 99,3293.51+3.51
  Katter's Australian Party 69,7362.47−0.261Steady2.svg
  Fraser Anning's Conservative National Party 49,5811.75+1.75
  Liberal Democratic Party 12,8350.45−0.51
  Animal Justice Party 12,5790.44+0.44
  Democratic Labour Party 6,8900.24+0.18
  Love Australia or Leave 1,5640.06+0.06
  Socialist Alliance 1,4570.05+0.05
  Sustainable Australia 1,4100.05+0.05
  Australia First Party 1,0690.04+0.04
  Australian Progressives 9650.03+0.03
  Socialist Equality Party 6540.02+0.02
  Independent 35,8941.27−0.62
 Non Affiliated1,0240.04+0.01
Total2,829,01830
Two-party-preferred vote
  Liberal National 1,653,26158.44+4.34Increase2.svg 2
  Labor 1,175,75741.56−4.34Decrease2.svg 2
Invalid/blank votes147,2904.95+0.25
Registered voters/turnout3,262,89891.22+0.05
Source: AEC Tally Room

Western Australia

2019 Australian federal election
(Western Australia)
Flag of Western Australia.svg
  2016 18 May 2019 2022  

All 16 Western Australian seats in the Australian House of Representatives
and 6 seats in the Australian Senate
 First partySecond party
  Scott Morrison 2014 crop.jpg Bill Shorten-crop.jpg
Leader Scott Morrison Bill Shorten
Party Liberal/National coalition Labor
Last election11 seats5 seats
Seats won11 seats5 seats
Seat changeSteady2.svg 0Steady2.svg 0
Popular vote633,930417,727
Percentage45.22%29.80%
SwingDecrease2.svg 3.48Decrease2.svg 2.65
TPP 55.55%44.45%
TPP swingIncrease2.svg 0.89Decrease2.svg 0.89
PartyVotes %SwingSeatsChange
Liberal/National Coalition
   Liberal Party of Australia 613,91543.79−1.9111Steady2.svg
  National Party of Australia 20,0151.43−1.570Steady2.svg
Coalition total 633,93045.22-3.4811Steady2.svg
  Australian Labor Party 417,72729.80−2.655Steady2.svg
  Australian Greens 162,87611.62−0.44
  Pauline Hanson's One Nation 74,4785.31+5.31
  United Australia Party 28,4882.03+2.03
  Western Australia Party 25,2981.80+1.80
  Australian Christians 23,8021.70−0.86
  Shooters, Fishers and Farmers Party 10,9660.78+0.33
  Fraser Anning's Conservative National Party 3,5750.26+0.26
  Science Party 1,3290.09+0.09
  Animal Justice Party 1,3040.09+0.09
  Socialist Alliance 9900.07−0.03
  The Great Australian Party 8830.06+0.06
  VOTEFLUX 6020.04+0.04
  Australia First Party 2510.02+0.02
  Independent 15,3751.10−0.20
Total1,401,87416
Two-party-preferred vote
  Liberal/National Coalition 778,78155.55+0.8911Steady2.svg
  Labor 623,09344.45−0.895Steady2.svg
Invalid/blank votes80,5755.44+1.45
Registered voters/turnout1,646,26290.05+1.67
Source: AEC Tally Room

South Australia

2019 Australian federal election
(South Australia)
Flag of South Australia.svg
  2016 18 May 2019 2022  

All 10 South Australian seats in the Australian House of Representatives
and 6 seats in the Australian Senate
 First partySecond partyThird party
  Bill Shorten-crop.jpg Scott Morrison 2014 crop.jpg 3x4.svg
Leader Bill Shorten Scott Morrison No leader
Party Labor Liberal/National coalition Centre Alliance
Last election6 seats4 seats1 seat
Seats won5 seats4 seats1 seat
Seat changeDecrease2.svg 1Steady2.svgSteady2.svg
Popular vote379,495438,01346,931
Percentage35.38%40.83%4.38%
SwingIncrease2.svg 3.83Increase2.svg 5.74Decrease2.svg 16.88
TPP 50.71%49.29%
TPP swingDecrease2.svg 1.56Increase2.svg 1.56
PartyVotes %SwingSeatsChange
Liberal/National Coalition
   Liberal Party of Australia 435,21740.57+5.484Steady2.svg
  National Party of Australia 2,7960.26+0.26Steady2.svg
Coalition total 438,01340.83+5.744Steady2.svg
  Australian Labor Party 379,49535.38+3.835Decrease2.svg 1
  Australian Greens 103,0369.61+3.40
  Centre Alliance 46,9314.38−16.881Steady2.svg
  United Australia Party 46,0074.29+4.29
  Animal Justice Party 29,8112.78+1.93
  Pauline Hanson's One Nation 8,9900.84+0.84
  Fraser Anning's Conservative National Party 2,9200.27+0.27
  Australian Democrats 2,0390.19+0.19
  Child Protection Party 1,2190.11+0.11
  Rise Up Australia Party 6030.06+0.06
  Australian Progressives 5650.05+0.05
  Independent 13,0191.21+0.47
Total1,072,64810Decrease2.svg 1
Two-party-preferred vote
  Labor 543,89850.71−1.565Decrease2.svg 2
  Liberal/National Coalition 528,75049.29+1.564Increase2.svg 1
Invalid/blank votes54,2024.81+0.63
Registered voters/turnout1,210,81793.07+1.26
Source: AEC Tally Room

Tasmania

2019 Australian federal election
(Tasmania)
Flag of Tasmania.svg
  2016 18 May 2019 2022  

All 5 Tasmanian seats in the Australian House of Representatives
and 6 seats in the Australian Senate
 First partySecond party
  Bill Shorten-crop.jpg Scott Morrison 2014 crop.jpg
Leader Bill Shorten Scott Morrison
Party Labor Liberal/National coalition
Last election4 seats0 seats
Seats won2 seats2 seats
Seat changeDecrease2.svg 2Increase2.svg 2
Popular vote116,955120,415
Percentage33.61%34.60%
SwingDecrease2.svg 4.29Decrease2.svg 0.84
TPP 55.96%44.04%
TPP swingDecrease2.svg 1.40Increase2.svg 1.40

Tasmania 2019 Federal Election Results.png
Results by electorate
PartyVotes %SwingSeatsChange
Liberal/National Coalition
   Liberal Party of Australia 106,59630.63−4.812Increase2.svg 2
  National Party of Australia 13,8193.97+3.970Steady2.svg
Coalition total 120,41534.60-0.842Increase2.svg 2
  Australian Labor Party 116,95533.61−4.292Decrease2.svg 2
  Australian Greens 35,22910.12−0.10
  United Australia Party 16,8684.85+4.85
  Pauline Hanson's One Nation 9,6992.79+2.79
  Fraser Anning's Conservative National Party 1,9690.57+0.57
  Animal Justice Party 1,6670.48+0.48
  Independent 45,19012.99+4.241Steady2.svg
Total347,9925
Two-party-preferred vote
  Labor 194,74655.96−1.40
  Liberal/National Coalition 153,24644.04+1.40
Invalid/blank votes15,9704.39+0.41
Registered voters/turnout385,81694.34+0.75
Source: AEC Tally Room

Territories

Australian Capital Territory

2019 Australian federal election
(Australian Capital Territory)
Flag of the Australian Capital Territory.svg
  2016 18 May 2019 2022  

All 3 Australian Capital Territory seats in the Australian House of Representatives
and all 2 seats in the Australian Senate
 First partySecond party
  Bill Shorten-crop.jpg Scott Morrison 2014 crop.jpg
Leader Bill Shorten Scott Morrison
Party Labor Liberal
Last election2 seats0 seats
Seats won3 seats0 seats
Seat changeIncrease2.svg 1Steady2.svg 0
Popular vote109,30083,311
Percentage41.09%31.32%
SwingDecrease2.svg 3.18Decrease2.svg 3.24
TPP 61.61%38.39%
TPP swingIncrease2.svg 0.48Decrease2.svg 0.48

2019 and 2022 Australian federal elections - ACT.jpg
Results by electorate.
PartyVotes %SwingSeatsChange
  Australian Labor Party 109,30041.09−3.183Increase2.svg 1
  Liberal Party of Australia 83,31131.32−3.240Steady2.svg
  Australian Greens 44,80416.85+1.76
  United Australia Party 7,1172.68+2.68
  Australian Progressives 6,2292.34+2.34
  Liberal Democratic Party 2,5400.95+0.95
  The Great Australian Party 9290.35+0.35
  Independent 11,7454.42+2.56
Total265,9753Increase2.svg 1
Two-party-preferred vote
  Labor 163,87861.61+0.48Increase2.svg 1
  Liberal 102,09738.39−0.48Steady2.svg
Invalid/blank votes9,6163.49+0.73
Registered voters/turnout295,84793.15+0.99
Source: AEC Tally Room

Northern Territory

2019 Australian federal election
(Northern Territory)
Flag of the Northern Territory.svg
  2016 18 May 2019 2022  

All 2 Northern Territory seats in the Australian House of Representatives
and all 2 seats in the Australian Senate
 First partySecond party
  Bill Shorten-crop.jpg Scott Morrison 2014 crop.jpg
Leader Bill Shorten Scott Morrison
Party Labor Coalition
Last election2 seat0 seat
Seats won2 seats0 seats
Seat changeSteady2.svg 0Steady2.svg 0
Popular vote43,75538,837
Percentage42.27%37.52%
SwingIncrease2.svg 1.88Increase2.svg 2.86
TPP 54.20%45.80%
TPP swingDecrease2.svg 2.86Increase2.svg 2.86

2022 Australian federal election - NT.jpg
Results by electorate.
PartyVotes %SwingSeatsChange
  Australian Labor Party 43,75542.27+1.882Steady2.svg
  Country Liberal Party 38,83737.52+4.270Steady2.svg
  Australian Greens 10,51210.15+1.06
  United Australia Party 2,9502.85+2.85
  Rise Up Australia Party 2,6572.57+0.02
  Independent 4,8074.64−1.24
Total103,5182
Two-party-preferred vote
  Australian Labor Party 56,10354.20−2.862Steady2.svg
  Country Liberal Party 47,41545.80+2.860Steady2.svg
Invalid/blank votes5,0934.69−2.66
Registered voters/turnout139,35977.94−1.07
Source: AEC Tally Room

Two party preferred preference flow

House of Representatives (IRV – Turnout 89.82% (CV) [4] [5]
PartyLiberal/National CoalitionLabor Party
Votes %±Votes %±
  Greens 263,83017.79%–0.271,219,09382.21%+0.27
  One Nation 286,04965.22%+14.75152,53834.78%–14.75
  United Australia 318,41365.14%+28.0170,40434.86%–28.0
  Liberal Democrats 26,77677.24%+7.137,89022.76%–7.13
  Christian Democrats 72,57574.43%+1.2324,93825.57%–1.23
  Conservative Nationals 55,43771.81%21,76628.19%
  Democratic Labour 7,27139.76%+4.0111,01660.24%–4.01
  Rise Up Australia 8,48160.44%+7.475,55139.56%–7.47
  Australia First 3,83056.44%+10.602,95643.56%–10.60
  Love Australia or Leave 85254.48%71245.52%
  Animal Justice Party 44,82438.42%+1.1771,85161.58%–1.17
  Federation

  Katter's Australian 46,75467.04%+14.0022,98232.96%–14.00

  Centre Alliance 15,43832.90%31,49367.10%

  Western Australia 12,39048.98%12,90851.02%
  The Great Australian 2,84253.07%2,51346.93%
  Victorian Socialists 1,54612.41%10,90787.59%
  Informed Medical Options 42936.39%75063.61%
  Australian Christians 19,22980.79%+8.524,57319.21%–8.52
  Shooters, Fishers and Farmers 24,49859.06%+13.2516,98140.94%–13.25
  Fusion 4,10532.54%8,51267.46%
  Socialist Alliance 49520.23%–5.721,95279.77%+5.72
  Justice 12,39346.24%–2.7714,41053.76%+2.77
  Australian Citizens 86326.42%–26.042,40473.58%+26.04
  Sustainable Australia 16,38946.01%–5.4819,22953.99%+5.48
  Reason 2,77631.21%+0.006,11968.79%+0.00
  Australian Progressives 2,54332.77%5,21667.23%
  Australian Democrats 63130.95%1,40869.05%

  Independents 194,82640.60%+0.00285,01059.40%+0.00

Total14,659,042100.00151Steady2.svg
Two-party-preferred vote
Liberal/National Coalition 7,344,81351.53%+1.17
Labor 7,642,16148.47%–1.17
Invalid/blank votes802,3765.19–0.35
Turnout15,461,41889.82–2.07
Registered voters17,213,433
Source: AEC for both votes

Notes

Related Research Articles

<span class="mw-page-title-main">Division of Barker</span> Australian federal electoral division

The Division of Barker is an Australian Electoral Division in the south-east of South Australia. The division was established on 2 October 1903, when South Australia's original single multi-member division was split into seven single-member divisions. It is named for Collet Barker, an early explorer of the region at the mouth of the Murray River. The 63,886 km² seat currently stretches from Morgan in the north to Port MacDonnell in the south, taking in the Murray Mallee, the Riverland, the Murraylands and most of the Barossa Valley, and includes the towns of Barmera, Berri, Bordertown, Coonawarra, Keith, Kingston SE, Loxton, Lucindale, Mannum, Millicent, Mount Gambier, Murray Bridge, Naracoorte, Penola, Renmark, Robe, Tailem Bend, Waikerie, and parts of Nuriootpa and Tanunda.

<span class="mw-page-title-main">Jim Saleam</span>

James Saleam is an Australian far-right extremist and the chairman of the Australia First Party. Saleam has been described as a white nationalist, who has been a strong advocate of barring further immigration to preserve a "self-contained, predominantly white nation resistant to further immigration or watering-down of its culture". This is often considered ironic Saleam is alleged to have mixed Lebanese ancestry; indigenous people of the Middle East, and in fact all non-Europeans, and even some Southern Europeans were once barred from immigrating to Australia until the 1950s under the White Australia policy. He has been observed wearing a swastika armband and associating with neo-Nazi skinheads.

<span class="mw-page-title-main">Non-Custodial Parents Party (Equal Parenting)</span> Political party in Australia

The Non-Custodial Parents Party was a minor political party in Australia registered between 1999 and 2020. It supported less government control of many aspects of daily family life, focusing on reform of family law and child support.

This is a list of electoral results for the Division of Bradfield in Australian federal elections from the electorate's creation in 1949 until the present.

This is a list of electoral results for the Division of Calare in Australian federal elections from the division's creation in 1906 until the present.

This is a list of electoral results for the Division of North Sydney in Australian federal elections from the electorate's creation in 1901 until the present.

Patricia May Petersen is an Australian academic from Ipswich, Queensland.

The Communist Alliance was registered on 16 March 2009 with the Australian Electoral Commission (AEC) as an Australian political party. It was an alliance of a number of Communist groups, individuals and ethnic-based communist parties. The Alliance was formed to allow communists to run in elections under the Communist banner, while allowing the Communist Party of Australia, a member of the Alliance, to retain a separate, independent membership.

This is a list of electoral results for the Division of Warringah in Australian federal elections from the division's creation in 1922 until the present.

<span class="mw-page-title-main">Pirate Party Australia</span> Political party in Australia

Pirate Party Australia is a political party in Australia that had traditionally represented civil liberty issues, but had also expanded into more traditional areas of policy. It was a Pirate Party which was based on the Pirate Party of Sweden, and continued to develop a comprehensive policy platform since its formation based on the Pirate ethos.

This is a list of electoral results for the Division of Wills in Australian federal elections from the division's creation in 1949 until the present.

This is a list of electoral results for the Division of Blair in Australian federal elections from the division's creation in 1998 until the present.

<span class="mw-page-title-main">National Tally Room</span>

The National Tally Room was the Australian centre for federal election results to be tallied for electorates and Senate quotas, making up the Parliament of Australia, which consists of the House of Representatives and the Senate. The Tally Room was operated by the Australian Electoral Commission (AEC) between 1972 and 2010.

<span class="mw-page-title-main">Australian Equality Party (Marriage)</span> Political party in Australia

The Australian Equality Party (Marriage) (also AEP; formerly Australian Equality Party) was an Australian political party founded by Jason Tuazon-McCheyne. The AEP had a platform that promoted equality and human rights, particularly in relation to the gay, lesbian, bisexual, transgender, intersex and queer (GLBTIQ) community. The party's goal was to get AEP Leader, Jason Tuazon-McCheyne, elected to the Senate at the 2016 Federal Election. The party was deregistered voluntarily on 26 March 2018.

<span class="mw-page-title-main">CountryMinded</span> Australian political party

CountryMinded was an Australian political party between 2014 and 2018 that claimed to represent the interests of regional Australians whose livelihoods depend either directly or indirectly on agricultural production. The party was founded in December 2014 by a group of people looking for accountable regional representation, including two brothers from New South Wales, David and Peter Mailler as the Country Party of Australia, and changed its name to CountryMinded in September 2015. In 2018, the party merged with the Australian Democrats.

<span class="mw-page-title-main">Yellow Vest Australia</span> Political party in Australia

Yellow Vest Australia (YVA), until 9 April 2019 known as the Australian Liberty Alliance (ALA), was a minor right-wing to far-right political party in Australia. The party was founded by members of the Q Society and has been described as the political wing of Q Society. The leader was Debbie Robinson (President), who was also national president of the Q Society. On 4 September 2020, the Australian Electoral Commission removed the Yellow Vest Australia from the registered political party list.

<span class="mw-page-title-main">2019 Australian Senate election</span> Australian federal election results

These are the results for the Australian Senate at the 2019 Australian federal election.
<span class="mw-page-title-main">Results of the 2022 Australian federal election in Queensland</span> Federal election results in Queensland, Australia

This is a list of electoral division results for the 2022 Australian federal election in the state of Queensland.

The number of seats won by each party in the Australian House of Representatives at the 2022 federal election were: Coalition 58, Labor 77, Australian Greens 4, Centre Alliance 1, Katter's Australian Party 1, and Independents 10.

<span class="mw-page-title-main">2022 Australian Senate election</span> Australian federal election results

The 2022 Australian federal election in the Senate was held on 21 May 2022 to elect 40 of the 76 senators in the Australian Senate, after a six-week campaign. Senators elected at this election are scheduled to take office on 1 July 2022, with the exception of the Senators elected from two territories whose terms commence from election day. The elected senators sit alongside continuing senators elected in 2019 as part of the 47th Parliament of Australia.

References

  1. 1 2 Muller, Damon (29 June 2020). "Federal Election 2019" (PDF). Research Paper 2019–20. Parliamentary Library. ISSN   2203-5249.
  2. "First preferences by party". AEC Tally Room. Australian Electoral Commission. Retrieved 31 July 2019.
  3. "Enrolment by state". Archived from the original on 20 October 2019. Retrieved 11 July 2019.
  4. "First preferences by party". Australian Electoral Commission. Retrieved 28 May 2022.
  5. "House Party Representation Leading". aec.gov.au. Retrieved 24 June 2022.