This is a list of electoral results for the Division of Fraser (Australian Capital Territory) in Australian federal elections from the division's creation in 1974 until its abolition in 2016.
Member | Party | Term | |
---|---|---|---|
Ken Fry | Labor | 1974–1984 | |
John Langmore | Labor | 1984–1996 | |
Steve Dargavel | Labor | 1997–1998 | |
Bob McMullan | Labor | 1998–2010 | |
Andrew Leigh | Labor | 2010–2016 |
Party | Candidate | Votes | % | ±% | |
---|---|---|---|---|---|
Labor | Andrew Leigh | 56,063 | 44.66 | −1.15 | |
Liberal | Elizabeth Lee | 39,693 | 31.62 | −0.79 | |
Greens | Adam Verwey | 17,665 | 14.07 | −5.77 | |
Bullet Train | Sam Huggins | 5,099 | 4.06 | +4.06 | |
Palmer United | Freddy Alcazar | 3,063 | 2.44 | +2.44 | |
Democrats | Darren Churchill | 2,444 | 1.95 | +1.95 | |
Rise Up Australia | Jill Ross | 1,508 | 1.20 | +1.20 | |
Total formal votes | 125,535 | 96.27 | +0.70 | ||
Informal votes | 4,859 | 3.73 | −0.70 | ||
Turnout | 130,394 | 94.46 | +0.07 | ||
Labor | Andrew Leigh | 78,614 | 62.62 | −1.58 | |
Liberal | Elizabeth Lee | 46,921 | 37.38 | +1.58 | |
Labor hold | Swing | −1.58 |
Party | Candidate | Votes | % | ±% | |
---|---|---|---|---|---|
Labor | Andrew Leigh | 51,092 | 45.81 | -5.29 | |
Liberal | James Milligan | 36,148 | 32.41 | +1.18 | |
Greens | Indra Esguerra | 22,126 | 19.84 | +6.46 | |
Secular | Quintin Hedges-Phillips | 2,175 | 1.95 | +1.95 | |
Total formal votes | 111,541 | 95.57 | -2.07 | ||
Informal votes | 5,171 | 4.43 | +2.07 | ||
Turnout | 116,712 | 94.55 | -1.12 | ||
Labor | Andrew Leigh | 71,613 | 64.20 | -0.87 | |
Liberal | James Milligan | 39,928 | 35.80 | +0.87 | |
Labor hold | Swing | -0.87 |
Party | Candidate | Votes | % | ±% | |
---|---|---|---|---|---|
Labor | Bob McMullan | 55,533 | 51.10 | +0.50 | |
Liberal | Troy Williams | 33,936 | 31.23 | −2.41 | |
Greens | Meredith Hunter | 14,546 | 13.38 | +2.12 | |
Democrats | Darren Churchill | 2,509 | 2.31 | −0.27 | |
Independent | Kerri Taranto | 1,275 | 1.17 | +1.17 | |
Socialist Alliance | Farida Iqbal | 539 | 0.50 | −1.42 | |
CEC | Jim Arnold | 342 | 0.31 | +0.31 | |
Total formal votes | 108,680 | 97.64 | +1.15 | ||
Informal votes | 2,629 | 2.36 | −1.15 | ||
Turnout | 111,309 | 95.67 | +0.92 | ||
Two-party-preferred result | |||||
Labor | Bob McMullan | 70,715 | 65.07 | +1.75 | |
Liberal | Troy Williams | 37,965 | 34.93 | −1.75 | |
Labor hold | Swing | +1.75 | |||
Party | Candidate | Votes | % | ±% | |
---|---|---|---|---|---|
Labor | Bob McMullan | 54,622 | 50.60 | +3.13 | |
Liberal | Adam Giles | 36,270 | 33.60 | +2.82 | |
Greens | David Turbayne | 12,197 | 11.30 | +3.42 | |
Democrats | Lynne Grimsey | 2,792 | 2.59 | −5.39 | |
Socialist Alliance | James Vassilopoulos | 2,067 | 1.91 | +1.91 | |
Total formal votes | 107,948 | 96.52 | +0.14 | ||
Informal votes | 3,887 | 3.48 | −0.14 | ||
Turnout | 111,835 | 94.72 | +0.11 | ||
Two-party-preferred result | |||||
Labor | Bob McMullan | 68,359 | 63.33 | +0.64 | |
Liberal | Adam Giles | 39,589 | 36.67 | −0.64 | |
Labor hold | Swing | +0.64 | |||
Party | Candidate | Votes | % | ±% | |
---|---|---|---|---|---|
Labor | Bob McMullan | 48,583 | 47.47 | −4.94 | |
Liberal | Martin Dunn | 31,503 | 30.78 | +2.71 | |
Democrats | Fleur Wimborne | 8,168 | 7.98 | +0.56 | |
Greens | Ben O'Callaghan | 8,067 | 7.88 | +3.35 | |
One Nation | Paul Kemp | 2,397 | 2.34 | −2.60 | |
Christian Democrats | Caroline O'Sullivan | 2,251 | 2.20 | +2.20 | |
James Vassilopoulos | 1,369 | 1.34 | +1.34 | ||
Total formal votes | 102,338 | 96.58 | −0.72 | ||
Informal votes | 3,844 | 3.62 | +0.72 | ||
Turnout | 106,182 | 95.19 | |||
Two-party-preferred result | |||||
Labor | Bob McMullan | 64,154 | 62.69 | −2.17 | |
Liberal | Martin Dunn | 38,184 | 37.31 | +2.17 | |
Labor hold | Swing | −2.17 | |||
Party | Candidate | Votes | % | ±% | |
---|---|---|---|---|---|
Labor | Bob McMullan | 50,573 | 52.41 | +1.89 | |
Liberal | Peter Smith | 27,088 | 28.07 | −9.72 | |
Democrats | Jason Wood | 7,157 | 7.42 | +7.42 | |
One Nation | Chris Spence | 4,773 | 4.95 | +4.95 | |
Greens | Gordon McAllister | 4,371 | 4.53 | −5.45 | |
Democratic Socialist | Sue Bull | 1,214 | 1.26 | +1.26 | |
Independent | Joanne Clark | 1,057 | 1.10 | +1.10 | |
Natural Law | David Seaton | 258 | 0.27 | −0.16 | |
Total formal votes | 96,491 | 97.10 | +0.32 | ||
Informal votes | 2,883 | 2.90 | −0.32 | ||
Turnout | 99,374 | 95.39 | −1.45 | ||
Two-party-preferred result | |||||
Labor | Bob McMullan | 62,580 | 64.86 | +6.00 | |
Liberal | Peter Smith | 33,911 | 35.14 | −6.00 | |
Labor hold | Swing | +6.00 | |||
Party | Candidate | Votes | % | ±% | |
---|---|---|---|---|---|
Labor | Steve Dargavel | 25,867 | 49.10 | −1.41 | |
Independent | Cheryl Hill | 9,642 | 18.30 | +18.30 | |
Greens | Dierk von Behrens | 5,584 | 10.60 | +0.70 | |
Independent | Alice Chu | 4,135 | 7.85 | +7.85 | |
AAFI | Angela Walker | 1,870 | 3.55 | +3.55 | |
Call to Australia | John Miller | 1,766 | 3.35 | +3.35 | |
Independent | Douglas Thompson | 1,456 | 2.76 | +2.76 | |
Reclaim Australia | John Hutchinson | 1,228 | 2.33 | +2.33 | |
Advance Australia | Kevin Connor | 490 | 0.93 | +0.93 | |
Independent | Joanne Clarke | 455 | 0.86 | +0.86 | |
Independent | Jim Bernard | 189 | 0.36 | +0.36 | |
Total formal votes | 52,682 | 94.08 | −2.66 | ||
Informal votes | 3,313 | 5.92 | +2.66 | ||
Turnout | 55,995 | 85.25 | −11.59 | ||
Two-party-preferred result | |||||
Labor | Steve Dargavel | 34,370 | 65.24 | +7.92 | |
Independent | Cheryl Hill | 18,312 | 34.76 | +34.76 | |
Labor hold | Swing | +7.92 | |||
Party | Candidate | Votes | % | ±% | |
---|---|---|---|---|---|
Labor | John Langmore | 30,459 | 50.51 | −3.77 | |
Liberal | Cheryl Hill | 23,877 | 39.59 | +7.15 | |
Greens | Miko Kirschbaum | 5,970 | 9.90 | +9.90 | |
Total formal votes | 60,306 | 96.74 | +0.55 | ||
Informal votes | 2,032 | 3.26 | −0.55 | ||
Turnout | 62,338 | 96.84 | +0.32 | ||
Two-party-preferred result | |||||
Labor | John Langmore | 34,443 | 57.32 | −4.74 | |
Liberal | Cheryl Hill | 25,647 | 42.68 | +4.74 | |
Labor hold | Swing | −4.74 | |||
Party | Candidate | Votes | % | ±% | |
---|---|---|---|---|---|
Labor | John Langmore | 49,098 | 54.42 | +8.52 | |
Liberal | Martin Dunn | 29,031 | 32.18 | +0.64 | |
Democrats | Greg Kramer | 5,559 | 6.16 | −9.75 | |
Independent | David Eastman | 2,070 | 2.29 | +2.29 | |
Sue Bolton | 2,023 | 2.24 | +2.24 | ||
Independent | Emile Brunoro | 672 | 0.74 | −0.37 | |
Independent | Kev Wise | 657 | 0.73 | +0.73 | |
Natural Law | Andrew Gordon | 654 | 0.72 | +0.72 | |
Independent | Peter Joseph | 463 | 0.51 | +0.51 | |
Total formal votes | 90,227 | 96.16 | −0.56 | ||
Informal votes | 3,600 | 3.84 | +0.56 | ||
Turnout | 90,227 | 96.52 | |||
Two-party-preferred result | |||||
Labor | John Langmore | 56,623 | 62.81 | +1.78 | |
Liberal | Martin Dunn | 33,521 | 37.19 | −1.78 | |
Labor hold | Swing | +1.78 | |||
Party | Candidate | Votes | % | ±% | |
---|---|---|---|---|---|
Labor | John Langmore | 36,544 | 46.0 | −8.0 | |
Liberal | Sandie Brooke | 24,746 | 31.1 | +2.2 | |
Democrats | Heather Jeffcoat | 12,876 | 16.2 | +9.0 | |
Greens | Sue Bolton | 3,213 | 4.0 | +4.0 | |
Nuclear Disarmament | Gareth Smith | 1,185 | 1.5 | −3.6 | |
Independent | Emile Brunoro | 949 | 1.2 | +0.6 | |
Total formal votes | 79,513 | 96.7 | |||
Informal votes | 2,680 | 3.3 | |||
Turnout | 82,193 | 95.6 | |||
Two-party-preferred result | |||||
Labor | John Langmore | 48,626 | 61.3 | −3.2 | |
Liberal | Sandie Brooke | 30,677 | 38.7 | +3.2 | |
Labor hold | Swing | −3.2 | |||
Party | Candidate | Votes | % | ±% | |
---|---|---|---|---|---|
Labor | John Langmore | 40,616 | 54.0 | −1.0 | |
Liberal | Ian Farrow | 21,767 | 28.9 | −2.2 | |
Democrats | Peter Hayes | 5,412 | 7.2 | −1.6 | |
Nuclear Disarmament | Gareth Smith | 3,852 | 5.1 | +5.1 | |
Family Movement | Dawn Casley-Smith | 2,050 | 2.7 | +2.7 | |
Independent | Larry O'Sullivan | 539 | 0.7 | +0.7 | |
Independent | Kevin Wise | 536 | 0.7 | +0.2 | |
Independent | Emile Brunoro | 473 | 0.6 | −0.5 | |
Total formal votes | 75,245 | 96.2 | |||
Informal votes | 2,988 | 3.8 | |||
Turnout | 78,233 | 93.0 | |||
Two-party-preferred result | |||||
Labor | John Langmore | 48,505 | 64.5 | +2.2 | |
Liberal | Ian Farrow | 26,718 | 35.5 | −2.2 | |
Labor hold | Swing | +2.2 | |||
Party | Candidate | Votes | % | ±% | |
---|---|---|---|---|---|
Labor | John Langmore | 38,183 | 55.0 | −10.0 | |
Liberal | John McLaren | 21,558 | 31.1 | +0.9 | |
Democrats | Andrew Freeman | 6,138 | 8.8 | +8.8 | |
Deadly Serious | Rozalyn Daniell | 2,102 | 3.0 | +0.5 | |
Independent | Emile Brunoro | 737 | 1.1 | +1.1 | |
Independent | Kevin Wise | 353 | 0.5 | −1.7 | |
Independent | Arthur Burns | 345 | 0.5 | +0.5 | |
Total formal votes | 69,416 | 94.1 | |||
Informal votes | 4,375 | 5.9 | |||
Turnout | 73,791 | 94.0 | |||
Two-party-preferred result | |||||
Labor | John Langmore | 43,261 | 62.3 | −5.1 | |
Liberal | John McLaren | 26,143 | 37.7 | +5.1 | |
Labor hold | Swing | −5.1 | |||
Party | Candidate | Votes | % | ±% | |
---|---|---|---|---|---|
Labor | Ken Fry | 41,755 | 65.6 | +8.3 | |
Liberal | Liz Grant | 18,848 | 29.6 | −5.0 | |
Deadly Serious | Rohan Greenland | 1,619 | 2.5 | +2.5 | |
Independent | Kevin Wise | 1,419 | 2.2 | +1.2 | |
Total formal votes | 63,641 | 97.6 | |||
Informal votes | 1,572 | 2.4 | |||
Turnout | 65,213 | 95.3 | |||
Two-party-preferred result | |||||
Labor | Ken Fry | 68.0 | +5.5 | ||
Liberal | Liz Grant | 32.0 | −5.5 | ||
Labor hold | Swing | +5.5 | |||
Party | Candidate | Votes | % | ±% | |
---|---|---|---|---|---|
Labor | Ken Fry | 36,564 | 57.3 | −2.1 | |
Liberal | Michael Yabsley | 22,059 | 34.6 | −6.0 | |
Democrats | Dimmen de Graaff | 4,156 | 6.5 | +6.5 | |
Independent | Kevin Wise | 636 | 1.0 | +1.0 | |
Independent | Basil Yakimov | 367 | 0.6 | +0.6 | |
Total formal votes | 63,782 | 97.6 | |||
Informal votes | 1,537 | 2.4 | |||
Turnout | 65,319 | 93.8 | |||
Two-party-preferred result | |||||
Labor | Ken Fry | 62.5 | +3.1 | ||
Liberal | Michael Yabsley | 37.5 | −3.1 | ||
Labor hold | Swing | +3.1 | |||
Party | Candidate | Votes | % | ±% | |
---|---|---|---|---|---|
Labor | Ken Fry | 34,609 | 59.4 | +8.3 | |
Liberal | George Mailath | 23,612 | 40.6 | −4.7 | |
Total formal votes | 58,221 | 97.5 | |||
Informal votes | 1,522 | 2.5 | |||
Turnout | 59,743 | 92.0 | |||
Labor hold | Swing | +7.4 | |||
Party | Candidate | Votes | % | ±% | |
---|---|---|---|---|---|
Labor | Ken Fry | 28,227 | 51.1 | −6.2 | |
Liberal | George Mailath | 25,030 | 45.3 | +10.3 | |
Liberal Movement | Claude Hammond | 1,944 | 3.5 | +3.5 | |
Total formal votes | 55,201 | 98.3 | |||
Informal votes | 969 | 1.7 | |||
Turnout | 56,170 | 94.2 | |||
Two-party-preferred result | |||||
Labor | Ken Fry | 52.0 | −8.7 | ||
Liberal | George Mailath | 48.0 | +8.7 | ||
Labor hold | Swing | −8.7 | |||
Party | Candidate | Votes | % | ±% | |
---|---|---|---|---|---|
Labor | Ken Fry | 27,294 | 57.3 | +5.2 | |
Liberal | Larry Pickering | 16,662 | 35.0 | +12.2 | |
Australia | John Filler | 1,610 | 3.4 | −10.3 | |
Country | Stephen Lamb | 1,429 | 3.0 | +3.0 | |
Independent | Anthony Emerson-Elliott | 393 | 0.8 | +0.8 | |
Independent | Kevin Wise | 279 | 0.6 | +0.6 | |
Total formal votes | 47,667 | 98.5 | |||
Informal votes | 741 | 1.5 | |||
Turnout | 48,408 | 91.9 | |||
Two-party-preferred result | |||||
Labor | Ken Fry | 60.7 | −4.8 | ||
Liberal | Larry Pickering | 39.3 | +4.8 | ||
Labor notional hold | Swing | −4.8 | |||
The Australian Electoral Commission (AEC) is the independent federal agency in charge of organising, conducting and supervising federal Australian elections, by-elections and referendums.
The Division of Higgins is an Australian Electoral Division in Victoria for the Australian House of Representatives. The division covers 41 km2 (16 sq mi) in Melbourne's south-eastern suburbs. The main suburbs include Armadale, Ashburton, Carnegie, Glen Iris, Kooyong, Malvern, Malvern East, Murrumbeena, Prahran and Toorak; along with parts of Camberwell, Ormond and South Yarra. Though historically a safe conservative seat, Higgins was won by the Liberal Party by a margin of just 3.9 percent over the Labor Party at the 2019 election, the closest result in the seat’s history. It then flipped to Labor in the 2022 election.
In Australia, electoral districts for the Australian House of Representatives are called divisions or more commonly referred to as electorates or seats. There are currently 151 single-member electorates for the Australian House of Representatives.
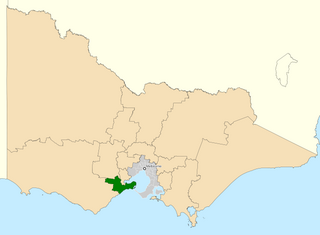
The Division of Corangamite is an Australian electoral division in the state of Victoria. The division was proclaimed in 1900, and was one of the original 65 divisions to be contested at the first federal election. It is named for Lake Corangamite, although the lake no longer falls within the division's boundaries.
The Division of Fenner is an Australian Electoral Division in the Australian Capital Territory and the Jervis Bay Territory. As of the 2018 redistribution, it includes Gungahlin and the part of Belconnen north of Belconnen Way and west of Eastern Valley Way, Aikman Drive and William Slim Drive. It also includes the Jervis Bay Territory.
The Division of Boothby is an Australian federal electoral division in South Australia. The division was one of the seven established when the former Division of South Australia was redistributed on 2 October 1903 and is named after William Boothby (1829–1903), the Returning Officer for the first federal election.
The Division of Curtin is an Australian electoral division in Western Australia.
The Division of Maribyrnong is an Australian electoral division in the state of Victoria. It is located in the inner north-western suburbs of Melbourne. Suburbs include Aberfeldie, Airport West, Avondale Heights, Essendon, Footscray, Gowanbrae, Keilor East, Maribyrnong, Moonee Ponds, Niddrie, West Footscray and Tullamarine. Due to redistributions, the division has been slowly moving west and changed with the introduction of the Division of Fraser in 2018. According to the 2011 census, Maribyrnong has the highest proportion of Catholics in any Commonwealth Electoral Division in Australia with 41.6% of the population.
In Australia, a redistribution is the process of redrawing the boundaries of electoral divisions for the House of Representatives arising from changes in population and changes in the number of representatives. There is no redistribution for the Senate as each State constitutes a division, though with multiple members. The Australian Electoral Commission (AEC), an independent statutory authority, oversees the apportionment and redistribution process for federal divisions, taking into account a number of factors. Politicians, political parties and the public may make submissions to the AEC on proposed new boundaries, but any interference with their deliberations is considered a serious offence.
The 1980 Australian federal election was held in Australia on 18 October 1980. All 125 seats in the House of Representatives and 34 of the 64 seats in the Senate were up for election. The incumbent Liberal–NCP coalition government, led by Prime Minister Malcolm Fraser, was elected to a third term with a much reduced majority, defeating the opposition Labor Party led by Bill Hayden. This was the last federal election victory for the Coalition until the 1996 election.
This is a list of electoral results for the Division of Macquarie in Australian federal elections from the division's creation in 1901 until the present.
This is a list of electoral results for the Division of New England in Australian federal elections from the division's creation in 1901 until the present.
This is a list of electoral results for the Division of Wentworth in Australian federal elections from the division's creation in 1901 until the present.
This is a list of electoral results for the Division of Ballarat in Australian federal elections from the division's creation in 1901 until the present. The seat was known as Ballaarat from 1901 until 1977.
This is a list of electoral results for the Division of Batman in Australian federal elections from the division's creation in 1906 until its abolition in 2019. The Division was then renamed Cooper
This is a list of electoral results for the Division of Kooyong in Australian federal elections from the division's creation in 1901 until the present.
This is a list of electoral divisions for the Australian 2010 federal election for the Australian Capital Territory and the Northern Territory.
This is a list of electoral division results for the 2010 Australian federal election for the state of South Australia.
The Division of Fraser was an Australian Electoral Division in the Australian Capital Territory and the Jervis Bay Territory.
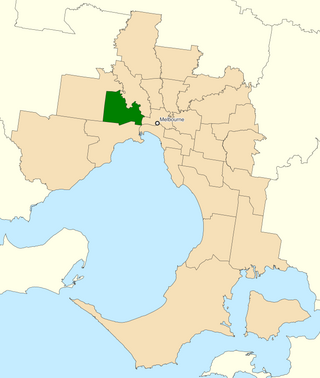
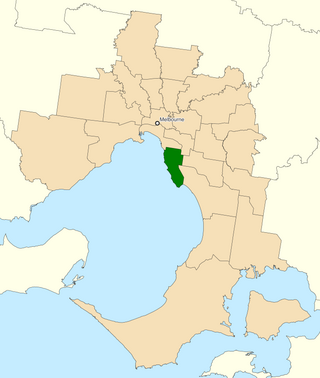
The Division of Fraser is an Australian electoral division in the state of Victoria, which was contested for the first time at the 2019 federal election.