This is a list of electoral results for the Division of Henty in Australian federal elections from the division's creation in 1913 until its abolition in 1990.
Member | Party | Term | |
---|---|---|---|
James Boyd | Liberal | 1913–1917 | |
Nationalist | 1917–1919 | ||
Frederick Francis | Independent | 1919–1922 | |
Nationalist | 1922–1925 | ||
(Sir) Henry Gullett | Nationalist | 1925–1931 | |
United Australia | 1931–1940 | ||
Arthur Coles | Independent | 1940–1946 | |
Jo Gullett | Liberal | 1946–1955 | |
Max Fox | Liberal | 1955–1974 | |
Joan Child | Labor | 1974–1975 | |
Ken Aldred | Liberal | 1975–1980 | |
Joan Child | Labor | 1980–1990 |
Party | Candidate | Votes | % | ±% | |
---|---|---|---|---|---|
Labor | Joan Child | 30,695 | 50.5 | −2.4 | |
Liberal | Rudi Michelson | 25,138 | 41.3 | +2.2 | |
Democrats | Paul Hegarty | 4,992 | 8.2 | +2.9 | |
Total formal votes | 60,825 | 94.5 | |||
Informal votes | 3,526 | 5.5 | |||
Turnout | 64,351 | 94.3 | |||
Two-party-preferred result | |||||
Labor | Joan Child | 33,301 | 54.8 | −1.9 | |
Liberal | Rudi Michelson | 27,496 | 45.2 | +1.9 | |
Labor hold | Swing | -1.9 | |||
Party | Candidate | Votes | % | ±% | |
---|---|---|---|---|---|
Labor | Joan Child | 32,297 | 52.9 | −1.2 | |
Liberal | Rudi Michelson | 23,885 | 39.1 | −0.3 | |
Democrats | Margaret Moore | 3,216 | 5.3 | +1.0 | |
Democratic Labor | Martin Callanan | 988 | 1.6 | −0.6 | |
National | Peter Ryan | 690 | 1.1 | +1.1 | |
Total formal votes | 61,076 | 93.1 | |||
Informal votes | 4,492 | 6.9 | |||
Turnout | 65,568 | 94.4 | |||
Two-party-preferred result | |||||
Labor | Joan Child | 34,627 | 56.7 | −0.2 | |
Liberal | Rudi Michelson | 26,441 | 43.3 | +0.2 | |
Labor hold | Swing | -0.2 | |||
Party | Candidate | Votes | % | ±% | |
---|---|---|---|---|---|
Labor | Joan Child | 36,259 | 54.7 | +5.6 | |
Liberal | Craig Baxter | 25,709 | 38.8 | −3.5 | |
Democrats | Harry Eichler | 2,845 | 4.3 | −1.7 | |
Democratic Labor | Paul Carroll | 1,442 | 2.2 | −0.4 | |
Total formal votes | 66,255 | 98.3 | |||
Informal votes | 1,169 | 1.7 | |||
Turnout | 67,424 | 95.5 | |||
Two-party-preferred result | |||||
Labor | Joan Child | 57.5 | +4.7 | ||
Liberal | Craig Baxter | 42.5 | −4.7 | ||
Labor hold | Swing | +4.7 | |||
Party | Candidate | Votes | % | ±% | |
---|---|---|---|---|---|
Labor | Joan Child | 32,102 | 49.1 | +7.6 | |
Liberal | Ken Aldred | 27,702 | 42.3 | −2.7 | |
Democrats | Jonathan Melland | 3,926 | 6.0 | −3.9 | |
Democratic Labor | John Mulholland | 1,698 | 2.6 | −0.5 | |
Total formal votes | 65,428 | 97.8 | |||
Informal votes | 1,441 | 2.2 | |||
Turnout | 66,869 | 95.2 | |||
Two-party-preferred result | |||||
Labor | Joan Child | 34,541 | 52.8 | +5.5 | |
Liberal | Ken Aldred | 30,887 | 47.2 | −5.5 | |
Labor gain from Liberal | Swing | +5.5 | |||
Party | Candidate | Votes | % | ±% | |
---|---|---|---|---|---|
Liberal | Ken Aldred | 29,660 | 45.0 | −6.5 | |
Labor | Joan Child | 27,325 | 41.5 | −2.3 | |
Democrats | Fred Ingamells | 6,509 | 9.9 | +9.9 | |
Democratic Labor | Terry Farrell | 2,061 | 3.1 | −0.4 | |
Independent | Tony Dear | 359 | 0.5 | +0.5 | |
Total formal votes | 65,914 | 97.1 | |||
Informal votes | 1,946 | 2.9 | |||
Turnout | 67,860 | 95.8 | |||
Two-party-preferred result | |||||
Liberal | Ken Aldred | 34,736 | 52.7 | −2.5 | |
Labor | Joan Child | 31,178 | 47.3 | +2.5 | |
Liberal hold | Swing | -2.5 | |||
Party | Candidate | Votes | % | ±% | |
---|---|---|---|---|---|
Liberal | Ken Aldred | 29,621 | 51.5 | +7.5 | |
Labor | Joan Child | 25,158 | 43.8 | −5.8 | |
Democratic Labor | Terry Farrell | 1,989 | 3.5 | −0.7 | |
Australia | Michael Hughes | 536 | 0.9 | +0.9 | |
Independent | Marc Aussie-Stone | 190 | 0.3 | +0.3 | |
Total formal votes | 57,494 | 98.2 | |||
Informal votes | 1,064 | 1.8 | |||
Turnout | 58,558 | 95.9 | |||
Two-party-preferred result | |||||
Liberal | Ken Aldred | 55.2 | +6.7 | ||
Labor | Joan Child | 44.8 | −6.7 | ||
Liberal gain from Labor | Swing | +6.7 | |||
Party | Candidate | Votes | % | ±% | |
---|---|---|---|---|---|
Labor | Joan Child | 28,111 | 49.6 | +3.2 | |
Liberal | Max Fox | 24,953 | 44.0 | +1.6 | |
Democratic Labor | Terry Farrell | 2,408 | 4.2 | −3.2 | |
Australia | Michael Hughes | 1,191 | 2.1 | −1.8 | |
Total formal votes | 56,663 | 98.1 | |||
Informal votes | 1,093 | 1.9 | |||
Turnout | 57,756 | 95.3 | |||
Two-party-preferred result | |||||
Labor | Joan Child | 51.5 | +1.8 | ||
Liberal | Max Fox | 48.5 | −1.8 | ||
Labor gain from Liberal | Swing | +1.8 | |||
Party | Candidate | Votes | % | ±% | |
---|---|---|---|---|---|
Labor | Joan Child | 24,701 | 46.4 | +10.7 | |
Liberal | Max Fox | 22,577 | 42.4 | −4.2 | |
Democratic Labor | Terry Farrell | 3,926 | 7.4 | −2.3 | |
Australia | Michael Hughes | 2,080 | 3.9 | +3.9 | |
Total formal votes | 53,284 | 97.9 | |||
Informal votes | 1,128 | 2.1 | |||
Turnout | 54,412 | 95.4 | |||
Two-party-preferred result | |||||
Liberal | Max Fox | 26,796 | 50.3 | −9.1 | |
Labor | Joan Child | 26,488 | 49.7 | +9.1 | |
Liberal hold | Swing | -9.1 | |||
Party | Candidate | Votes | % | ±% | |
---|---|---|---|---|---|
Liberal | Max Fox | 24,353 | 46.6 | −4.9 | |
Labor | Robert Ray | 18,670 | 35.7 | −1.7 | |
Democratic Labor | John Launder | 5,050 | 9.7 | −1.4 | |
Independent | Herman Crowther | 4,172 | 8.0 | +8.0 | |
Total formal votes | 52,245 | 97.3 | |||
Informal votes | 1,440 | 2.7 | |||
Turnout | 53,685 | 95.0 | |||
Two-party-preferred result | |||||
Liberal | Max Fox | 59.4 | −2.3 | ||
Labor | Robert Ray | 40.6 | +2.3 | ||
Liberal hold | Swing | -2.3 | |||
Party | Candidate | Votes | % | ±% | |
---|---|---|---|---|---|
Liberal | Max Fox | 23,072 | 49.9 | −1.7 | |
Labor | Maureen Campbell-Teich | 18,053 | 39.0 | +6.0 | |
Democratic Labor | Henry Moore | 5,114 | 11.1 | +1.1 | |
Total formal votes | 46,239 | 97.2 | |||
Informal votes | 1,354 | 2.8 | |||
Turnout | 47,593 | 95.7 | |||
Two-party-preferred result | |||||
Liberal | Max Fox | 27,783 | 60.1 | +0.8 | |
Labor | Maureen Campbell-Teich | 18,456 | 39.9 | −0.8 | |
Liberal hold | Swing | +0.8 | |||
Party | Candidate | Votes | % | ±% | |
---|---|---|---|---|---|
Liberal | Max Fox | 24,110 | 51.6 | +5.7 | |
Labor | George Taylor | 15,425 | 33.0 | −7.3 | |
Democratic Labor | Joseph McHugh | 4,694 | 10.0 | −3.8 | |
Independent Labor | Herbert Viney | 2,500 | 5.3 | +5.3 | |
Total formal votes | 46,729 | 98.8 | |||
Informal votes | 564 | 1.2 | |||
Turnout | 47,293 | 96.7 | |||
Two-party-preferred result | |||||
Liberal | Max Fox | 59.3 | +1.6 | ||
Labor | George Taylor | 40.7 | −1.6 | ||
Liberal hold | Swing | +1.6 | |||
Party | Candidate | Votes | % | ±% | |
---|---|---|---|---|---|
Liberal | Max Fox | 21,011 | 45.9 | −4.6 | |
Labor | Sir George Jones | 18,416 | 40.3 | +3.7 | |
Democratic Labor | Henry Moore | 6,302 | 13.8 | +0.9 | |
Total formal votes | 45,729 | 98.2 | |||
Informal votes | 856 | 1.8 | |||
Turnout | 46,585 | 96.0 | |||
Two-party-preferred result | |||||
Liberal | Max Fox | 26,377 | 57.7 | −4.4 | |
Labor | Sir George Jones | 19,352 | 42.3 | +4.4 | |
Liberal hold | Swing | -4.4 | |||
Party | Candidate | Votes | % | ±% | |
---|---|---|---|---|---|
Liberal | Max Fox | 22,506 | 50.5 | −3.7 | |
Labor | Tom Gilhooley | 16,276 | 36.6 | +2.8 | |
Democratic Labor | Henry Moore | 5,742 | 12.9 | +0.9 | |
Total formal votes | 44,524 | 97.8 | |||
Informal votes | 987 | 2.2 | |||
Turnout | 45,511 | 96.2 | |||
Two-party-preferred result | |||||
Liberal | Max Fox | 62.1 | −1.7 | ||
Labor | Tom Gilhooley | 37.9 | +1.7 | ||
Liberal hold | Swing | -1.7 | |||
Party | Candidate | Votes | % | ±% | |
---|---|---|---|---|---|
Liberal | Max Fox | 22,377 | 54.2 | +0.6 | |
Labor | Percy Treyvaud | 13,953 | 33.8 | −11.9 | |
Labor (A-C) | Henry Moore | 4,966 | 12.0 | +12.0 | |
Total formal votes | 41,296 | 97.3 | |||
Informal votes | 1,146 | 2.7 | |||
Turnout | 42,442 | 94.8 | |||
Two-party-preferred result | |||||
Liberal | Max Fox | 63.8 | +9.5 | ||
Labor | Percy Treyvaud | 36.2 | −9.5 | ||
Liberal hold | Swing | +9.5 | |||
Party | Candidate | Votes | % | ±% | |
---|---|---|---|---|---|
Liberal | Jo Gullett | 22,858 | 56.6 | −0.7 | |
Labor | Alexander Miller | 16,400 | 40.6 | −0.2 | |
Independent Liberal | Noel Schafer | 1,124 | 2.8 | +2.8 | |
Total formal votes | 40,382 | 99.0 | |||
Informal votes | 392 | 1.0 | |||
Turnout | 40,774 | 96.2 | |||
Two-party-preferred result | |||||
Liberal | Jo Gullett | 58.0 | +0.5 | ||
Labor | Alexander Miller | 42.0 | −0.5 | ||
Liberal hold | Swing | +0.5 | |||
Party | Candidate | Votes | % | ±% | |
---|---|---|---|---|---|
Liberal | Jo Gullett | 23,642 | 57.3 | +2.1 | |
Labor | Percy Treyvaud | 16,814 | 40.8 | −1.9 | |
Communist | Doris McRae | 781 | 1.9 | +1.9 | |
Total formal votes | 41,237 | 98.6 | |||
Informal votes | 584 | 1.4 | |||
Turnout | 41,821 | 96.4 | |||
Two-party-preferred result | |||||
Liberal | Jo Gullett | 57.5 | +2.1 | ||
Labor | Percy Treyvaud | 42.5 | −2.1 | ||
Liberal hold | Swing | +2.1 | |||
Party | Candidate | Votes | % | ±% | |
---|---|---|---|---|---|
Liberal | Jo Gullett | 22,650 | 55.2 | +4.1 | |
Labor | Val Doube | 17,548 | 42.7 | −6.2 | |
Lang Labor | Charles Dicker | 858 | 2.1 | +2.1 | |
Total formal votes | 41,056 | 98.8 | |||
Informal votes | 510 | 1.2 | |||
Turnout | 41,566 | 96.7 | |||
Two-party-preferred result | |||||
Liberal | Jo Gullett | 55.4 | +4.3 | ||
Labor | Val Doube | 44.6 | −4.3 | ||
Liberal hold | Swing | +4.3 | |||
Party | Candidate | Votes | % | ±% | |
---|---|---|---|---|---|
Liberal | Jo Gullett | 41,069 | 52.1 | +14.0 | |
Labor | Val Doube | 37,785 | 47.9 | +47.9 | |
Total formal votes | 78,854 | 98.5 | |||
Informal votes | 1,196 | 1.5 | |||
Turnout | 80,050 | 95.0 | |||
Liberal hold | Swing | +14.0 | |||
Party | Candidate | Votes | % | ±% | |
---|---|---|---|---|---|
Liberal | Jo Gullett | 38,718 | 54.3 | +16.2 | |
Labor | Val Doube | 32,556 | 45.7 | +45.7 | |
Total formal votes | 71,274 | 98.5 | |||
Informal votes | 1,086 | 1.5 | |||
Turnout | 72,360 | 89.5 | |||
Liberal gain from Independent | Swing | +9.8 | |||
Party | Candidate | Votes | % | ±% | |
---|---|---|---|---|---|
Independent | Arthur Coles | 32,885 | 44.5 | −10.1 | |
United Australia | Jo Gullett | 28,123 | 38.1 | +38.1 | |
Independent Labor | Bernard Rees | 4,598 | 6.2 | +6.2 | |
Services and Citizens | Edmund Lind | 4,437 | 6.0 | +6.0 | |
Women for Canberra | Ivy Weber | 2,885 | 3.9 | +3.9 | |
Independent Liberal | Carlyle Ferguson | 928 | 1.3 | +1.3 | |
Total formal votes | 73,856 | 96.6 | |||
Informal votes | 2,596 | 3.4 | |||
Turnout | 76,452 | 97.5 | |||
Two-party-preferred result | |||||
Independent | Arthur Coles | 55.5 | −8.0 | ||
United Australia | Jo Gullett | 44.5 | +44.5 | ||
Independent hold | Swing | -8.0 | |||
Party | Candidate | Votes | % | ±% | |
---|---|---|---|---|---|
Independent | Arthur Coles | 35,542 | 54.6 | +54.6 | |
Labor | Arthur Haywood | 23,319 | 35.8 | +3.3 | |
Independent | Eric Young | 4,927 | 7.6 | +7.6 | |
Independent | Samuel Thomas | 704 | 1.1 | +1.1 | |
Independent | Edward Riley | 567 | 0.9 | +0.9 | |
Total formal votes | 65,059 | 97.9 | |||
Informal votes | 1,368 | 2.1 | |||
Turnout | 66,427 | 96.7 | |||
Two-party-preferred result | |||||
Independent | Arthur Coles | 63.5 | +63.5 | ||
Labor | Arthur Haywood | 36.5 | −3.2 | ||
Independent gain from United Australia | Swing | +3.2 | |||
Party | Candidate | Votes | % | ±% | |
---|---|---|---|---|---|
United Australia | Sir Henry Gullett | 31,574 | 53.0 | −3.5 | |
Labor | Sydney Walker | 19,324 | 32.5 | +8.3 | |
Independent | Rupert Hornabrook | 8,647 | 14.5 | +14.5 | |
Total formal votes | 59,545 | 97.6 | |||
Informal votes | 1,450 | 2.4 | |||
Turnout | 60,995 | 96.2 | |||
Two-party-preferred result | |||||
United Australia | Sir Henry Gullett | 60.3 | −5.9 | ||
Labor | Sydney Walker | 39.7 | +5.9 | ||
United Australia hold | Swing | -5.9 | |||
Party | Candidate | Votes | % | ±% | |
---|---|---|---|---|---|
United Australia | Sir Henry Gullett | 47,010 | 60.1 | −14.9 | |
Labor | William Turner | 16,878 | 21.6 | −3.4 | |
Ind. Nationalist | Alexander Steele | 8,315 | 10.6 | +10.6 | |
Social Credit | Lockhart Stewart | 6,030 | 7.7 | +7.7 | |
Total formal votes | 78,233 | 96.9 | |||
Informal votes | 2,544 | 3.1 | |||
Turnout | 80,777 | 94.6 | |||
Two-party-preferred result | |||||
United Australia | Sir Henry Gullett | 69.3 | −5.7 | ||
Labor | William Turner | 30.7 | +5.7 | ||
United Australia hold | Swing | -5.7 | |||
Party | Candidate | Votes | % | ±% | |
---|---|---|---|---|---|
United Australia | Henry Gullett | 56,404 | 75.0 | +26.4 | |
Labor | Fred Katz | 18,835 | 25.0 | −20.4 | |
Total formal votes | 75,239 | 97.4 | |||
Informal votes | 1,985 | 2.6 | |||
Turnout | 77,224 | 94.2 | |||
United Australia hold | Swing | +23.8 | |||
Party | Candidate | Votes | % | ±% | |
---|---|---|---|---|---|
Nationalist | Henry Gullett | 35,557 | 48.6 | −18.0 | |
Labor | Billy Duggan | 33,195 | 45.4 | +12.0 | |
Ind. Nationalist | William Bolton | 4,355 | 6.0 | +6.0 | |
Total formal votes | 73,107 | 98.8 | |||
Informal votes | 870 | 1.2 | |||
Turnout | 73,977 | 95.2 | |||
Two-party-preferred result | |||||
Nationalist | Henry Gullett | 37,433 | 51.2 | −15.4 | |
Labor | Billy Duggan | 35,674 | 48.8 | +15.4 | |
Nationalist hold | Swing | -15.4 | |||
Party | Candidate | Votes | % | ±% | |
---|---|---|---|---|---|
Nationalist | Henry Gullett | 45,489 | 66.6 | +15.1 | |
Labor | Edward Stewart | 22,839 | 33.4 | +3.7 | |
Total formal votes | 68,328 | 96.8 | |||
Informal votes | 2,249 | 3.2 | |||
Turnout | 70,577 | 94.4 | |||
Nationalist hold | Swing | +5.7 | |||
Party | Candidate | Votes | % | ±% | |
---|---|---|---|---|---|
Nationalist | Henry Gullett | 31,077 | 51.5 | −28.7 | |
Labor | Edward Stewart | 17,930 | 29.7 | +9.9 | |
Ind. Nationalist | Donald Mackinnon | 11,318 | 18.8 | +18.8 | |
Total formal votes | 60,325 | 98.5 | |||
Informal votes | 909 | 1.5 | |||
Turnout | 61,234 | 94.6 | |||
Two-party-preferred result | |||||
Nationalist | Henry Gullett | 60.9 | −39.1 | ||
Labor | Edward Stewart | 39.1 | +39.1 | ||
Nationalist hold | Swing | -39.1 | |||
Party | Candidate | Votes | % | ±% | |
---|---|---|---|---|---|
Nationalist | Frederick Francis | 10,794 | 38.1 | +39.4 | |
Labor | Roy Beardsworth | 5,615 | 19.8 | −3.0 | |
Liberal | Henry Gullett | 5,082 | 18.0 | +18.0 | |
Liberal | Eleanor Glencross | 3,551 | 12.5 | +12.5 | |
Nationalist | James Boyd | 3,269 | 11.5 | +11.5 | |
Total formal votes | 28,311 | 94.8 | |||
Informal votes | 1,545 | 5.2 | |||
Turnout | 29,856 | 63.0 | |||
Two-party-preferred result | |||||
Nationalist | Frederick Francis | 15,811 | 55.8 | +8.7 | |
Liberal | Henry Gullett | 12,500 | 44.2 | +44.2 | |
Nationalist gain from Independent | Swing | +8.7 | |||
Party | Candidate | Votes | % | ±% | |
---|---|---|---|---|---|
Nationalist | James Boyd | 17,293 | 40.8 | −29.8 | |
Ind. Nationalist | Frederick Francis | 12,382 | 29.2 | +29.2 | |
Labor | Norman Grant | 9,582 | 22.6 | −6.8 | |
Ind. Nationalist | Edwin Purbrick | 3,097 | 7.3 | +7.3 | |
Total formal votes | 42,354 | 95.8 | |||
Informal votes | 1,864 | 4.2 | |||
Turnout | 44,218 | 74.7 | |||
Two-party-preferred result | |||||
Independent | Frederick Francis | 22,396 | 52.9 | +52.9 | |
Nationalist | James Boyd | 19,958 | 47.1 | −23.2 | |
Independent gain from Nationalist | Swing | +23.2 | |||
Party | Candidate | Votes | % | ±% | |
---|---|---|---|---|---|
Nationalist | James Boyd | 30,119 | 70.6 | +17.8 | |
Labor | William Smith | 12,526 | 29.4 | −8.1 | |
Total formal votes | 42,645 | 97.9 | |||
Informal votes | 908 | 2.1 | |||
Turnout | 43,553 | 81.6 | |||
Nationalist hold | Swing | +12.9 | |||
Party | Candidate | Votes | % | ±% | |
---|---|---|---|---|---|
Liberal | James Boyd | 17,742 | 42.8 | −13.5 | |
Labor | Albert Andrews | 12,607 | 37.5 | +5.3 | |
Independent | Richard Crouch | 3,238 | 9.6 | +9.6 | |
Total formal votes | 33,587 | 97.8 | |||
Informal votes | 753 | 2.2 | |||
Turnout | 34,340 | 74.7 | |||
Liberal hold | Swing | -9.4 | |||
Party | Candidate | Votes | % | ±% | |
---|---|---|---|---|---|
Liberal | James Boyd | 19,138 | 66.3 | +4.6 | |
Labor | William Miles | 9,284 | 32.2 | +7.9 | |
Independent Liberal | Joseph Hewison | 446 | 1.5 | +1.5 | |
Total formal votes | 28,868 | 97.4 | |||
Informal votes | 769 | 2.6 | |||
Turnout | 29,637 | 71.5 | |||
Liberal notional hold | Swing | -1.6 | |||
The Division of Higgins is an Australian Electoral Division in Victoria for the Australian House of Representatives. The division covers 41 km2 (16 sq mi) in Melbourne's inner south-eastern suburbs. The main suburbs include Armadale, Ashburton, Carnegie, Glen Iris, Kooyong, Malvern, Malvern East, Murrumbeena, Prahran and Toorak; along with parts of Camberwell, Ormond and South Yarra. Though historically a safe conservative seat, Higgins was won by the Liberal Party by a margin of just 3.9 percent over the Labor Party at the 2019 election, the closest result in the seat’s history. It then flipped to Labor in the 2022 election.
Electorates of the Australian House of Representatives are single member electoral districts for the lower house of the Parliament of the Commonwealth. There are currently 151 electorates.
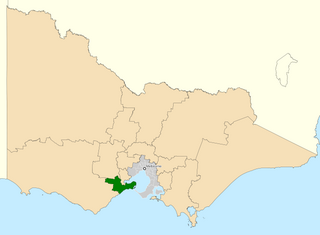
The Division of Corangamite is an Australian electoral division in the state of Victoria. The division was proclaimed in 1900, and was one of the original 65 divisions to be contested at the first federal election. It is named for Lake Corangamite, although the lake no longer falls within the division's boundaries.
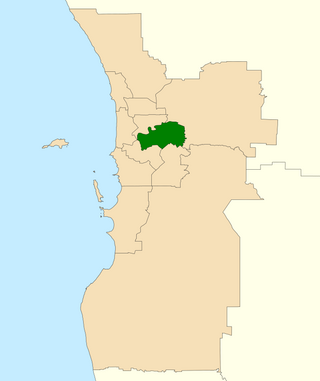
The Division of Swan is an Australian electoral division located in Western Australia.
The Division of Ballarat is an Australian electoral division in the state of Victoria. The division was proclaimed in 1900, and was one of the original 65 divisions to be contested at the first federal election. It was named for the provincial city of the same name by Scottish squatter Archibald Yuille, who established the first settlement − his sheep run called Ballaarat − in 1837, with the name derived from a local Wathawurrung word for the area, balla arat, thought to mean "resting place".
The Division of Batman was an Australian Electoral Division in the state of Victoria. It took its name from John Batman, one of the founders of the city of Melbourne. The division was created in 1906, replacing the Division of Northern Melbourne, and was abolished in 2019 and replaced by the Division of Cooper.
The Division of Bendigo is an Australian electoral division in the state of Victoria. The division was proclaimed in 1900, and was one of the original 65 divisions to be contested at the first federal election. It is named for the city of Bendigo.
The Division of Dunkley is an Australian electoral division in the state of Victoria. The division is located south-east of Melbourne on the Mornington Peninsula. It covers an area of approximately 152 square kilometres (59 sq mi) from Seaford in the north to Mount Eliza in the south and Langwarrin South in the southeast. Following the 2024 Dunkley by-election, Jodie Belyea currently represents the seat.
The Division of Braddon is an Australian electoral division in the state of Tasmania. The current MP is Gavin Pearce of the Liberal Party, who was elected at the 2019 federal election.
The Division of Macquarie is an Australian electoral division in the state of New South Wales. The division was created in 1900 and was one of the original 65 divisions contested at the first federal election. It is named for Lachlan Macquarie, who was Governor of New South Wales between 1810 and 1821.
The Division of Maranoa is an Australian electoral division in Queensland.
The Division of Petrie is an Australian Electoral Division in Queensland.
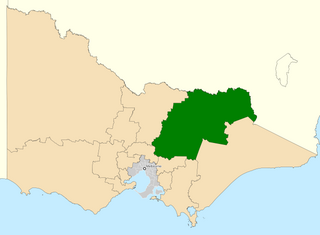
The Division of Indi is an Australian electoral division in the state of Victoria. The division is located in the north-east of the state, adjoining the border with New South Wales. The largest settlements in the division are the regional cities of Wodonga, Wangaratta, and Benalla. Other towns in the electorate include Rutherglen, Mansfield, Beechworth, Myrtleford, Bright, Alexandra, Tallangatta, Corryong and a number of other small villages. While Indi is one of the largest electorates in Victoria, much of it is located within the largely uninhabited Australian Alps. While Wodonga serves as a regional hub for much of the more heavily populated northern part of the electorate, the southern part is closer to Melbourne than Wodonga.
The Division of Parramatta is an Australian electoral division in the state of New South Wales. The division was created in 1900 and was one of the original 65 divisions contested at the first federal election. It is named for the locality of Parramatta. The name Parramatta has been sourced to an Aboriginal word for the area. The Darug people had lived in the area for many generations, and regarded the area as a food bowl, rich in food from the river and forests. They called the area Baramada or Burramatta ("Parramatta") which means "the place where the eels lie down".
The Division of Parkes is an Australian electoral division in the state of New South Wales.
The Division of Page is an Australian electoral division in the state of New South Wales.
In Australia, a redistribution is the process of redrawing the boundaries of electoral divisions for the House of Representatives arising from changes in population and changes in the number of representatives. There is no redistribution for the Senate as each State constitutes a division, though with multiple members. The Australian Electoral Commission (AEC), an independent statutory authority, oversees the apportionment and redistribution process for federal divisions, taking into account a number of factors. Politicians, political parties and the public may make submissions to the AEC on proposed new boundaries, but any interference with their deliberations is considered a serious offence.
The Division of Flynn is an Australian Electoral Division in Queensland.
The 2019 Australian federal election was held on Saturday 18 May 2019 to elect members of the 46th Parliament of Australia. The election had been called following the dissolution of the 45th Parliament as elected at the 2016 double dissolution federal election. All 151 seats in the House of Representatives and 40 of the 76 seats in the Senate were up for election.
The Division of Monash is an Australian Electoral Division in the state of Victoria, which was contested for the first time at the 2019 federal election.