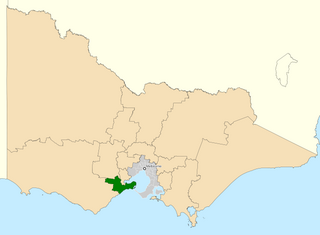
This is a list of electoral results for the Division of Corangamite in Australian federal elections from the division's creation in 1901 until the present.
Member | Party | Term | |
---|---|---|---|
Chester Manifold | Protectionist | 1901–1903 | |
John Gratton Wilson | Free Trade/Anti-Socialist | 1903–1909 | |
Liberal | 1909–1910 | ||
James Scullin | Labor | 1910–1913 | |
Chester Manifold | Liberal | 1913–1917 | |
Nationalist | 1917–1918 | ||
William Gibson | Victorian Farmers' Union/Country | 1918–1929 | |
Richard Crouch | Labor | 1929–1931 | |
William Gibson | Country | 1931–1934 | |
Geoffrey Street | United Australia | 1934–1940 | |
Allan McDonald | United Australia | 1940–1945 | |
Liberal | 1945–1953 | ||
Dan Mackinnon | Liberal | 1953–1966 | |
Tony Street | Liberal | 1966–1984 | |
Stewart McArthur | Liberal | 1984–2007 | |
Darren Cheeseman | Labor | 2007–2013 | |
Sarah Henderson | Liberal | 2013–2019 | |
Libby Coker | Labor | 2019–present |
Party | Candidate | Votes | % | ±% | |
---|---|---|---|---|---|
Labor | Libby Coker | 38,573 | 38.20 | +2.41 | |
Liberal | Stephanie Asher | 34,463 | 34.13 | −8.26 | |
Greens | Alex Marshall | 15,349 | 15.20 | +6.49 | |
United Australia | Daniel Abou-Zeid | 3,233 | 3.20 | +1.02 | |
One Nation | Luke Sorensen | 2,548 | 2.52 | +2.52 | |
Liberal Democrats | Paul Barker | 2,526 | 2.50 | +2.50 | |
Animal Justice | Meg Watkins | 1,986 | 1.97 | −0.17 | |
Justice | Jean-Marie D'Argent | 1,421 | 1.41 | −1.22 | |
Australian Federation | Stephen Juhasz | 868 | 0.86 | +0.86 | |
Total formal votes | 100,967 | 96.11 | +0.06 | ||
Informal votes | 4,088 | 3.89 | −0.06 | ||
Turnout | 105,055 | 93.26 | +1.01 | ||
Two-party-preferred result | |||||
Labor | Libby Coker | 58,160 | 57.60 | +6.55 | |
Liberal | Stephanie Asher | 42,807 | 42.40 | −6.55 | |
Labor hold | Swing | +6.55 |
Party | Candidate | Votes | % | ±% | |
---|---|---|---|---|---|
Liberal | Sarah Henderson | 43,017 | 42.33 | −1.34 | |
Labor | Libby Coker | 36,047 | 35.47 | +1.41 | |
Greens | Simon Northeast | 9,184 | 9.04 | −3.05 | |
Independent | Damien Cole | 5,131 | 5.05 | +5.05 | |
Justice | Mandy Grimley | 2,724 | 2.68 | +0.41 | |
United Australia | Neil Harvey | 2,257 | 2.22 | +2.22 | |
Animal Justice | Naomi Adams | 2,143 | 2.11 | −0.13 | |
Rise Up Australia | Ian Erskine | 1,117 | 1.10 | −0.07 | |
Total formal votes | 101,620 | 96.03 | +0.73 | ||
Informal votes | 4,196 | 3.97 | −0.73 | ||
Turnout | 105,816 | 94.82 | +3.83 | ||
Two-party-preferred result | |||||
Labor | Libby Coker | 51,895 | 51.07 | +1.04 | |
Liberal | Sarah Henderson | 49,725 | 48.93 | −1.04 | |
Labor notional hold | Swing | +1.04 |
Party | Candidate | Votes | % | ±% | |
---|---|---|---|---|---|
Liberal | Sarah Henderson | 45,687 | 46.42 | −1.83 | |
Labor | Libby Coker | 30,267 | 30.75 | −1.28 | |
Greens | Patchouli Paterson | 11,273 | 11.45 | −0.41 | |
Justice | Patrice Nelson | 3,039 | 3.09 | +3.09 | |
Family First | Alan Barron | 1,906 | 1.94 | +0.96 | |
Animal Justice | Andy Meddick | 1,739 | 1.77 | +1.77 | |
Independent | Michael Lawrence | 1,519 | 1.54 | +1.54 | |
Drug Law Reform | Courtney Dalton | 1,269 | 1.29 | +1.29 | |
Liberal Democrats | Louis Rowe | 871 | 0.89 | +0.89 | |
Rise Up Australia | Nick Steel | 847 | 0.86 | +0.57 | |
Total formal votes | 98,417 | 95.00 | −0.57 | ||
Informal votes | 5,181 | 5.00 | +0.57 | ||
Turnout | 103,598 | 93.94 | −1.60 | ||
Two-party-preferred result | |||||
Liberal | Sarah Henderson | 52,291 | 53.13 | −0.81 | |
Labor | Libby Coker | 46,126 | 46.87 | +0.81 | |
Liberal hold | Swing | −0.81 |
Party | Candidate | Votes | % | ±% | |
---|---|---|---|---|---|
Liberal | Sarah Henderson | 44,778 | 48.25 | +3.15 | |
Labor | Darren Cheeseman | 29,728 | 32.03 | −7.29 | |
Greens | Lloyd Davies | 11,007 | 11.86 | +0.34 | |
Palmer United | Buddy Rojek | 2,026 | 2.18 | +2.18 | |
Sex Party | Jayden Millard | 1,726 | 1.86 | +1.86 | |
Family First | Peter Wray | 908 | 0.98 | −0.99 | |
Independent | Adrian Whitehead | 694 | 0.75 | +0.75 | |
National | Andrew Black | 598 | 0.64 | +0.64 | |
Christians | Alan Barron | 499 | 0.54 | +0.54 | |
Country Alliance | Warren Jackman | 408 | 0.44 | +0.44 | |
Rise Up Australia | Helen Rashleigh | 273 | 0.29 | +0.29 | |
Protectionist | Nick Steel | 156 | 0.17 | +0.17 | |
Total formal votes | 92,801 | 95.57 | −1.24 | ||
Informal votes | 4,304 | 4.43 | +1.24 | ||
Turnout | 97,105 | 95.46 | +0.56 | ||
Two-party-preferred result | |||||
Liberal | Sarah Henderson | 50,057 | 53.94 | +4.22 | |
Labor | Darren Cheeseman | 42,744 | 46.06 | −4.22 | |
Liberal gain from Labor | Swing | +4.22 |
Party | Candidate | Votes | % | ±% | |
---|---|---|---|---|---|
Liberal | Sarah Henderson | 42,155 | 44.99 | +0.29 | |
Labor | Darren Cheeseman | 37,043 | 39.53 | −2.38 | |
Greens | Mike Lawrence | 10,713 | 11.43 | +3.46 | |
Family First | Ann Wojczuk | 1,850 | 1.97 | −1.59 | |
Independent | Sally-Anne Brown | 1,418 | 1.51 | +1.51 | |
Liberal Democrats | Nathan Timmins | 520 | 0.55 | +0.36 | |
Total formal votes | 93,699 | 96.78 | −0.69 | ||
Informal votes | 3,117 | 3.22 | +0.69 | ||
Turnout | 96,816 | 95.32 | −1.15 | ||
Two-party-preferred result | |||||
Labor | Darren Cheeseman | 47,235 | 50.41 | −0.44 | |
Liberal | Sarah Henderson | 46,464 | 49.59 | +0.44 | |
Labor hold | Swing | −0.44 |
Party | Candidate | Votes | % | ±% | |
---|---|---|---|---|---|
Liberal | Stewart McArthur | 40,408 | 44.70 | −7.35 | |
Labor | Darren Cheeseman | 37,886 | 41.91 | +5.16 | |
Greens | Fiona Nelson | 7,202 | 7.97 | +0.46 | |
Family First | Jan Edwards | 3,217 | 3.56 | +0.82 | |
Democrats | Gabrielle Killeen | 1,512 | 1.67 | +1.67 | |
Liberty & Democracy | Sukrit Sabhlok | 169 | 0.19 | +0.19 | |
Total formal votes | 90,394 | 97.47 | +0.51 | ||
Informal votes | 2,347 | 2.53 | −0.51 | ||
Turnout | 92,741 | 96.45 | +0.39 | ||
Two-party-preferred result | |||||
Labor | Darren Cheeseman | 45,968 | 50.85 | +6.17 | |
Liberal | Stewart McArthur | 44,426 | 49.15 | −6.17 | |
Labor gain from Liberal | Swing | +6.17 | |||
Party | Candidate | Votes | % | ±% | |
---|---|---|---|---|---|
Liberal | Stewart McArthur | 44,060 | 52.05 | +4.89 | |
Labor | Peter McMullin | 31,105 | 36.75 | +3.20 | |
Greens | Stephen Chenery | 6,355 | 7.51 | +1.19 | |
Family First | Christine Modra | 2,318 | 2.74 | +2.74 | |
Socialist Alliance | Chris Johnson | 491 | 0.58 | +0.58 | |
Citizens Electoral Council | Andrew Bailey | 313 | 0.37 | +0.37 | |
Total formal votes | 84,642 | 96.96 | +0.37 | ||
Informal votes | 2,652 | 3.04 | −0.37 | ||
Turnout | 87,294 | 96.06 | −0.18 | ||
Two-party-preferred result | |||||
Liberal | Stewart McArthur | 46,828 | 55.32 | −0.05 | |
Labor | Peter McMullin | 37,814 | 44.68 | +0.05 | |
Liberal hold | Swing | −0.05 | |||
Party | Candidate | Votes | % | ±% | |
---|---|---|---|---|---|
Liberal | Stewart McArthur | 37,929 | 47.42 | +1.40 | |
Labor | Michael Bjork-Billings | 26,569 | 33.21 | −2.87 | |
Democrats | Robyn Hodge | 5,128 | 6.41 | +0.02 | |
Greens | Iain Lygo | 5,098 | 6.37 | +3.30 | |
One Nation | Graham Hills | 1,982 | 2.48 | −3.07 | |
Liberals for Forests | Nigel Strauss | 1,960 | 2.45 | +2.45 | |
Independent | Simon Arundell | 1,326 | 1.66 | −0.53 | |
Total formal votes | 79,992 | 96.62 | −0.83 | ||
Informal votes | 2,798 | 3.38 | +0.83 | ||
Turnout | 82,790 | 96.86 | |||
Two-party-preferred result | |||||
Liberal | Stewart McArthur | 44,529 | 55.67 | +1.17 | |
Labor | Michael Bjork-Billings | 35,463 | 44.33 | −1.17 | |
Liberal hold | Swing | +1.17 | |||
Party | Candidate | Votes | % | ±% | |
---|---|---|---|---|---|
Liberal | Stewart McArthur | 34,336 | 46.02 | −6.64 | |
Labor | Michael Bjork-Billings | 26,923 | 36.08 | +0.22 | |
Democrats | Jeffrey Paull | 4,765 | 6.39 | −5.10 | |
One Nation | Duncan Maclean | 4,140 | 5.55 | +5.55 | |
Greens | Adrian Whitehead | 2,292 | 3.07 | +3.07 | |
Independent | Simon Arundell | 1,634 | 2.19 | +2.19 | |
Unity | Robert Harwood | 525 | 0.70 | +0.70 | |
Total formal votes | 74,615 | 97.45 | −0.33 | ||
Informal votes | 1,949 | 2.55 | +0.33 | ||
Turnout | 76,564 | 95.79 | −0.90 | ||
Two-party-preferred result | |||||
Liberal | Stewart McArthur | 40,665 | 54.50 | −3.19 | |
Labor | Michael Bjork-Billings | 33,950 | 45.50 | +3.19 | |
Liberal hold | Swing | −3.19 | |||
Party | Candidate | Votes | % | ±% | |
---|---|---|---|---|---|
Liberal | Stewart McArthur | 38,445 | 52.66 | +0.18 | |
Labor | Bernie Eades | 26,179 | 35.86 | −1.80 | |
Democrats | Pamela Johnson | 8,382 | 11.48 | +8.22 | |
Total formal votes | 73,006 | 97.78 | +0.22 | ||
Informal votes | 1,655 | 2.22 | −0.22 | ||
Turnout | 74,661 | 96.70 | −0.08 | ||
Two-party-preferred result | |||||
Liberal | Stewart McArthur | 41,939 | 57.69 | +1.73 | |
Labor | Bernie Eades | 30,761 | 42.31 | −1.73 | |
Liberal hold | Swing | +1.73 | |||
Party | Candidate | Votes | % | ±% | |
---|---|---|---|---|---|
Liberal | Stewart McArthur | 38,133 | 53.40 | −0.82 | |
Labor | Bernie Eades | 26,199 | 36.69 | +6.12 | |
Democrats | Greta Pearce | 2,208 | 3.09 | −7.90 | |
Independent | Norm Powell | 2,203 | 3.09 | +3.09 | |
Independent | John Warnock | 1,231 | 1.72 | +1.72 | |
Call to Australia | Terry Winter | 866 | 1.21 | −2.19 | |
Natural Law | Isaac Golden | 567 | 0.79 | +0.79 | |
Total formal votes | 71,407 | 97.54 | −0.14 | ||
Informal votes | 1,798 | 2.46 | +0.14 | ||
Turnout | 73,205 | 96.77 | |||
Two-party-preferred result | |||||
Liberal | Stewart McArthur | 40,655 | 56.97 | −3.82 | |
Labor | Bernie Eades | 30,701 | 43.03 | +3.82 | |
Liberal hold | Swing | −3.82 | |||
Party | Candidate | Votes | % | ±% | |
---|---|---|---|---|---|
Liberal | Stewart McArthur | 36,516 | 54.2 | +4.8 | |
Labor | Ian Caldwell | 20,582 | 30.6 | −9.5 | |
Democrats | Rob Mann | 7,399 | 11.0 | +4.7 | |
Call to Australia | John Andrews | 2,293 | 3.4 | +3.4 | |
Independent | Bruce Wilson | 549 | 0.8 | +0.8 | |
Total formal votes | 67,339 | 97.7 | |||
Informal votes | 1,595 | 2.3 | |||
Turnout | 68,934 | 96.4 | |||
Two-party-preferred result | |||||
Liberal | Stewart McArthur | 40,867 | 60.8 | +5.1 | |
Labor | Ian Caldwell | 26,356 | 39.2 | −5.1 | |
Liberal hold | Swing | +5.1 | |||
Party | Candidate | Votes | % | ±% | |
---|---|---|---|---|---|
Liberal | Stewart McArthur | 32,341 | 48.3 | +0.4 | |
Labor | Ian Caldwell | 27,620 | 41.2 | −0.7 | |
Democrats | Rob Mann | 4,225 | 6.3 | +2.8 | |
National | John McDonald | 2,813 | 4.2 | +0.9 | |
Total formal votes | 66,999 | 96.4 | |||
Informal votes | 2,504 | 3.6 | |||
Turnout | 69,503 | 95.9 | |||
Two-party-preferred result | |||||
Liberal | Stewart McArthur | 36,572 | 54.6 | +1.2 | |
Labor | Ian Caldwell | 30,411 | 45.4 | −1.2 | |
Liberal hold | Swing | +1.2 | |||
Party | Candidate | Votes | % | ±% | |
---|---|---|---|---|---|
Liberal | Stewart McArthur | 29,487 | 47.9 | −5.9 | |
Labor | Gavan O'Connor | 25,772 | 41.9 | −4.3 | |
Democrats | Robert Mann | 2,178 | 3.5 | +3.5 | |
National | Bruce Webster | 2,028 | 3.3 | +3.3 | |
Democratic Labor | James Jordan | 1,559 | 2.5 | +2.5 | |
Pensioner | Roy Charles | 552 | 0.9 | +0.9 | |
Total formal votes | 61,576 | 94.1 | |||
Informal votes | 3,846 | 5.9 | |||
Turnout | 65,422 | 97.0 | |||
Two-party-preferred result | |||||
Liberal | Stewart McArthur | 32,886 | 53.4 | −0.4 | |
Labor | Gavan O'Connor | 28,660 | 46.6 | +0.4 | |
Liberal hold | Swing | −0.4 | |||
Party | Candidate | Votes | % | ±% | |
---|---|---|---|---|---|
Liberal | Stewart McArthur | 32,083 | 46.7 | −11.5 | |
Labor | Gavan O'Connor | 25,517 | 37.1 | −4.7 | |
National | David Seymour | 9,794 | 14.2 | +14.2 | |
Democratic Labor | Joseph Lam | 1,336 | 1.9 | +1.9 | |
Total formal votes | 68,730 | 98.4 | |||
Informal votes | 1,096 | 1.6 | |||
Turnout | 69,826 | 92.4 | |||
Two-party-preferred result | |||||
Liberal | Stewart McArthur | 40,837 | 59.4 | +1.2 | |
Labor | Gavan O'Connor | 27,893 | 40.6 | −1.2 | |
Liberal hold | Swing | +1.2 |
Party | Candidate | Votes | % | ±% | |
---|---|---|---|---|---|
Liberal | Tony Street | 40,694 | 58.2 | +1.6 | |
Labor | Gavan O'Connor | 29,231 | 41.8 | +10.5 | |
Total formal votes | 69,925 | 98.3 | |||
Informal votes | 1,190 | 1.7 | |||
Turnout | 71,115 | 97.2 | |||
Liberal hold | Swing | −4.6 | |||
Party | Candidate | Votes | % | ±% | |
---|---|---|---|---|---|
Liberal | Tony Street | 37,913 | 56.6 | −1.9 | |
Labor | Neil Gedge | 20,959 | 31.3 | +4.9 | |
Democrats | Kathleen May | 5,031 | 7.5 | −2.4 | |
Democratic Labor | Bernie Finn | 3,043 | 4.5 | +0.2 | |
Total formal votes | 66,946 | 98.3 | |||
Informal votes | 1,164 | 1.7 | |||
Turnout | 68,110 | 96.4 | |||
Two-party-preferred result | |||||
Liberal | Tony Street | 62.8 | −5.0 | ||
Labor | Neil Gedge | 37.2 | +5.0 | ||
Liberal hold | Swing | −5.0 | |||
Party | Candidate | Votes | % | ±% | |
---|---|---|---|---|---|
Liberal | Tony Street | 37,163 | 58.5 | −5.3 | |
Labor | Shirley Ambrose | 16,786 | 26.4 | −4.4 | |
Democrats | Kathleen May | 6,275 | 9.9 | +9.9 | |
Democratic Labor | Francis O'Brien | 2,756 | 4.3 | +0.3 | |
Independent | Neil McDonald | 548 | 0.9 | +0.9 | |
Total formal votes | 63,528 | 98.3 | |||
Informal votes | 1,101 | 1.7 | |||
Turnout | 64,629 | 97.7 | |||
Two-party-preferred result | |||||
Liberal | Tony Street | 67.8 | −0.2 | ||
Labor | Shirley Ambrose | 32.2 | +0.2 | ||
Liberal hold | Swing | −0.2 | |||
Party | Candidate | Votes | % | ±% | |
---|---|---|---|---|---|
Liberal | Tony Street | 38,253 | 65.0 | +6.6 | |
Labor | Shirley Ambrose | 17,433 | 29.6 | −4.6 | |
Democratic Labor | Francis O'Brien | 2,360 | 4.0 | −1.4 | |
Australia | Ian Slater | 538 | 0.9 | −1.1 | |
Independent | Brian Costin | 305 | 0.5 | +0.5 | |
Total formal votes | 58,889 | 98.7 | |||
Informal votes | 800 | 1.3 | |||
Turnout | 59,689 | 97.5 | |||
Two-party-preferred result | |||||
Liberal | Tony Street | 69.2 | +5.7 | ||
Labor | Shirley Ambrose | 30.8 | −5.7 | ||
Liberal hold | Swing | +5.7 | |||
Party | Candidate | Votes | % | ±% | |
---|---|---|---|---|---|
Liberal | Tony Street | 32,960 | 58.4 | +5.0 | |
Labor | Edwin Morris | 19,280 | 34.2 | −3.2 | |
Democratic Labor | Francis O'Brien | 3,076 | 5.4 | −3.8 | |
Australia | Ian Slater | 1,126 | 2.0 | +2.0 | |
Total formal votes | 56,442 | 98.6 | |||
Informal votes | 792 | 1.4 | |||
Turnout | 57,234 | 96.6 | |||
Two-party-preferred result | |||||
Liberal | Tony Street | 63.5 | +1.8 | ||
Labor | Edwin Morris | 36.5 | −1.8 | ||
Liberal hold | Swing | +1.8 | |||
Party | Candidate | Votes | % | ±% | |
---|---|---|---|---|---|
Liberal | Tony Street | 26,769 | 53.4 | −2.2 | |
Labor | Edwin Morris | 18,729 | 37.4 | +4.2 | |
Democratic Labor | Francis O'Brien | 4,594 | 9.2 | −2.0 | |
Total formal votes | 50,092 | 99.0 | |||
Informal votes | 530 | 1.0 | |||
Turnout | 50,622 | 97.6 | |||
Two-party-preferred result | |||||
Liberal | Tony Street | 61.7 | −2.9 | ||
Labor | Edwin Morris | 38.3 | +2.9 | ||
Liberal hold | Swing | −2.9 | |||
Party | Candidate | Votes | % | ±% | |
---|---|---|---|---|---|
Liberal | Tony Street | 25,900 | 55.6 | +6.6 | |
Labor | Neil Moorfoot | 15,447 | 33.2 | +7.4 | |
Democratic Labor | Francis O'Brien | 5,216 | 11.2 | −0.8 | |
Total formal votes | 46,563 | 98.4 | |||
Informal votes | 770 | 1.6 | |||
Turnout | 47,333 | 97.2 | |||
Two-party-preferred result | |||||
Liberal | Tony Street | 64.6 | −9.0 | ||
Labor | Neil Moorfoot | 35.4 | +9.0 | ||
Liberal hold | Swing | −9.0 | |||
Party | Candidate | Votes | % | ±% | |
---|---|---|---|---|---|
Liberal | Tony Street | 22,334 | 47.6 | −9.9 | |
Labor | Lindsay Romey | 11,419 | 24.3 | −4.8 | |
Country | Gilbert Anderson | 7,585 | 16.1 | +16.1 | |
Democratic Labor | Brian Cronin | 5,634 | 12.0 | −1.4 | |
Total formal votes | 46,972 | 97.6 | |||
Informal votes | 1,160 | 2.4 | |||
Turnout | 48,132 | 97.2 | |||
Two-party-preferred result | |||||
Liberal | Tony Street | 72.1 | +2.5 | ||
Labor | Lindsay Romey | 27.9 | −2.5 | ||
Liberal hold | Swing | +2.5 | |||
Party | Candidate | Votes | % | ±% | |
---|---|---|---|---|---|
Liberal | Dan Mackinnon | 26,347 | 57.5 | +4.7 | |
Labor | Fred Black | 13,324 | 29.1 | +0.1 | |
Democratic Labor | Francis O'Brien | 6,139 | 13.4 | −4.8 | |
Total formal votes | 45,810 | 99.3 | |||
Informal votes | 335 | 0.7 | |||
Turnout | 46,145 | 97.5 | |||
Two-party-preferred result | |||||
Liberal | Dan Mackinnon | 69.6 | +1.3 | ||
Labor | Fred Black | 30.4 | −1.3 | ||
Liberal hold | Swing | +1.3 | |||
Party | Candidate | Votes | % | ±% | |
---|---|---|---|---|---|
Liberal | Dan Mackinnon | 23,319 | 52.8 | −1.0 | |
Labor | Desmond Hulme | 12,829 | 29.0 | +2.3 | |
Democratic Labor | Patrick Bourke | 8,032 | 18.2 | +0.4 | |
Total formal votes | 44,180 | 98.5 | |||
Informal votes | 668 | 1.5 | |||
Turnout | 44,848 | 96.9 | |||
Two-party-preferred result | |||||
Liberal | Dan Mackinnon | 68.3 | −2.4 | ||
Labor | Desmond Hulme | 31.7 | +2.4 | ||
Liberal hold | Swing | −2.4 | |||
Party | Candidate | Votes | % | ±% | |
---|---|---|---|---|---|
Liberal | Dan Mackinnon | 22,724 | 53.8 | −7.0 | |
Labor | Edwin Morris | 11,299 | 26.7 | +0.6 | |
Democratic Labor | Patrick Bourke | 7,526 | 17.8 | +4.8 | |
Independent | Elsie Brushfield | 728 | 1.7 | +1.7 | |
Total formal votes | 42,277 | 98.1 | |||
Informal votes | 824 | 1.9 | |||
Turnout | 43,101 | 96.6 | |||
Two-party-preferred result | |||||
Liberal | Dan Mackinnon | 70.7 | −0.5 | ||
Labor | Edwin Morris | 29.3 | +0.5 | ||
Liberal hold | Swing | −0.5 | |||
Party | Candidate | Votes | % | ±% | |
---|---|---|---|---|---|
Liberal | Dan Mackinnon | 24,349 | 60.8 | +2.3 | |
Labor | Edwin Morris | 10,463 | 26.1 | −15.4 | |
Labor (A-C) | Leo O'Brien | 5,210 | 13.0 | +13.0 | |
Total formal votes | 40,022 | 98.0 | |||
Informal votes | 809 | 2.0 | |||
Turnout | 40,831 | 96.1 | |||
Two-party-preferred result | |||||
Liberal | Dan Mackinnon | 71.2 | +12.7 | ||
Labor | Edwin Morris | 28.8 | −12.7 | ||
Liberal hold | Swing | +12.7 | |||
Party | Candidate | Votes | % | ±% | |
---|---|---|---|---|---|
Liberal | Dan Mackinnon | 22,253 | 57.6 | −1.1 | |
Labor | Angus McLean | 16,407 | 42.4 | +1.1 | |
Total formal votes | 38,660 | 99.4 | |||
Informal votes | 244 | 0.6 | |||
Turnout | 38,904 | 97.2 | |||
Liberal hold | Swing | −1.1 | |||
Party | Candidate | Votes | % | ±% | |
---|---|---|---|---|---|
Liberal | Allan McDonald | 22,087 | 58.7 | +1.2 | |
Labor | Angus McLean | 15,535 | 41.3 | +1.7 | |
Total formal votes | 37,622 | 99.1 | |||
Informal votes | 357 | 0.9 | |||
Turnout | 37,979 | 97.0 | |||
Liberal hold | Swing | −1.3 | |||
Party | Candidate | Votes | % | ±% | |
---|---|---|---|---|---|
Liberal | Allan McDonald | 21,670 | 57.5 | +1.1 | |
Labor | Henry Stacpoole | 14,936 | 39.6 | −3.9 | |
Independent | Elsie Brushfield | 1,080 | 2.9 | +2.9 | |
Total formal votes | 37,686 | 99.2 | |||
Informal votes | 286 | 0.8 | |||
Turnout | 37,972 | 97.0 | |||
Two-party-preferred result | |||||
Liberal | Allan McDonald | 60.0 | +3.6 | ||
Labor | Henry Stacpoole | 40.0 | −3.6 | ||
Liberal hold | Swing | +3.6 | |||
Party | Candidate | Votes | % | ±% | |
---|---|---|---|---|---|
Liberal | Allan McDonald | 25,999 | 54.9 | +7.7 | |
Labor | Henry Stacpoole | 21,317 | 45.1 | +0.0 | |
Total formal votes | 47,316 | 99.2 | |||
Informal votes | 393 | 0.8 | |||
Turnout | 47,709 | 94.7 | |||
Liberal hold | Swing | +1.8 | |||
Party | Candidate | Votes | % | ±% | |
---|---|---|---|---|---|
United Australia | Allan McDonald | 21,655 | 47.2 | −9.0 | |
Labor | Harold Miller | 20,691 | 45.1 | +1.3 | |
Independent | Elsie Brushfield | 1,856 | 4.0 | +4.0 | |
Independent Country | Sydney Donaldson | 1,643 | 3.6 | +3.6 | |
Total formal votes | 45,845 | 98.9 | |||
Informal votes | 515 | 1.1 | |||
Turnout | 46,360 | 96.6 | |||
Two-party-preferred result | |||||
United Australia | Allan McDonald | 24,342 | 53.1 | −3.1 | |
Labor | Harold Miller | 21,503 | 46.9 | +3.1 | |
United Australia hold | Swing | +3.1 | |||
Party | Candidate | Votes | % | ±% | |
---|---|---|---|---|---|
United Australia | Allan McDonald | 26,665 | 56.2 | +2.3 | |
Labor | Harold Miller | 20,801 | 43.8 | −2.3 | |
Total formal votes | 47,466 | 99.2 | |||
Informal votes | 371 | 0.8 | |||
Turnout | 47,837 | 95.7 | |||
United Australia hold | Swing | +2.3 | |||
Party | Candidate | Votes | % | ±% | |
---|---|---|---|---|---|
United Australia | Geoffrey Street | 25,788 | 53.9 | +13.8 | |
Labor | Arthur Haywood | 22,096 | 46.1 | +9.3 | |
Total formal votes | 47,884 | 99.0 | |||
Informal votes | 494 | 1.0 | |||
Turnout | 48,378 | 96.5 | |||
United Australia hold | Swing | −5.7 | |||
Party | Candidate | Votes | % | ±% | |
---|---|---|---|---|---|
United Australia | Geoffrey Street | 15,400 | 36.8 | +36.8 | |
Labor | Arthur Haywood | 15,222 | 36.4 | −0.7 | |
Country | Gordon McGregor | 5,217 | 12.5 | −40.0 | |
Country | Gordon Bristow | 4,334 | 10.4 | +10.4 | |
Independent | Bevis Walters | 1,676 | 4.0 | +4.0 | |
Total formal votes | 41,849 | 96.1 | |||
Informal votes | 1,687 | 3.9 | |||
Turnout | 43,536 | 95.0 | |||
Two-party-preferred result | |||||
United Australia | Geoffrey Street | 23,296 | 55.7 | +55.7 | |
Labor | Arthur Haywood | 18,553 | 44.3 | +7.2 | |
United Australia gain from Country | Swing | −7.2 | |||
Party | Candidate | Votes | % | ±% | |
---|---|---|---|---|---|
Country | William Gibson | 25,985 | 62.9 | +15.0 | |
Labor | Richard Crouch | 15,321 | 37.1 | −15.0 | |
Total formal votes | 41,306 | 98.7 | |||
Informal votes | 540 | 1.3 | |||
Turnout | 41,846 | 95.7 | |||
Country gain from Labor | Swing | +15.0 | |||
Party | Candidate | Votes | % | ±% | |
---|---|---|---|---|---|
Labor | Richard Crouch | 20,924 | 52.1 | +5.1 | |
Country | William Gibson | 19,244 | 47.9 | −5.1 | |
Total formal votes | 40,168 | 98.9 | |||
Informal votes | 461 | 1.1 | |||
Turnout | 40,629 | 95.3 | |||
Labor gain from Country | Swing | +5.1 | |||
Party | Candidate | Votes | % | ±% | |
---|---|---|---|---|---|
Country | William Gibson | 20,501 | 53.0 | −2.5 | |
Labor | Richard Crouch | 18,211 | 47.0 | +2.5 | |
Total formal votes | 38,712 | 97.6 | |||
Informal votes | 959 | 2.4 | |||
Turnout | 39,671 | 95.4 | |||
Country hold | Swing | −2.5 | |||
Party | Candidate | Votes | % | ±% | |
---|---|---|---|---|---|
Country | William Gibson | 21,557 | 55.5 | +27.0 | |
Labor | William Nicol | 17,297 | 44.5 | +0.0 | |
Total formal votes | 38,854 | 98.7 | |||
Informal votes | 502 | 1.3 | |||
Turnout | 39,356 | 92.2 | |||
Country hold | Swing | +1.6 | |||
Party | Candidate | Votes | % | ±% | |
---|---|---|---|---|---|
Labor | Richard Crouch | 10,788 | 44.5 | +5.0 | |
Country | William Gibson | 6,908 | 28.5 | −8.2 | |
Nationalist | Allan McDonald | 6,530 | 27.0 | +3.2 | |
Total formal votes | 24,226 | 97.2 | |||
Informal votes | 688 | 2.8 | |||
Turnout | 24,914 | 62.0 | |||
Two-party-preferred result | |||||
Country | William Gibson | 13,059 | 53.9 | −4.3 | |
Labor | Richard Crouch | 11,167 | 46.1 | +4.3 | |
Country hold | Swing | −4.3 | |||
Party | Candidate | Votes | % | ±% | |
---|---|---|---|---|---|
Labor | Edward Malone | 10,280 | 37.4 | −2.2 | |
Victorian Farmers | William Gibson | 8,632 | 31.4 | +31.4 | |
Nationalist | Allan McDonald | 8,563 | 31.2 | −29.2 | |
Total formal votes | 27,475 | 96.6 | |||
Informal votes | 969 | 3.4 | |||
Turnout | 28,444 | 80.3 | |||
Two-party-preferred result | |||||
Victorian Farmers | William Gibson | 16,864 | 61.4 | +61.4 | |
Labor | Edward Malone | 10,611 | 38.6 | −1.0 | |
Victorian Farmers hold | Swing | +1.0 | |||
Party | Candidate | Votes | % | ±% | |
---|---|---|---|---|---|
Labor | James Scullin | 10,630 | 42.5 | +2.9 | |
Victorian Farmers | William Gibson | 6,604 | 26.4 | +26.4 | |
Nationalist | George Knox | 5,737 | 22.9 | −37.5 | |
Ind. Nationalist | Russell Coldham | 1,174 | 4.7 | +4.7 | |
Returned Soldiers | Thomas Leaper | 895 | 3.6 | +3.6 | |
Total formal votes | 25,040 | 98.0 | |||
Informal votes | 516 | 2.0 | |||
Turnout | 25,553 | 73.2 | |||
Two-party-preferred result | |||||
Victorian Farmers | William Gibson | 14,096 | 56.3 | +56.3 | |
Labor | James Scullin | 10,944 | 43.7 | +4.1 | |
Victorian Farmers gain from Nationalist | Swing | -4.1 |
Party | Candidate | Votes | % | ±% | |
---|---|---|---|---|---|
Nationalist | Chester Manifold | 18,432 | 60.4 | +8.8 | |
Labor | Christopher Bennett | 12,067 | 39.6 | −8.8 | |
Total formal votes | 30,499 | 98.2 | |||
Informal votes | 562 | 1.8 | |||
Turnout | 31,061 | 84.6 | |||
Nationalist hold | Swing | +8.8 | |||
Party | Candidate | Votes | % | ±% | |
---|---|---|---|---|---|
Liberal | Chester Manifold | 16,575 | 51.6 | −0.6 | |
Labor | Thomas Burke | 15,535 | 48.4 | +0.6 | |
Total formal votes | 32,110 | 98.4 | |||
Informal votes | 530 | 1.6 | |||
Turnout | 32,640 | 85.8 | |||
Liberal hold | Swing | −0.6 | |||
Party | Candidate | Votes | % | ±% | |
---|---|---|---|---|---|
Liberal | Chester Manifold | 16,572 | 52.2 | +6.1 | |
Labor | James Scullin | 15,173 | 47.8 | −6.1 | |
Total formal votes | 31,745 | 99.1 | |||
Informal votes | 281 | 0.9 | |||
Turnout | 32,026 | 81.2 | |||
Liberal gain from Labor | Swing | +6.1 | |||
Party | Candidate | Votes | % | ±% | |
---|---|---|---|---|---|
Labour | James Scullin | 11,300 | 54.7 | +29.4 | |
Liberal | Gratton Wilson | 9,350 | 45.3 | −29.4 | |
Total formal votes | 20,650 | 98.2 | |||
Informal votes | 385 | 1.8 | |||
Turnout | 21,035 | 68.6 | |||
Labour gain from Liberal | Swing | +29.4 | |||
Party | Candidate | Votes | % | ±% | |
---|---|---|---|---|---|
Anti-Socialist | Gratton Wilson | 7,475 | 43.9 | +8.7 | |
Protectionist | Desmond Dunne | 5,237 | 30.8 | +8.1 | |
Labour | Thomas Carey | 4,306 | 25.3 | +25.3 | |
Total formal votes | 17,018 | 95.7 | |||
Informal votes | 765 | 4.3 | |||
Turnout | 17,783 | 61.3 | |||
Anti-Socialist hold | Swing | +4.4 | |||
Party | Candidate | Votes | % | ±% | |
---|---|---|---|---|---|
Free Trade | Gratton Wilson | 4,600 | 35.2 | +35.2 | |
Ind. Protectionist | Desmond Dunne | 4,036 | 30.8 | +30.8 | |
Protectionist | Agar Wynne | 2,968 | 22.7 | −49.5 | |
Ind. Protectionist | John Woods | 1,484 | 11.3 | −16.5 | |
Total formal votes | 13,088 | 99.0 | |||
Informal votes | 138 | 1.0 | |||
Turnout | 13,226 | 55.5 | |||
Free Trade gain from Protectionist | Swing | +35.2 | |||
Party | Candidate | Votes | % | ±% | |
---|---|---|---|---|---|
Protectionist | Chester Manifold | 3,886 | 72.2 | +72.2 | |
Ind. Protectionist | John Woods | 1,495 | 27.8 | +27.8 | |
Total formal votes | 5,381 | 99.4 | |||
Informal votes | 34 | 0.6 | |||
Turnout | 5,415 | 48.6 | |||
Protectionist win | (new seat) | ||||
The Division of Corangamite is an Australian electoral division in the state of Victoria. The division was proclaimed in 1900, and was one of the original 65 divisions to be contested at the first federal election. It is named for Lake Corangamite, although the lake no longer falls within the division's boundaries.
This is a list of electoral results for the Division of Aston in Australian federal elections from the division's creation in 1984 until the present.
This is a list of electoral results for the Division of Ballarat in Australian federal elections from the division's creation in 1901 until the present. The seat was known as Ballaarat from 1901 until 1977.
This is a list of electoral results for the Division of Batman in Australian federal elections from the division's creation in 1906 until its abolition in 2019. The Division was then renamed Cooper
This is a list of electoral results for the Division of Bendigo in Australian federal elections from the division's creation in 1901 until the present.
This is a list of electoral results for the Division of Bruce in Australian federal elections from the division's creation in 1955 until the present.
This is a list of electoral results for the Division of Casey in Australian federal elections from the division's creation in 1969 until the present.
This is a list of electoral results for the Division of Chisholm in Australian federal elections from the division's creation in 1949 until the present.
This is a list of electoral results for the Division of Dunkley in Australian federal elections from the division's creation in 1984 until the present.
This is a list of electoral results for the Division of Flinders in Australian federal elections from the division's creation in 1901 until the present.
This is a list of electoral results for the Division of Gellibrand in Australian federal elections from the division's creation in 1949 until the present.
This is a list of electoral results for the Division of Higgins in Australian federal elections from the division's creation in 1949 until the present.
This is a list of electoral results for the Division of Kooyong in Australian federal elections from the division's creation in 1901 until the present.
This is a list of electoral results for the Division of Lalor in Australian federal elections from the division's creation in 1949 until the present.
This is a list of electoral results for the Division of Mallee in Australian federal elections from the division's creation in 1949 until the present.
This is a list of electoral results for the Division of Melbourne in Australian federal elections from the division's creation in 1901 until the present.
This is a list of electoral results for the Division of Scullin in Australian federal elections from the division's creation in 1969 until the present.
This is a list of electoral results for the Division of Wannon in Australian federal elections from the division's creation in 1901 until the present.
This is a list of electoral results for the Division of Wills in Australian federal elections from the division's creation in 1949 until the present.
This is a list of electoral division results for the 2019 Australian federal election in the state of Victoria. Victoria bucked the national trend, seeing a swing from the Coalition to Labor, whereas the swing across Australia was from Labor to the Coalition.