This is a list of electoral division results for the Australian 1929 federal election.
Party | Candidate | Votes | % | ±% | |
---|---|---|---|---|---|
Labor | James Tully | 43,207 | 67.6 | +11.3 | |
Nationalist | William Myhill | 20,722 | 32.4 | −11.3 | |
Total formal votes | 63,929 | 97.5 | |||
Informal votes | 1,596 | 2.5 | |||
Turnout | 65,535 | 97.3 | |||
Labor hold | Swing | +11.3 | |||
Party | Candidate | Votes | % | ±% | |
---|---|---|---|---|---|
Labor | George Gibbons | 20,492 | 51.6 | +12.3 | |
Nationalist | Sir Neville Howse | 19,252 | 48.4 | −12.3 | |
Total formal votes | 39,744 | 96.7 | |||
Informal votes | 1,376 | 3.3 | |||
Turnout | 41,120 | 95.8 | |||
Labor gain from Nationalist | Swing | +12.3 | |||
Party | Candidate | Votes | % | ±% | |
---|---|---|---|---|---|
Labor | Edward Riley | 34,221 | 84.2 | +8.7 | |
Nationalist | William Pickup | 6,409 | 15.8 | −8.7 | |
Total formal votes | 40,630 | 97.0 | |||
Informal votes | 1,263 | 3.0 | |||
Turnout | 41,893 | 95.3 | |||
Labor hold | Swing | +8.7 | |||
Party | Candidate | Votes | % | ±% | |
---|---|---|---|---|---|
Country | Earle Page | unopposed | |||
Country hold | Swing | ||||
Party | Candidate | Votes | % | ±% | |
---|---|---|---|---|---|
Labor | Ted Theodore | 31,276 | 77.9 | +13.7 | |
Nationalist | Thomas Morrow | 8,870 | 22.1 | +1.8 | |
Total formal votes | 40,146 | 97.3 | |||
Informal votes | 1,126 | 2.7 | |||
Turnout | 41,272 | 96.2 | |||
Labor hold | Swing | +3.6 | |||
Party | Candidate | Votes | % | ±% | |
---|---|---|---|---|---|
Labor | Arthur Blakeley | 24,124 | 70.2 | −0.7 | |
Nationalist | Brian Doe | 10,259 | 29.8 | +0.7 | |
Total formal votes | 34,383 | 96.6 | |||
Informal votes | 1,215 | 3.4 | |||
Turnout | 35,598 | 90.0 | |||
Labor hold | Swing | −0.7 | |||
Party | Candidate | Votes | % | ±% | |
---|---|---|---|---|---|
Labor | John West | 25,105 | 68.4 | +10.0 | |
Nationalist | Hyman Diamond | 11,583 | 31.6 | -10.0 | |
Total formal votes | 36,688 | 96.2 | |||
Informal votes | 1,451 | 3.8 | |||
Turnout | 38,139 | 89.1 | |||
Labor hold | Swing | +10.0 | |||
Party | Candidate | Votes | % | ±% | |
---|---|---|---|---|---|
Labor | John Cusack | 19,732 | 50.1 | +7.7 | |
Nationalist | John Perkins | 19,692 | 49.9 | -7.7 | |
Total formal votes | 39,424 | 97.0 | |||
Informal votes | 1,233 | 3.0 | |||
Turnout | 40,657 | 93.6 | |||
Labor gain from Nationalist | Swing | +7.7 | |||
Party | Candidate | Votes | % | ±% | |
---|---|---|---|---|---|
Labor | Lou Cunningham | 20,873 | 53.7 | +6.0 | |
Country | Aubrey Abbott | 18,014 | 46.3 | -6.0 | |
Total formal votes | 38,887 | 97.9 | |||
Informal votes | 831 | 2.1 | |||
Turnout | 39,718 | 92.7 | |||
Labor gain from Country | Swing | +6.0 | |||
Party | Candidate | Votes | % | ±% | |
---|---|---|---|---|---|
Labor | Parker Moloney | 23,144 | 56.6 | +3.9 | |
Country | Thomas Fitzpatrick | 17,743 | 43.4 | +16.1 | |
Total formal votes | 40,887 | 97.9 | |||
Informal votes | 878 | 2.1 | |||
Turnout | 41,765 | 95.9 | |||
Labor hold | Swing | +1.9 | |||
Party | Candidate | Votes | % | ±% | |
---|---|---|---|---|---|
Labor | Rowley James | unopposed | |||
Labor hold | Swing | ||||
Party | Candidate | Votes | % | ±% | |
---|---|---|---|---|---|
Labor | William Long | 28,898 | 66.2 | +12.7 | |
Nationalist | Dick Dein | 14,736 | 33.8 | -12.7 | |
Total formal votes | 43,634 | 97.4 | |||
Informal votes | 1,150 | 2.6 | |||
Turnout | 44,784 | 94.3 | |||
Labor hold | Swing | +12.7 | |||
Party | Candidate | Votes | % | ±% | |
---|---|---|---|---|---|
Labor | Ben Chifley | 25,349 | 65.6 | +10.7 | |
Nationalist | Charles Dash | 13,271 | 34.4 | -10.7 | |
Total formal votes | 38,620 | 97.0 | |||
Informal votes | 1,204 | 2.0 | |||
Turnout | 39,824 | 96.0 | |||
Labor hold | Swing | +10.7 | |||
Party | Candidate | Votes | % | ±% | |
---|---|---|---|---|---|
Labor | John Eldridge | 31,804 | 51.73 | +8.61 | |
Nationalist | Graham Pratten | 25,218 | 41.02 | -15.86 | |
People's Party | Edward Beeby | 4,459 | 7.25 | +7.25 | |
Total formal votes | 61,481 | 98.15 | +2.69 | ||
Informal votes | 1,160 | 1.85 | –2.69 | ||
Turnout | 62,641 | 96.94 | +2.47 | ||
Two-party-preferred result | |||||
Labor | John Eldridge | 56.4 | +13.3 | ||
Nationalist | Graham Pratten | 45.6 | -13.3 | ||
Labor gain from Nationalist | Swing | +13.3 | |||
Party | Candidate | Votes | % | ±% | |
---|---|---|---|---|---|
Country | Victor Thompson | 21,005 | 54.6 | -45.4 | |
Labor | Thomas Wilson | 17,489 | 45.4 | +45.4 | |
Total formal votes | 38,494 | 97.3 | |||
Informal votes | 1,063 | 2.7 | |||
Turnout | 39,557 | 93.6 | |||
Country hold | Swing | -45.4 | |||
Party | Candidate | Votes | % | ±% | |
---|---|---|---|---|---|
Labor | David Watkins | unopposed | |||
Labor hold | Swing | ||||
Party | Candidate | Votes | % | ±% | |
---|---|---|---|---|---|
Ind. Nationalist | Billy Hughes | 33,263 | 61.2 | +61.2 | |
Nationalist | Lewis Nott | 20,298 | 37.3 | -28.9 | |
Independent Labor | Clifford Banks | 618 | 1.1 | +1.1 | |
Socialist Labor | Ernie Judd | 180 | 0.3 | +0.3 | |
Total formal votes | 54,359 | 97.9 | |||
Informal votes | 1,169 | 2.1 | |||
Turnout | 55,528 | 95.7 | |||
Two-party-preferred result | |||||
Ind. Nationalist | Billy Hughes | 66.1 | +66.1 | ||
Nationalist | Lewis Nott | 33.9 | -32.3 | ||
Ind. Nationalist gain from Nationalist | Swing | +32.3 | |||
Party | Candidate | Votes | % | ±% | |
---|---|---|---|---|---|
Labor | Edward McTiernan | 32,387 | 57.8 | +15.2 | |
Nationalist | Charles Marr | 23,618 | 42.2 | -15.2 | |
Total formal votes | 56,005 | 97.8 | |||
Informal votes | 1,268 | 2.2 | |||
Turnout | 57,273 | 95.5 | |||
Labor gain from Nationalist | Swing | +15.2 | |||
Party | Candidate | Votes | % | ±% | |
---|---|---|---|---|---|
Labor | Albert Rowe | 30,686 | 53.3 | +13.4 | |
Nationalist | Eric Bowden | 26,874 | 46.7 | -13.4 | |
Total formal votes | 57,560 | 97.3 | |||
Informal votes | 1,582 | 2.7 | |||
Turnout | 59,142 | 95.0 | |||
Labor gain from Nationalist | Swing | +13.4 | |||
Party | Candidate | Votes | % | ±% | |
---|---|---|---|---|---|
Labor | Percy Coleman | 49,909 | 74.6 | +8.5 | |
Nationalist | Ernest Carr | 16,977 | 25.4 | -8.5 | |
Total formal votes | 66,886 | 97.1 | |||
Informal votes | 1,964 | 2.9 | |||
Turnout | 68,850 | 94.7 | |||
Labor hold | Swing | +8.5 | |||
Party | Candidate | Votes | % | ±% | |
---|---|---|---|---|---|
Country | Roland Green | 24,400 | 64.0 | +64.0 | |
Country | Robert Gibson | 13,748 | 36.0 | +36.0 | |
Total formal votes | 38,148 | 95.3 | |||
Informal votes | 1,883 | 4.7 | |||
Turnout | 40,031 | 94.2 | |||
Country hold | Swing | +0.0 | |||
Party | Candidate | Votes | % | ±% | |
---|---|---|---|---|---|
Country | William Killen | 22,200 | 51.6 | -3.1 | |
Labor | William Nulty | 19,606 | 45.6 | +3.1 | |
Country | Horace Nock | 1,224 | 2.8 | +2.8 | |
Total formal votes | 43,030 | 97.7 | |||
Informal votes | 1,022 | 2.3 | |||
Turnout | 44,052 | 93.9 | |||
Two-party-preferred result | |||||
Country | William Killen | 54.2 | -3.3 | ||
Labor | William Nulty | 45.8 | +3.3 | ||
Country hold | Swing | -3.3 | |||
Party | Candidate | Votes | % | ±% | |
---|---|---|---|---|---|
Nationalist | Sydney Gardner | 19,188 | 51.5 | -48.5 | |
Labor | Michael Fitzgerald | 18,077 | 48.5 | +48.5 | |
Total formal votes | 37,265 | 96.2 | |||
Informal votes | 1,478 | 3.8 | |||
Turnout | 38,743 | 92.4 | |||
Nationalist hold | Swing | -48.5 | |||
Party | Candidate | Votes | % | ±% | |
---|---|---|---|---|---|
Labor | Edward Riley | 34,978 | 66.3 | +12.1 | |
Nationalist | William Adkins | 17,782 | 33.7 | -12.1 | |
Total formal votes | 52,760 | 96.9 | |||
Informal votes | 1,696 | 3.1 | |||
Turnout | 54,456 | 92.8 | |||
Labor hold | Swing | +12.1 | |||
Party | Candidate | Votes | % | ±% | |
---|---|---|---|---|---|
Nationalist | Archdale Parkhill | 25,129 | 52.6 | -47.4 | |
Ind. People's Party | Richard Windeyer | 22,688 | 47.4 | +47.4 | |
Total formal votes | 47,817 | 97.2 | |||
Informal votes | 1,391 | 2.8 | |||
Turnout | 49,208 | 95.7 | |||
Nationalist hold | Swing | -47.4 | |||
Party | Candidate | Votes | % | ±% | |
---|---|---|---|---|---|
Ind. Nationalist | Walter Marks | 31,991 | 58.3 | +58.3 | |
Nationalist | Arthur Manning | 22,878 | 41.7 | -19.8 | |
Total formal votes | 54,869 | 96.5 | |||
Informal votes | 1,982 | 3.5 | |||
Turnout | 56,851 | 94.0 | |||
Ind. Nationalist gain from Nationalist | Swing | +19.8 | |||
Party | Candidate | Votes | % | ±% | |
---|---|---|---|---|---|
Labor | Bert Lazzarini | 28,213 | 65.4 | +3.7 | |
Nationalist | Bernard Grogan | 14,903 | 34.6 | −3.7 | |
Total formal votes | 43,116 | 97.3 | |||
Informal votes | 1,204 | 2.7 | |||
Turnout | 44,320 | 94.7 | |||
Labor hold | Swing | +3.7 | |||
Party | Candidate | Votes | % | ±% | |
---|---|---|---|---|---|
Labor | Jack Beasley | 28,121 | 86.5 | +4.8 | |
Nationalist | Lindsay Thompson | 4,404 | 13.5 | -4.8 | |
Total formal votes | 32,525 | 97.1 | |||
Informal votes | 973 | 2.9 | |||
Turnout | 33,498 | 94.2 | |||
Labor hold | Swing | +4.8 | |||
Party | Candidate | Votes | % | ±% | |
---|---|---|---|---|---|
Nationalist | Thomas White | 31,751 | 58.5 | −4.7 | |
Labor | Don Cameron | 22,480 | 41.5 | +41.5 | |
Total formal votes | 54,231 | 95.6 | |||
Informal votes | 2,404 | 4.4 | |||
Turnout | 56,635 | 97.7 | |||
Nationalist hold | Swing | −4.7 | |||
Party | Candidate | Votes | % | ±% | |
---|---|---|---|---|---|
Labor | Charles McGrath | 21,760 | 57.4 | +4.8 | |
Nationalist | Fred Edmunds | 16,129 | 42.6 | −4.8 | |
Total formal votes | 37,889 | 99.2 | |||
Informal votes | 337 | 0.8 | |||
Turnout | 38,226 | 97.5 | |||
Labor hold | Swing | +4.8 | |||
Party | Candidate | Votes | % | ±% | |
---|---|---|---|---|---|
Labor | Frank Brennan | 46,666 | 75.8 | +12.0 | |
Nationalist | Cecil Keeley | 14,891 | 24.2 | -12.0 | |
Total formal votes | 61,557 | 98.2 | |||
Informal votes | 1,158 | 1.8 | |||
Turnout | 62,715 | 94.9 | |||
Labor hold | Swing | +12.0 | |||
Party | Candidate | Votes | % | ±% | |
---|---|---|---|---|---|
Labor | Richard Keane | 21,111 | 55.1 | +12.7 | |
Nationalist | Geoffry Hurry | 17,177 | 44.9 | +7.3 | |
Total formal votes | 38,288 | 99.0 | |||
Informal votes | 390 | 1.0 | |||
Turnout | 38,678 | 96.6 | |||
Labor gain from Nationalist | Swing | +8.2 | |||
Party | Candidate | Votes | % | ±% | |
---|---|---|---|---|---|
Labor | Frank Anstey | 43,714 | 77.4 | +8.7 | |
Nationalist | Lionel Hahn | 12,763 | 22.6 | −8.7 | |
Total formal votes | 56,477 | 98.4 | |||
Informal votes | 913 | 1.6 | |||
Turnout | 57,390 | 96.5 | |||
Labor hold | Swing | +8.7 | |||
Party | Candidate | Votes | % | ±% | |
---|---|---|---|---|---|
Labor | Richard Crouch | 20,924 | 52.1 | +5.1 | |
Country | William Gibson | 19,244 | 47.9 | −5.1 | |
Total formal votes | 40,168 | 98.9 | |||
Informal votes | 461 | 1.1 | |||
Turnout | 40,629 | 95.3 | |||
Labor gain from Country | Swing | +5.1 | |||
Party | Candidate | Votes | % | ±% | |
---|---|---|---|---|---|
Labor | Arthur Lewis | 27,525 | 56.0 | +14.5 | |
Nationalist | John Lister | 21,639 | 44.0 | −14.5 | |
Total formal votes | 49,164 | 98.9 | |||
Informal votes | 533 | 1.1 | |||
Turnout | 49,697 | 94.8 | |||
Labor gain from Nationalist | Swing | +14.5 | |||
Party | Candidate | Votes | % | ±% | |
---|---|---|---|---|---|
Country | William Hill | 21,750 | 53.7 | -6.3 | |
Labor | Edward Hill | 18,734 | 46.3 | +46.3 | |
Total formal votes | 40,484 | 98.3 | |||
Informal votes | 712 | 1.7 | |||
Turnout | 41,196 | 96.1 | |||
Country hold | Swing | -6.3 | |||
Party | Candidate | Votes | % | ±% | |
---|---|---|---|---|---|
Ind. Nationalist | George Maxwell | 25,564 | 59.4 | +59.4 | |
Nationalist | Arthur Robinson | 16,547 | 38.4 | -23.3 | |
Independent | James Ronald | 950 | 2.2 | +2.2 | |
Total formal votes | 43,061 | 98.7 | |||
Informal votes | 584 | 1.3 | |||
Turnout | 43,645 | 93.5 | |||
Two-party-preferred result | |||||
Ind. Nationalist | George Maxwell | 61.4 | +61.4 | ||
Nationalist | Arthur Robinson | 38.6 | -23.1 | ||
Ind. Nationalist gain from Nationalist | Swing | +23.1 | |||
Party | Candidate | Votes | % | ±% | |
---|---|---|---|---|---|
Labor | Jack Holloway | 30,114 | 48.2 | +10.0 | |
Nationalist | Stanley Bruce | 30,054 | 48.1 | -11.3 | |
Independent Liberal | Joseph Burch | 2,267 | 3.6 | +3.6 | |
Total formal votes | 62,435 | 98.6 | |||
Informal votes | 903 | 1.4 | |||
Turnout | 63,338 | 96.2 | |||
Two-party-preferred result | |||||
Labor | Jack Holloway | 31,370 | 50.2 | +10.9 | |
Nationalist | Stanley Bruce | 31,065 | 49.8 | -10.9 | |
Labor gain from Nationalist | Swing | +10.9 | |||
Party | Candidate | Votes | % | ±% | |
---|---|---|---|---|---|
Country | Thomas Paterson | 25,056 | 58.2 | +0.5 | |
Labor | Michael Buckley | 18,030 | 41.8 | +41.8 | |
Total formal votes | 43,086 | 98.0 | |||
Informal votes | 889 | 2.0 | |||
Turnout | 43,975 | 96.4 | |||
Country hold | Swing | +0.5 | |||
Party | Candidate | Votes | % | ±% | |
---|---|---|---|---|---|
Nationalist | Henry Gullett | 35,557 | 48.6 | -18.0 | |
Labor | Billy Duggan | 33,195 | 45.4 | +12.0 | |
Ind. Nationalist | William Bolton | 4,355 | 6.0 | +6.0 | |
Total formal votes | 73,107 | 98.8 | |||
Informal votes | 870 | 1.2 | |||
Turnout | 73,977 | 95.2 | |||
Two-party-preferred result | |||||
Nationalist | Henry Gullett | 37,433 | 51.2 | -15.4 | |
Labor | Billy Duggan | 35,674 | 48.8 | +15.4 | |
Nationalist hold | Swing | -15.4 | |||
Party | Candidate | Votes | % | ±% | |
---|---|---|---|---|---|
Labor | Paul Jones | 19,319 | 49.4 | −50.6 | |
Country | Robert Cook | 11,493 | 29.4 | +29.4 | |
Country | Arthur Walter | 6,124 | 15.7 | +15.7 | |
Country | Leslie Sambell | 2,180 | 5.6 | +5.6 | |
Total formal votes | 39,116 | 98.2 | |||
Informal votes | 721 | 1.8 | |||
Turnout | 39,837 | 96.0 | |||
Two-party-preferred result | |||||
Labor | Paul Jones | 20,110 | 51.4 | −48.6 | |
Country | Robert Cook | 19,006 | 48.6 | +48.6 | |
Labor hold | Swing | −48.6 | |||
Party | Candidate | Votes | % | ±% | |
---|---|---|---|---|---|
Nationalist | John Latham | 34,909 | 55.2 | −11.3 | |
Labor | Albert Langker | 28,276 | 44.8 | +11.3 | |
Total formal votes | 63,185 | 98.6 | |||
Informal votes | 898 | 1.4 | |||
Turnout | 64,083 | 95.4 | |||
Nationalist hold | Swing | −11.3 | |||
Party | Candidate | Votes | % | ±% | |
---|---|---|---|---|---|
Labor | James Fenton | 39,409 | 73.2 | +13.3 | |
Nationalist | Percy Anderson | 14,441 | 26.8 | -13.3 | |
Total formal votes | 53,850 | 98.6 | |||
Informal votes | 740 | 1.4 | |||
Turnout | 54,590 | 97.7 | |||
Labor hold | Swing | +13.3 | |||
Party | Candidate | Votes | % | ±% | |
---|---|---|---|---|---|
Labor | William Maloney | unopposed | |||
Labor hold | Swing | ||||
Party | Candidate | Votes | % | ±% | |
---|---|---|---|---|---|
Labor | James Mathews | unopposed | |||
Labor hold | Swing | ||||
Party | Candidate | Votes | % | ±% | |
---|---|---|---|---|---|
Labor | John McNeill | 21,338 | 52.0 | +4.8 | |
Nationalist | Arthur Rodgers | 19,720 | 48.0 | -4.8 | |
Total formal votes | 41,058 | 98.7 | |||
Informal votes | 541 | 1.3 | |||
Turnout | 41,599 | 97.0 | |||
Labor gain from Nationalist | Swing | +4.8 | |||
Party | Candidate | Votes | % | ±% | |
---|---|---|---|---|---|
Country Progressive | Percy Stewart | 27,942 | 60.0 | +1.6 | |
Country | John Harris | 16,551 | 40.0 | -1.6 | |
Total formal votes | 46,551 | 98.6 | |||
Informal votes | 650 | 1.4 | |||
Turnout | 47,201 | 94.9 | |||
Country Progressive hold | Swing | +1.6 | |||
Party | Candidate | Votes | % | ±% | |
---|---|---|---|---|---|
Labor | James Scullin | unopposed | |||
Labor hold | Swing | ||||
Party | Candidate | Votes | % | ±% | |
---|---|---|---|---|---|
Nationalist | Donald Cameron | 21,048 | 52.4 | −4.3 | |
Labor | Myles Ferricks | 19,103 | 47.6 | +4.3 | |
Total formal votes | 40,151 | 97.1 | |||
Informal votes | 1,202 | 2.9 | |||
Turnout | 41,353 | 94.6 | |||
Nationalist hold | Swing | −4.3 | |||
Party | Candidate | Votes | % | ±% | |
---|---|---|---|---|---|
Labor | Frank Forde | 24,362 | 53.4 | +0.9 | |
Nationalist | Robert Staines | 21,277 | 46.6 | +46.6 | |
Total formal votes | 45,639 | 95.6 | |||
Informal votes | 2,116 | 4.4 | |||
Turnout | 47,755 | 94.1 | |||
Labor hold | Swing | +0.9 | |||
Party | Candidate | Votes | % | ±% | |
---|---|---|---|---|---|
Nationalist | Arthur Morgan | 19,238 | 46.6 | -53.4 | |
Labor | Evan Llewelyn | 12,738 | 30.9 | +30.9 | |
Ind. Nationalist | Sir Littleton Groom | 9,290 | 22.5 | +22.5 | |
Total formal votes | 41,266 | 97.9 | |||
Informal votes | 864 | 2.1 | |||
Turnout | 42,130 | 97.2 | |||
Two-party-preferred result | |||||
Nationalist | Arthur Morgan | 23,873 | 57.9 | -42.1 | |
Labor | Evan Llewelyn | 17,393 | 42.1 | +42.1 | |
Nationalist hold | Swing | -42.1 | |||
Party | Candidate | Votes | % | ±% | |
---|---|---|---|---|---|
Labor | George Martens | 28,813 | 52.8 | +2.6 | |
Nationalist | William Amiet | 25,772 | 47.2 | -2.6 | |
Total formal votes | 54,585 | 95.5 | |||
Informal votes | 2,593 | 4.5 | |||
Turnout | 57,178 | 93.2 | |||
Labor hold | Swing | +2.6 | |||
Party | Candidate | Votes | % | ±% | |
---|---|---|---|---|---|
Labor | Darby Riordan | 15,392 | 53.1 | +5.5 | |
Nationalist | Grosvenor Francis | 13,593 | 46.9 | -5.5 | |
Total formal votes | 28,985 | 95.3 | |||
Informal votes | 1,436 | 4.7 | |||
Turnout | 30,421 | 89.9 | |||
Labor gain from Nationalist | Swing | +5.5 | |||
Party | Candidate | Votes | % | ±% | |
---|---|---|---|---|---|
Nationalist | George Mackay | 34,726 | 67.1 | -32.9 | |
Independent | Frederick O'Keefe | 17,010 | 32.9 | +32.9 | |
Total formal votes | 51,736 | 93.2 | |||
Informal votes | 3,776 | 6.8 | |||
Turnout | 55,512 | 96.0 | |||
Nationalist hold | Swing | -32.9 | |||
Party | Candidate | Votes | % | ±% | |
---|---|---|---|---|---|
Country | James Hunter | 17,215 | 54.9 | -3.4 | |
Labor | Robert Munro | 14,123 | 45.1 | +3.4 | |
Total formal votes | 31,338 | 97.2 | |||
Informal votes | 891 | 2.8 | |||
Turnout | 32,229 | 92.4 | |||
Country hold | Swing | -3.4 | |||
Party | Candidate | Votes | % | ±% | |
---|---|---|---|---|---|
Nationalist | Josiah Francis | 27,716 | 60.1 | -39.9 | |
Labor | Robert Taylor | 18,371 | 39.9 | +39.9 | |
Total formal votes | 46,087 | 96.4 | |||
Informal votes | 1,733 | 3.6 | |||
Turnout | 47,820 | 96.2 | |||
Nationalist hold | Swing | -39.9 | |||
Party | Candidate | Votes | % | ±% | |
---|---|---|---|---|---|
Nationalist | James Bayley | 26,308 | 50.1 | -3.6 | |
Labor | Francis Baker | 26,208 | 49.9 | +3.6 | |
Total formal votes | 52,516 | 97.1 | |||
Informal votes | 1,575 | 2.9 | |||
Turnout | 54,091 | 95.5 | |||
Nationalist hold | Swing | -3.6 | |||
Party | Candidate | Votes | % | ±% | |
---|---|---|---|---|---|
Country | Bernard Corser | 29,249 | 67.2 | -32.8 | |
Labor | John O'Keefe | 14,307 | 32.8 | +32.8 | |
Total formal votes | 43,556 | 95.6 | |||
Informal votes | 2,023 | 4.4 | |||
Turnout | 45,59 | 95.1 | |||
Country hold | Swing | -32.8 | |||
Party | Candidate | Votes | % | ±% | |
---|---|---|---|---|---|
Labor | George Edwin Yates | 24,174 | 61.4 | +5.5 | |
Nationalist | Arthur Wreford | 15,171 | 38.6 | −5.5 | |
Total formal votes | 39,345 | 95.6 | |||
Informal votes | 1,791 | 4.4 | |||
Turnout | 41,136 | 94.5 | |||
Labor hold | Swing | +5.5 | |||
Party | Candidate | Votes | % | ±% | |
---|---|---|---|---|---|
Labor | Moses Gabb | 25,679 | 54.7 | +14.1 | |
Nationalist | Walter Parsons | 21,239 | 45.3 | −14.1 | |
Total formal votes | 46,918 | 96.3 | |||
Informal votes | 1,824 | 3.7 | |||
Turnout | 48,742 | 96.3 | |||
Labor gain from Nationalist | Swing | +14.1 | |||
Party | Candidate | Votes | % | ±% | |
---|---|---|---|---|---|
Nationalist | Malcolm Cameron | 23,189 | 51.2 | −1.4 | |
Labor | Frank Nieass | 22,067 | 48.8 | +48.8 | |
Total formal votes | 45,256 | 94.9 | |||
Informal votes | 2,459 | 5.1 | |||
Turnout | 47,715 | 95.6 | |||
Nationalist hold | Swing | −1.4 | |||
Party | Candidate | Votes | % | ±% | |
---|---|---|---|---|---|
Labor | John Price | 24,841 | 55.6 | +5.5 | |
Nationalist | Bill McCann | 19,847 | 44.4 | −5.5 | |
Total formal votes | 44,688 | 96.7 | |||
Informal votes | 1,548 | 3.3 | |||
Turnout | 46,236 | 93.8 | |||
Labor hold | Swing | +5.5 | |||
Party | Candidate | Votes | % | ±% | |
---|---|---|---|---|---|
Labor | Andrew Lacey | 19,870 | 59.6 | +3.8 | |
Country | Oliver Badman | 13,445 | 40.4 | +40.4 | |
Total formal votes | 33,315 | 95.7 | |||
Informal votes | 1,485 | 4.3 | |||
Turnout | 34,800 | 92.7 | |||
Labor hold | Swing | +3.8 | |||
Party | Candidate | Votes | % | ±% | |
---|---|---|---|---|---|
Labor | Norman Makin | unopposed | |||
Labor hold | Swing | ||||
Party | Candidate | Votes | % | ±% | |
---|---|---|---|---|---|
Labor | Sydney McHugh | 12,503 | 36.4 | +36.4 | |
Nationalist | Charles Hawker | 12,417 | 36.1 | -4.3 | |
Country | Maurice Collins | 9,437 | 27.5 | -32.1 | |
Total formal votes | 34,357 | 96.5 | |||
Informal votes | 1,251 | 3.5 | |||
Turnout | 35,608 | 96.0 | |||
Two-party-preferred result | |||||
Nationalist | Charles Hawker | 19,547 | 56.9 | +16.5 | |
Labor | Sydney McHugh | 14,810 | 43.1 | +43.1 | |
Nationalist gain from Country | Swing | +16.5 | |||
Party | Candidate | Votes | % | ±% | |
---|---|---|---|---|---|
Country | John Prowse | unopposed | |||
Country hold | Swing | ||||
Party | Candidate | Votes | % | ±% | |
---|---|---|---|---|---|
Labor | John Curtin | 24,482 | 57.0 | +7.8 | |
Nationalist | Keith Watson | 18,426 | 43.0 | +14.2 | |
Total formal votes | 42,980 | 97.9 | |||
Informal votes | 914 | 2.1 | |||
Turnout | 43,822 | 91.0 | |||
Labor hold | Swing | +4.9 | |||
Party | Candidate | Votes | % | ±% | |
---|---|---|---|---|---|
Labor | Albert Green | 15,761 | 63.9 | -36.1 | |
Country | William Pickering | 5,684 | 23.1 | +23.1 | |
Nationalist | William Greenard | 3,203 | 13.0 | +13.0 | |
Total formal votes | 24,648 | 98.0 | |||
Informal votes | 505 | 2.0 | |||
Turnout | 25,153 | 84.6 | |||
Two-party-preferred result | |||||
Labor | Albert Green | 65.2 | -34.8 | ||
Country | William Pickering | 34.8 | +34.8 | ||
Labor hold | Swing | -34.8 | |||
Party | Candidate | Votes | % | ±% | |
---|---|---|---|---|---|
Labor | Ted Needham | 16,411 | 43.1 | +9.1 | |
Nationalist | Walter Nairn | 13,521 | 35.5 | -26.3 | |
Ind. Nationalist | Edward Mann | 7,645 | 20.1 | +20.1 | |
Independent | John McCoo | 522 | 1.4 | -2.8 | |
Total formal votes | 38,099 | 97.4 | |||
Informal votes | 1,020 | 2.6 | |||
Turnout | 39,119 | 89.9 | |||
Two-party-preferred result | |||||
Nationalist | Walter Nairn | 19,254 | 50.5 | -14.4 | |
Labor | Ted Needham | 18,845 | 49.5 | +14.4 | |
Nationalist hold | Swing | -14.4 | |||
Party | Candidate | Votes | % | ±% | |
---|---|---|---|---|---|
Country | Henry Gregory | unopposed | |||
Country hold | Swing | ||||
Party | Candidate | Votes | % | ±% | |
---|---|---|---|---|---|
Labor | Allan Guy | 13,318 | 60.4 | +17.8 | |
Nationalist | Syd Jackson | 8,741 | 39.6 | −17.8 | |
Total formal votes | 22,059 | 98.6 | |||
Informal votes | 324 | 1.4 | |||
Turnout | 22,383 | 95.4 | |||
Labor gain from Nationalist | Swing | +13.5 | |||
Party | Candidate | Votes | % | ±% | |
---|---|---|---|---|---|
Nationalist | George Bell | 11,982 | 53.6 | -18.3 | |
Labor | Henry Lane | 5,233 | 23.4 | +23.4 | |
Labor | Thomas d'Alton | 5,137 | 23.0 | +23.0 | |
Total formal votes | 22,352 | 98.1 | |||
Informal votes | 443 | 1.9 | |||
Turnout | 22,795 | 95.1 | |||
Two-party-preferred result | |||||
Nationalist | George Bell | 55.9 | -16.0 | ||
Labor | Henry Lane | 44.1 | +44.1 | ||
Nationalist hold | Swing | -16.0 | |||
Party | Candidate | Votes | % | ±% | |
---|---|---|---|---|---|
Labor | Charles Culley | 12,451 | 57.5 | +5.1 | |
Nationalist | Sir John Gellibrand | 5,663 | 26.2 | -5.9 | |
Nationalist | Horace Walch | 2,082 | 9.6 | +9.6 | |
Nationalist | Hubert Brettingham-Moore | 681 | 3.1 | +3.1 | |
Nationalist | John Gage | 605 | 2.8 | +2.8 | |
Independent | David Blanchard | 161 | 0.7 | +0.7 | |
Total formal votes | 21,643 | 97.2 | |||
Informal votes | 623 | 2.8 | |||
Turnout | 22,266 | 95.9 | |||
Two-party-preferred result | |||||
Labor | Charles Culley | 59.2 | +8.9 | ||
Nationalist | Sir John Gellibrand | 40.8 | -8.9 | ||
Labor hold | Swing | +8.9 | |||
Party | Candidate | Votes | % | ±% | |
---|---|---|---|---|---|
Independent | William McWilliams | 12,399 | 54.9 | +10.4 | |
Nationalist | Alfred Seabrook | 10,175 | 45.1 | -10.4 | |
Total formal votes | 22,574 | 98.5 | |||
Informal votes | 343 | 1.5 | |||
Turnout | 22,917 | 95.3 | |||
Independent hold | Swing | +3.3 | |||
Party | Candidate | Votes | % | ±% | |
---|---|---|---|---|---|
Labor | Joseph Lyons | 10,697 | 52.9 | +52.9 | |
Nationalist | Llewellyn Atkinson | 9,538 | 47.1 | -16.5 | |
Total formal votes | 20,235 | 97.1 | |||
Informal votes | 331 | 1.6 | |||
Turnout | 20,566 | 94.5 | |||
Labor gain from Nationalist | Swing | +16.5 | |||
Party | Candidate | Votes | % | ±% | |
---|---|---|---|---|---|
Labor | Harold Nelson | unopposed | |||
Labor hold | Swing | ||||
The Division of Higgins is an Australian Electoral Division in Victoria for the Australian House of Representatives. The division covers 41 km2 (16 sq mi) in Melbourne's inner south-eastern suburbs. The main suburbs include Armadale, Ashburton, Carnegie, Glen Iris, Kooyong, Malvern, Malvern East, Murrumbeena, Prahran and Toorak; along with parts of Camberwell, Ormond and South Yarra. Though historically a safe conservative seat, Higgins was won by the Liberal Party by a margin of just 3.9 percent over the Labor Party at the 2019 election, the closest result in the seat’s history. It then flipped to Labor in the 2022 election.
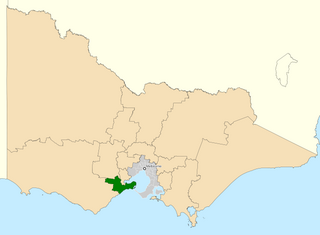
The Division of Corangamite is an Australian electoral division in the state of Victoria. The division was proclaimed in 1900, and was one of the original 65 divisions to be contested at the first federal election. It is named for Lake Corangamite, although the lake no longer falls within the division's boundaries.
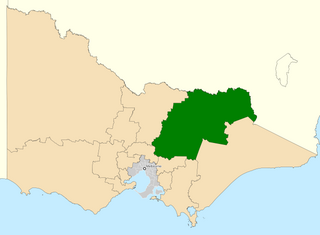
The Division of Indi ( "IN-dye") is an Australian electoral division in the state of Victoria. The division is located in the north-east of the state, adjoining the border with New South Wales. The largest settlements in the division are the regional cities of Wodonga, Wangaratta, and Benalla. Other towns in the electorate include Rutherglen, Mansfield, Beechworth, Myrtleford, Bright, Alexandra, Tallangatta, Corryong and a number of other small villages. While Indi is one of the largest electorates in Victoria, much of it is located within the largely uninhabited Australian Alps. While Wodonga serves as a regional hub for much of the more heavily populated northern part of the electorate, the southern part is closer to Melbourne than Wodonga.
Australia suffered badly during the period of the Great Depression of the 1930s. The Depression began with the Wall Street Crash of 1929 and rapidly spread worldwide. As in other nations, Australia suffered years of high unemployment, poverty, low profits, deflation, plunging incomes, and lost opportunities for economic growth and personal advancement.
The Australian People's Party was a registered political party in Australia. It was registered by the Australian Electoral Commission in March 2017. It was formed in 2014. The party recruited enough members to gain registration in March 2017. The party said its aim was to improve standards of living and rights for all Australians through commonsense policies. The party describes itself as a centrist party. The party was de-registered in November 2021 by the Australian Electoral Commission for not having 500 members.
Nedlands is a Legislative Assembly electorate in the state of Western Australia. Nedlands is named for the inner western Perth suburb of Nedlands, which falls within its borders.
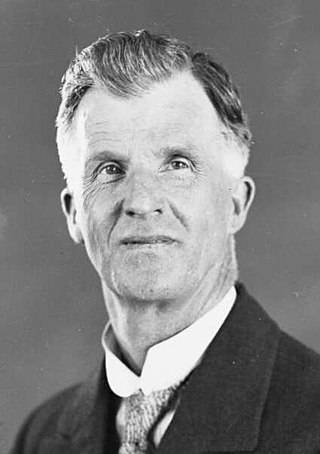
The 1929 Australian federal election was held in Australia on 12 October 1929. All 75 seats in the House of Representatives were up for election, but there was no Senate election. The election was caused by the defeat of the Stanley Bruce-Earle Page Government in the House of Representatives over the Maritime Industries Bill, Bruce having declared that the vote on the bill would constitute a vote of confidence in his government.
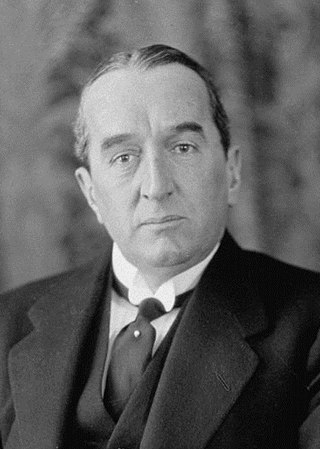
The 1928 Australian federal election was held in Australia on 17 November 1928. All 75 seats in the House of Representatives and 19 of the 36 seats in the Senate were up for election. The incumbent Nationalist–Country coalition, led by Prime Minister Stanley Bruce won a record fifth consecutive election defeating the opposition Labor Party led by James Scullin.
The 1925 Australian federal election was held in Australia on 14 November 1925. All 75 seats in the House of Representatives and 22 of the 36 seats in the Senate were up for election. The incumbent Nationalist–Country coalition, led by Prime Minister Stanley Bruce, defeated the opposition Labor Party led by Matthew Charlton in a landslide. This was the first time any party had won a fourth consecutive federal election.
This is a list of members of the Western Australian Legislative Assembly between the 1927 election and the 1930 election, together known as the 13th Parliament.
This is a list of the members of the Australian House of Representatives in the 12th Australian Parliament, which was elected at the 1929 election on 12 October 1929. The incumbent Nationalist Party of Australia led by Prime Minister of Australia Stanley Bruce in power since 1923 with coalition partner the Country Party led by Earle Page was defeated by the opposition Australian Labor Party led by James Scullin. Labor won with its then largest-ever majority in the federal parliament. However major divisions within the Labor over policy responses to the Great Depression, and the subsequent creation of the United Australia Party led to thirty parliamentarians changing their party affiliation in 1931.
This is a list of members of the Tasmanian House of Assembly between the 30 May 1928 election and the 9 May 1931 election. The 1928 election failed to deliver a majority, and the Nationalists' John McPhee took over from Labor's Joseph Lyons as Premier of Tasmania. Lyons subsequently retired from state politics, obtaining election to the Federal seat of Wilmot and going on to become Prime Minister of Australia in 1931.
This is a list of members of the 24th Legislative Assembly of Queensland from 1926 to 1929, as elected at the 1926 state election held on 8 May 1926.
This is a list of members of the 25th Legislative Assembly of Queensland from 1929 to 1932, as elected at the 1929 state election held on 11 May 1929.
This is a list of electoral results for the Division of East Sydney in Australian federal elections from the division's creation in 1901 until its abolition in 1969.
This is a list of electoral results for the Division of Balaclava in Australian federal elections from the division's creation in 1901 until its abolition in 1984.
This is a list of members of the 21st Legislative Assembly of Queensland from 1918 to 1920, as elected at the 1918 state election held on 16 March 1918.
This is a list of electoral division results for the Australian 1928 federal election.