Results of the 1996 Australian federal election (House of Representatives)

Last updated

1996 Australian federal election
Flag of Australia (converted).svg
  1993 2 March 1996 (1996-03-02) 1998  

All 148 seats in the House of Representatives
75 seats were needed for a majority in the House
40 (of the 76) seats in the Senate
 First partySecond party
  John howard.jpg Keating Paul BANNER.jpg
Leader John Howard Paul Keating
Party Liberal/National coalition Labor
Leader since 30 January 1995 (1995-01-30) 19 December 1991 (1991-12-19)
Leader's seat Bennelong (NSW) Blaxland (NSW)
Last election65 seats80 seats
Seats won94 seats49 seats
Seat changeIncrease2.svg29Decrease2.svg31
Popular vote5,810,5465,024,327
Percentage53.63%46.37%
SwingIncrease2.svg5.07Decrease2.svg5.07

Prime Minister before election

Paul Keating
Labor

Subsequent Prime Minister

John Howard
Liberal/National coalition

The following tables show results for the Australian House of Representatives at the 1996 federal election held on 2 March 1996. [1]

Contents

Australia

House of Reps (IRV) – 1998–2001 – Turnout 94.99% (CV) — Informal 3.78%
1996 Australian House.svg
PartyVotes %SwingSeatsChange
   Liberal 4,210,68938.69+1.9275Increase2.svg 26
  National 893,1708.21+1.0418Increase2.svg 2
  Country Liberal 38,3020.35+0.021Increase2.svg 1
Liberal/National Coalition 5,142,16147.25+2.9894Increase2.svg 29
  Labor 4,217,76538.75−6.1749Decrease2.svg 31
  Democrats 735,8486.76+3.01
  Greens [lower-alpha 1] 317,6542.92+1.09
  Independents 262,4202.41−0.735Increase2.svg 3
 Total10,883,852  148Increase2.svg 1
Two-party-preferred vote
  Liberal–National coalition Win53.63+5.0794Increase2.svg 29
  Labor  46.37−5.0749Decrease2.svg 31

States

New South Wales

1996 Australian federal election
(New South Wales)
Flag of New South Wales.svg
  1993 2 March 1996 1998  

All 50 New South Wales seats in the Australian House of Representatives
and 6 seats in the Australian Senate
 First partySecond party
  John howard.jpg Keating Paul BANNER.jpg
Leader John Howard Paul Keating
Party Liberal/National coalition Labor
Last election1633 seats
Seats won29 seats20 seats
Seat changeIncrease2.svg 13Decrease2.svg 13
Popular vote1,742,9651,453,542
Percentage45.6%39.6%
SwingIncrease2.svg 4.0Decrease2.svg 8.7
TPP 52.56%47.44%
TPP swingIncrease2.svg 6.95Decrease2.svg 6.95
Turnout 96.4% (CV) — Informal 3.6% [2]
PartyVotes%SwingSeatsChange
   Liberal 1,229,42333.46+1.6919Increase2.svg 11
  National 443,54212.07+2.3210Increase2.svg 2
Liberal/National Coalition 1,672,96545.53+4.0129Increase2.svg 13
  Labor 1,453,54239.56-8.7620Decrease2.svg 13
  Democrats 240,2556.54+3.73Steady2.svg
  Greens 92,5492.52+1.44Steady2.svg
  Independents 88,5092.411Steady2.svg
  Against Further Immigration 52,1281.42+1.37Steady2.svg
  Christian Democrats 34,1080.93+0.31Steady2.svg
  No Aircraft Noise 18,6260.51Steady2.svg
  Natural Law 11,2520.31–0.35Steady2.svg
  Reclaim Australia 5,4870.15Steady2.svg
  Women's Party 1,7080.05Steady2.svg
Total3,674,20950
Two-party-preferred vote
  Liberal/National Coalition 1,922,16547.44-6.9520Increase2.svg 13
  Labor 1,734,77752.566.9529Decrease2.svg 13
Invalid/blank votes138,1573.62
Turnout3,812,36696.37
Registered voters3,955,782
Source: Federal Elections 1996

Victoria

1996 Australian federal election
(Victoria)
Flag of Victoria (Australia).svg
  1993 2 March 1996 1998  

All 37 Victoria seats in the Australian House of Representatives
and 6 seats in the Australian Senate
 First partySecond party
  John howard.jpg Keating Paul BANNER.jpg
Leader John Howard Paul Keating
Party Liberal/National coalition Labor
Last election2017 seats
Seats won21 seats16 seats
Seat changeIncrease2.svg 1Decrease2.svg 1
Popular vote1,234,6471,190,404
Percentage44.5%42.9%
SwingDecrease2.svg 0.7Decrease2.svg 3.6
TPP 49.70%50.30%
TPP swingIncrease2.svg 1.50Decrease2.svg 1.50
Turnout 96.1% (CV) — Informal 2.9% [2]
PartyVotes%SwingSeatsChange
   Liberal 1,106,55639.90−0.3119Increase2.svg 2
  National 128,0914.62−0.392Decrease2.svg 1
Liberal/National Coalition 1,234,64744.52−0.7021Increase2.svg 1
  Labor 1,190,40442.92−3.5316Decrease2.svg 1
  Democrats 203,9027.353.66Steady2.svg
  Greens 52,8121.901.78Steady2.svg
  Independent 45,2431.63−1.13Decrease2.svg 1
  Natural Law 20,9880.76−0.39Steady2.svg
  Against Further Immigration 16,9140.610.54Steady2.svg
  Call to Australia 8,0810.29−0.19Steady2.svg
  Pensioner and CIR 3320.000.01Steady2.svg
Total2,773,32337Decrease2.svg 1
Two-party-preferred vote
  Labor 1,388,14250.30-1.5016Decrease2.svg 1
  Liberal/National Coalition 1,371,48049.701.5021Increase2.svg 1
Invalid/blank votes83,6152.93
Turnout2,856,93696.11
Registered voters2,972,635
Source: Federal Elections 1996

Queensland

1996 Australian federal election
(Queensland)
Flag of Queensland.svg
  1993 2 March 1996 1998  

All 26 Queensland seats in the Australian House of Representatives
and 6 seats in the Australian Senate
 First partySecond party
  John howard.jpg Keating Paul BANNER.jpg
Leader John Howard Paul Keating
Party Liberal/National coalition Labor
Last election1313 seats
Seats won23 seats2 seats
Seat changeIncrease2.svg 11Decrease2.svg 11
Popular vote1,071,126664,371
Percentage54.36%33.72%
SwingIncrease2.svg 8.377Decrease2.svg 6.77
TPP 60.22%39.78%
TPP swingIncrease2.svg 8.65Decrease2.svg 8.65
Turnout 96.6% (CV) — Informal 2.5% [2]
PartyVotes%SwingSeatsChange
   Liberal 764,14038.787.5217Increase2.svg 10
  National 306,98615.580.856Increase2.svg 1
Liberal/National Coalition 1,071,12654.368.3723Increase2.svg 11
  Labor 664,37133.72-6.772Decrease2.svg 11
  Democrats 131,9446.702.64Steady2.svg
  Independents [lower-alpha 2] 25,6291.30-1.571Increase2.svg 1
  Greens 49,4622.51-0.69Steady2.svg
  Indigenous Peoples 12,5070.63-2.19Steady2.svg
  Women's Party 4,4650.230.01Steady2.svg
  Confederate Action 4,2790.220.03Steady2.svg
  One Australia 3,1590.16Steady2.svg
  Natural Law 1,5320.08Steady2.svg
  Against Further Immigration 1,2580.06Steady2.svg
  Call to Australia 4940.03Steady2.svg
  Republican 1560.01Steady2.svg
Total1,970,38226Increase2.svg 1
Two-party-preferred vote
  Liberal/National Coalition 1,158,12260.22+8.6523Increase2.svg 11
  Labor 765,01939.78-8.652Decrease2.svg 11
Invalid/blank votes50,6052.50-0.12
Turnout2,020,98796.63
Registered voters2,091,384
Source: Federal Elections 1996

Western Australia

1996 Australian federal election
(Western Australia)
Flag of Western Australia.svg
  1993 2 March 1996 1998  

All 14 Western Australian seats in the Australian House of Representatives
and 6 seats in the Australian Senate
 First partySecond party
  John howard.jpg Keating Paul BANNER.jpg
Leader John Howard Paul Keating
Party Liberal/National coalition Labor
Last election86 seats
Seats won8 seats3 seats
Seat changeSteady2.svgDecrease2.svg 3
Popular vote453,980347,583
Percentage45.334.7
SwingDecrease2.svg 3.9Decrease2.svg 4.7
TPP 56.00%44.00%
TPP swingIncrease2.svg 2.02Decrease2.svg 2.02
Turnout 96.6% (CV) — Informal 2.5% [2]
PartyVotes%SwingSeatsChange
   Liberal 440,64744.02-4.998Steady2.svg
  National 13,3331.331.09Steady2.svg
Liberal/National Coalition 453,98045.35-3.908Steady2.svg
  Labor 347,58334.73-4.623Decrease2.svg 3
  Independent 87,3288.727.463Increase2.svg 3
  Democrats 55,8625.582.30Steady2.svg
  Greens 53,1015.31-0.46Steady2.svg
  Natural Law 2,1590.22-0.31Steady2.svg
  Against Further Immigration 9430.09Steady2.svg
Total1,000,95614
Two-party-preferred vote
  Liberal/National Coalition 557,05556.002.028Steady2.svg
  Labor 437,69444.00-2.023Decrease2.svg 3
Invalid/blank votes32,6163.160.66
Turnout1,033,57294.95
Registered voters1,088,487
Source: Federal Elections 1996

South Australia

1996 Australian federal election
(South Australia)
Flag of South Australia.svg
  1993 2 March 1996 1998  

All 12 South Australian seats in the Australian House of Representatives
and 6 seats in the Australian Senate
 First partySecond party
  John howard.jpg Keating Paul BANNER.jpg
Leader John Howard Paul Keating
Party Liberal/National coalition Labor
Last election84 seats
Seats won10 seats2 seats
Seat changeIncrease2.svg 2Decrease2.svg 2
Popular vote420,246320,678
Percentage50.0%34.8%
SwingIncrease2.svg 4.3Decrease2.svg 4.0
TPP 57.3%42.7%
TPP swingIncrease2.svg 4.6Decrease2.svg 4.6
Turnout 95.9% (CV) — Informal 4.1% [2]
PartyVotes%SwingSeatsChange
  Liberal 460,24649.99+4.3310Increase2.svg 2
  Labor 320,67834.83-4.012Decrease2.svg 2
  Democrats 93,89910.20+2.41Steady2.svg
  Greens 27,1462.95+2.79Steady2.svg
  Independent 9,6601.05-3.64Steady2.svg
  Natural Law 4,4950.49-0.98Steady2.svg
  Grey Power 2,8150.31+0.12Steady2.svg
  Against Further Immigration 1,7800.19Steady2.svg
Two-party-preferred vote
  Liberal/National Coalition 524,44557.264.5910Increase2.svg 2
  Labor 391,51642.74-4.592Decrease2.svg 2
Invalid/blank votes39,1624.080.02
Turnout959,88195.89
Registered voters1,001,006
Source: Federal Elections 1996

Tasmania

1996 Australian federal election
(Tasmania)
Flag of Tasmania.svg
  1993 2 March 1996 1998  

All 5 Tasmanian seats in the Australian House of Representatives
and 6 seats in the Australian Senate
 First partySecond party
  Keating Paul BANNER.jpg John howard.jpg
Leader Paul Keating John Howard
Party Labor Liberal/National coalition
Last election41 seats
Seats won3 seats2 seats
Seat changeDecrease2.svg 1Increase2.svg 1
Popular vote137,607139,305
Percentage44.3%44.9%
SwingDecrease2.svg 2.5Increase2.svg 2.8
TPP 51.58%48.72%
TPP swingDecrease2.svg 3.07Increase2.svg 3.07
Turnout 96.6% (CV) — Informal 2.3% [2]
PartyVotes%SwingSeatsChange
   Liberal 138,08744.46+2.422Increase2.svg 1
  National 1,2180.39+0.39
Liberal/National Coalition 139,30544.85+2.812Increase2.svg 1
  Labor 137,60744.31−2.453Decrease2.svg 1
  Greens 19,6896.34−1.58
  Democrats 12,6964.09+1.60
  Independent 1,2740.41−0.09
Total310,5715
Two-party-preferred vote
  Labor 159,85351.58−3.073Decrease2.svg 1
  Liberal/National Coalition 150,05748.42+3.072Increase2.svg 1
Invalid/blank votes7,4722.35−0.38
Turnout318,04396.58
Registered voters329,304
Source: Federal Elections 1996

|abc

Territories

Australian Capital Territory

1996 Australian federal election
(Australian Capital Territory)
Flag of the Australian Capital Territory.svg
  1993 2 March 1996 1998  

All 3 Australian Capital Territory seats in the Australian House of Representatives
and both seats in the Australian Senate
 First partySecond party
  Keating Paul BANNER.jpg John howard.jpg
Leader Paul Keating John Howard
Party Labor Coalition
Last election2 seats0 seats
Seats won3 seats0 seats
Seat changeIncrease2.svg 1Steady2.svg
Popular vote91,44778,109
Percentage47.91%40.92%
SwingDecrease2.svg 5.43Increase2.svg 6.73
TPP 55.5%45.5%
TPP swingDecrease2.svg 5.7Increase2.svg 5.7

Turnout 96.7% (CV) — Informal 2.8% [2]
PartyVotes%SwingSeatsChange
  Labor 91,44747.91–5.433Increase2.svg 1
  Liberal 78,10940.92+6.73Steady2.svg
  Greens 16,5968.70+6.97
  Natural Law 7780.41–0.39
  Independents 3,9332.06–1.21
Total190,8633Increase2.svg 1
Two-party-preferred vote
  Labor 105,32355.5–5.73Increase2.svg 1
  Liberal 84,59245.5+5.70Steady2.svg
Invalid/blank votes5,5432.82–0.53
Turnout196,40696.67
Registered voters203,170
Source: Federal Elections 1996

Northern Territory

1996 Australian federal election
(Northern Territory)
Flag of the Northern Territory.svg
  1993 2 March 1996 1998  

The one Northern Territory seat in the Australian House of Representatives
and both seats in the Australian Senate
 First partySecond party
  John howard.jpg Keating Paul BANNER.jpg
Leader John Howard Paul Keating
Party Coalition Labor
Last election0 seats1 seats
Seats won1 seats0 seats
Seat changeIncrease2.svg 1Decrease2.svg 1
Popular vote38,30236,994
Percentage45.04%43.50%
SwingIncrease2.svg 0.35Decrease2.svg 11.81
TPP 50.37%49.63%
TPP swingIncrease2.svg 5.68Decrease2.svg 5.68
1996 Australian federal election: Northern Territory [3]
PartyCandidateVotes%±%
Country Liberal Nick Dondas 38,30245.04+0.35
Labor Warren Snowdon 36,99443.50-11.81
Greens Philip Nitschke 5,3246.26+6.26
Independent Bernie Brian2,7103.19+3.19
Independent Pamela Gardiner1,7132.01+2.01
Total formal votes85,04396.61-0.29
Informal votes2,9853.39+0.29
Turnout 88,02889.10+0.30
Two-party-preferred result
Country Liberal Nick Dondas 42,63050.37+5.68
Labor Warren Snowdon 42,00349.63-5.68
Country Liberal gain from Labor Swing +5.68

See also

Notes

  1. The Australian Greens were founded in 1992, but not all local organisations immediately affiliated. The Greens total includes Australian Greens, Greens Western Australia, Victorian Greens, Tasmanian Greens, Central Coast Green Party, and Richmond/Clarence Greens.
  2. Pauline Hanson has been counted as being elected an independent. She had been disendorsed as the Liberal candidate and ran as an independent, but she remained a Liberal on the ballot paper.

Related Research Articles

1998 Australian federal election Election for the 39th Parliament of Australia

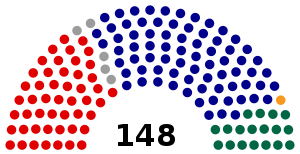
The 1998 Australian federal election was held to determine the members of the 39th Parliament of Australia. It was held on 3 October 1998. All 148 seats of the House of Representatives and 40 seats of the 76-seat Senate were up for election. The incumbent centre-right Liberal/National Coalition government led by Prime Minister John Howard of the Liberal Party and coalition partner Tim Fischer of the National Party defeated the centre-left Australian Labor Party opposition led by Opposition Leader Kim Beazley despite losing the two party preferred popular vote.

This is a list of electoral results for the Division of Bennelong in Australian federal elections from the electorate's creation in 1949 until the present.

This is a list of electoral results for the Division of Bradfield in Australian federal elections from the electorate's creation in 1949 until the present.

This is a list of electoral results for the Division of Calare in Australian federal elections from the division's creation in 1906 until the present.

This is a list of electoral results for the Division of Lowe in Australian federal elections from the division's creation in 1949 until its abolition in 2010.

This is a list of electoral results for the Division of Mackellar in Australian federal elections from the division's creation in 1949 until the present.

This is a list of electoral results for the Division of North Sydney in Australian federal elections from the electorate's creation in 1901 until the present.

This is a list of electoral results for the Division of Parramatta in Australian federal elections from the division's creation in 1901 until the present.

McEwan, an Australian Electoral Division in the Australian state of Victoria, has existed since 1984.

This is a list of electoral results for the Division of McMillan in Australian federal elections from the division's creation in 1949 until its abolition in 2019.

This is a list of electoral results for the Division of Higinbotham in Australian federal elections from the division's creation in 1949 until its abolition in 1969.

Results of the 1998 Australian federal election (House of Representatives)

The following tables show results for the Australian House of Representatives at the 1998 federal election held on 3 October 1998.

Results of the 1998 Australian federal election in Queensland Results of the 1998 Australian Election in Queensland

This is a list of electoral division results for the 1998 Australian federal election in the state of Queensland.

Results of the 1993 Australian federal election in Victoria

This is a list of electoral division results for the Australian 1993 federal election in the state of Victoria.

Results of the 1996 Australian federal election in Queensland

This is a list of electoral division results for the Australian 1996 federal election in the state of Queensland.

Results of the 1996 Australian federal election in South Australia

This is a list of electoral division results for the Australian 1996 federal election in the state of South Australia.

Results of the 1996 Australian federal election in Tasmania

This is a list of electoral division results for the Australian 1996 federal election in the state of Tasmania.

This is a list of electoral division results for the Australian 1993 federal election for the Australian Capital Territory  and the Northern Territory.

This is a list of electoral division results for the Australian 1996 federal election for the Australian Capital Territory  and the Northern Territory.

Results of the 1993 Australian federal election (House of Representatives)

The following tables show results for the Australian House of Representatives at the 1993 federal election held on 24 March 1993.

References

  1. Newman, G; Kopras, A (4 November 1996). "Federal Elections 1996" (PDF). Background Paper 6 1996-97. Parliamentary Research Service. ISSN   1037-2938 . Retrieved 10 January 2022.
  2. 1 2 3 4 5 6 7 "1996 House of Representatives". Psephos Adam Carr's Election Archive. Retrieved 10 June 2022.
  3. "1996 House of Representatives: Northern Territory". Psephos Adam Carr's Election Archive. Retrieved 22 June 2022.