Results of the 2007 Australian federal election (Senate)

Last updated

2007 Australian federal election
(Senate)
Flag of Australia (converted).svg
  2004 24 November 2007 2010  

40 of the 76 seats in the Australian Senate
39 seats needed for a majority
 First partySecond partyThird party
  Nicholas Hugh Minchin.jpg Christopher Vaughan Evans.jpg Bob Brown profile.png
Leader Nick Minchin Chris Evans Bob Brown
Party Liberal/National Coalition Labor Greens
Leader's seat South Australia Western Australia Tasmania
Seats before39284
Seats after37325
Seat changeDecrease2.svg 2Increase2.svg 4Increase2.svg 1
Popular vote5,055,0955,101,2001,144,751
Percentage39.94%40.30%9.04%
SwingDecrease2.svg 5.15%Increase2.svg 5.28%Increase2.svg 1.38%

Australian Senate (2007 election).svg
Senators elected in the 2007 federal election

Leader of the Senate before election

Nick Minchin
Liberal/National coalition

Elected Leader of the Senate

Chris Evans
Labor

The following tables show state-by-state results in the Australian Senate at the 2007 federal election, 37 Coalition (32 Liberal, four National, one CLP), 32 Labor, five Green, one Family First, and one independent, Nick Xenophon. [1] Senators are elected for six-year terms, and took their seats from 1 July 2008, but senators representing the territories have three-year terms and take their seats immediately.

Contents

Preference deals

Preferences played a crucial role in determining winners in both the House and Senate. Unlike the previous election, Labor and Australian Democrats directed preferences to the Australian Greens. In exchange, the Greens preferenced the Democrats and Labor. The Family First Party and Christian Democratic Party (Australia) directed preferences in most states to the Coalition. In turn, the Coalition preferenced both parties and also preferenced the Greens ahead of Labor. [2]

Australia

Senate (STV GV) — Turnout 95.17% (CV) — Informal 2.55% [3]
2007 Australian Senate.svg
PartyVotes%SwingSeats wonSeats heldChange
  Australian Labor Party 5,101,20040.30+5.281832Increase2.svg 4
  Liberal/National Coalition
  Liberal/National joint ticket [lower-alpha 1] 3,883,47930.68−3.55919Steady2.svg
  Liberal [lower-alpha 2] 1,110,3668.77−1.63817Decrease2.svg 2
  National [lower-alpha 3] 20,9970.17+0.0600Steady2.svg
  Country Liberal [lower-alpha 4] 40,2530.32−0.0311Steady2.svg
Coalition total 5,055,09539.94–5.151837Decrease2.svg 2
  Greens 1,144,7519.04+1.3835Increase2.svg 1
  Family First 204,7881.62–0.1401Steady2.svg
  Democrats 162,9751.29–0.8000Decrease2.svg 4
Total12,656,805  4076
Invalid/blank votes331,0092.55−1.20
Registered voters/turnout13,646,53995.17
Source: Commonwealth Election 2007

New South Wales

Elected#SenatorParty
20071 Mark Arbib  Labor
20072 Helen Coonan  Liberal
20073 Doug Cameron  Labor
20074 John Williams  National
20075 Marise Payne  Liberal
20076 Ursula Stephens  Labor
2004
20041 Bill Heffernan  Liberal
20042 Steve Hutchins  Labor
20043 Concetta Fierravanti-Wells  Liberal
20044 John Faulkner  Labor
20045 Fiona Nash  National
20046 Michael Forshaw  Labor
2007 Australian federal election: Senate, New South Wales
PartyCandidateVotes%±%
Quota 599,034
Labor 1. Mark Arbib (elected 1)
2. Doug Cameron (elected 3)
3. Ursula Stephens (elected 6)
4. Pierre Esber
5. Fiona Seaton
6. Pauline James
1,764,04042.07+5.70
Liberal/National Coalition 1. Helen Coonan (Lib) (elected 2)
2. John Williams (Nat) (elected 4)
3. Marise Payne (Lib) (elected 5)
4. Murray Lees (Nat)
5. Vicky McGahey (Lib)
6. Carolyn Currie (Lib)
1,649,01439.33-4.79
Greens 1. Kerry Nettle
2. David Shoebridge
3. Marcia Ella-Duncan
4. Jack Mundey
5. Christina Ho
6. Sandra Heilpern
353,2868.43+1.09
Christian Democrats 1. Paul Green
2. Elaine Nile
3. Allan Lotfizadeh
4. Peter Pilt
5. Bruce York
82,5601.97-0.64
Democratic Labor 1. Michael O'Donohue
2. Terence O'Donohue
52,9771.26+1.26
Shooters/Fishing and Lifestyle 1. Robert Borsak (Shooters)
2. Robert Shaw (Shooters)
3. Jim Muirhead (Shooters)
4. Andrew Hestelow (F&L)
5. Thomas Morgan (F&L)
45,9321.10+1.10
Pauline's UAP 1. Brian Burston
2. John Carter
39,8070.95+0.95
Climate Change 1. Patrice Newell
2. Karl Kruszelnicki
37,2710.89+0.89
Democrats 1. Lyn Shumack
2. David King
3. Brett Paterson
37,1930.89-1.31
Fishing Party 1. Garth Bridge
2. Stewart Paterson
27,0890.65+0.11
Family First 1. Andrew Markwell
2. Kathy Gray
25,3210.60+0.04
One Nation 1. Judith Newson
2. Andrew Webber
3. Peter Bussa
4. Andy Frew
17,3790.41-1.48
What Women Want 1. Justine Caines
2. Janette Robinson
15,8120.38+0.38
Carers Alliance 1. Marylou Carter
2. Nell Brown
3. Katrina Clark
4. Mary Mockler
14,0990.34+0.34
Liberty & Democracy 1. Terje Petersen
2. Janos Beregszaszi
7,7720.19+0.19
Climate Conservatives 1. Richard McNeall
2. James Maxfield
4,2030.10+0.10
Socialist Alliance 1. Alex Bainbridge
2. Susan Price
3. Kamala Emanuel
4. Tim Dobson
3,3510.08-0.03
Non-Custodial Parents 1. John Geremin
2. Roland Foster
2,5380.06-0.01
Senator On-Line 1. Pat Reilly
2. Berge Der Sarkissian
2,2570.05+0.05
Citizens Electoral Council 1. Ann Lawler
2. Ian McCaffrey
2,2240.05-0.01
Socialist Equality 1. Nick Beams
2. Carol Divjak
2,1390.05+0.05
Hear Our Voice 1. Toni McLennan
2. Lindsay Carroll
2,0410.05+0.05
Group J1. Ian Bryce
2. John August
2,0170.05+0.05
Group V1. Walter Tinyow
2. Maria Chan
1,2590.03+0.03
Group P1. Klaas Woldring
2. Max Bradley
9480.02+0.02
Independent Paula Nadas3940.01+0.01
Independent Jennifer Stefanac1860.00+0.00
Independent Curtis Levy790.00+0.00
Independent Silvana Nero460.00+0.00
Total formal votes4,193,23497.76+1.23
Informal votes96,2102.24-1.23
Turnout 4,289,44495.40+0.29

Both major parties finished with around 40% of the primary vote each with Labor in front. The Greens received over 8% of the primary vote. Labor won two seats on primary vote alone, narrowly missing a third seat. The Coalition also won two seats, including one to National Party of Australia candidate John Williams. Despite finishing with less than 1% of the primary vote, the Climate Change Coalition managed to place ahead of Pauline's United Australia Party, the Democrats and Family First. The Democrats and Pauline United Australia Party directed preferences to the Climate Change Coalition. Unlike in other states, Family First also directed its preferences to the Climate Change Coalition. After these preferences, the Climate Change Coalition had increased their vote from less than 1% to almost 5%. However, they still narrowly finished behind the Christian Democrats. Preferences from the Climate Change Coalition went to the Greens however they still finished behind the major parties. This led to Greens senator Kerry Nettle losing her seat. Preferences from the Christian Democrats went to the Coalition, allowing them to win their third seat with Labor winning the remaining seat. The end result was three seats each to the Coalition and Labor [4]

Victoria

Elected#SenatorParty
20071 Jacinta Collins  Labor
20072 Mitch Fifield  Liberal
20073 Gavin Marshall  Labor
20074 Helen Kroger  Liberal
20075 Scott Ryan  Liberal
20076 David Feeney  Labor
2004
20041 Michael Ronaldson  Liberal
20042 Kim Carr  Labor
20043 Julian McGauran  Liberal
20044 Stephen Conroy  Labor
20045 Judith Troeth  Liberal
20046 Steve Fielding   Family First
2007 Australian federal election: Senate, Victoria
PartyCandidateVotes%±%
Quota 454,625
Labor 1. Jacinta Collins (elected 1)
2. Gavin Marshall (elected 3)
3. David Feeney (elected 6)
4. Marg Lewis
1,327,07641.70+5.58
Liberal/National Coalition 1. Mitch Fifield (Lib) (elected 2)
2. Helen Kroger (Lib) (elected 4)
3. Scott Ryan (Lib) (elected 5)
4. Simon Swayn (Nat)
1,257,14939.50-4.60
Greens 1. Richard Di Natale
2. Jenny O'Connor
3. Alexandra Bhathal
4. Jim Reiher
5. Hoa Pham
6. Emma Henley
320,75910.08+1.28
Family First 1. Gary Plumridge
2. Miriam Rawson
3. Monique Podbury
4. Chris Willis
5. Clare Heath
6. Ann Bown Seeley
80,1002.52+0.64
Democrats 1. Lyn Allison
2. Greg Chipp
3. Jo McCubbin
52,5961.65-0.21
Democratic Labor 1. John Mulholland
2. Gerry Flood
3. Pat La Manna
4. Teresa Evelyn-Liardet
5. Ken Wells
6. Paul Crea
32,9301.03-0.91
Climate Change 1. Ainslie Howard
2. Sashikala Rozairo
24,7590.78+0.78
Shooters 1. Brett Parker
2. Matt Graham
21,3980.67+0.67
What Women Want 1. Madeleine Love
2. Robyn Thompson
14,0280.44+0.44
One Nation 1. Nick Steel
2. Daniel Shore
13,3540.42-0.30
Christian Democrats 1. Ewan McDonald
2. Dallas Clarnette
7,1000.22-0.12
Group I1. Joseph Toscano
2. Jude Pierce
5,6950.18+0.18
Climate Conservatives 1. Steve Raskovy
2. Viesha Lewand
4,2160.13+0.13
Carers Alliance 1. Junelle Rhodes
2. Peter Gibilisco
3. Patricia Karadimos
3,9010.12+0.12
Senator On-Line 1. Robert Rose
2. Jeremy Barrett
3,1060.10+0.10
Liberty & Democracy 1. Steve Clancy
2. Geoff Saw
3,0440.10+0.10
Socialist Alliance 1. Margarita Windisch
2. Jeremy Smith
2,5350.08-0.08
Socialist Equality 1. Peter Byrne
2. Tania Baptist
2,4030.08+0.08
Citizens Electoral Council 1. Rachel Affleck
2. Katherine Isherwood
1,6970.05-0.49
Non-Custodial Parents 1. Brendan Hall
2. John Zabaneh
1,5110.05-0.06
Group P1. John Perkins
2. Andrew Conway
1,2380.04+0.04
Group T1. Joseph Kaliniy
2. Koulla Mesaritis
5220.02+0.02
Group V1. Tony Klein
2. Amanda Klein
5030.02+0.02
Independent Norman Walker3830.01+0.01
Independent Tejay Sener1850.01+0.01
Independent Darryl O'Bryan1330.00+0.00
One Nation Llewellyn Groves480.00+0.00
Total formal votes3,182,36996.72+1.85
Informal votes107,8503.28-1.85
Turnout 3,290,21995.60+0.17

Labor once again narrowly finished ahead of the Coalition on primary votes with around 40% each. Both parties won two seats each on primary vote alone, with another two seats yet to be won. The Greens finished with just over 10% of the vote. After preferences from small minor parties, Labor managed to stay ahead of the Greens and Coalition. Preferences from the Democrats allowed the Greens to go ahead of the Coalition and close to the required number of votes to win a seat. However, preferences from Family First allowed the Coalition to win a third seat whilst Labor narrowly won the remaining seat over the Greens. The end result was three seats each to the Coalition and Labor [5]

Queensland

Elected#SenatorParty
20071 Ian Macdonald  Liberal
20072 John Hogg  Labor
20073 Sue Boyce  Liberal
20074 Claire Moore  Labor
20075 Ron Boswell  National
20076 Mark Furner  Labor
2004
20041 Brett Mason  Liberal
20042 Jan McLucas  Labor
20043 George Brandis  Liberal
20044 Joe Ludwig  Labor
20045 Barnaby Joyce  National
20043 Russell Trood  Liberal
2007 Australian federal election: Senate, Queensland
PartyCandidateVotes%±%
Quota 345,559
Liberal/National Coalition 1. Ian Macdonald (Lib) (elected 1)
2. Sue Boyce (Lib) (elected 3)
3. Ron Boswell (Nat) (elected 5)
4. Mark Powell (Lib)
5. David Goodwin (Nat)
6. Scott Buchholz (Nat)
977,31640.40-4.50
Labor 1. John Hogg (elected 2)
2. Claire Moore (elected 4)
3. Mark Furner (elected 6)
4. Diana O'Brien
948,14539.20+7.55
Greens 1. Larissa Waters
2. Anja Light
3. Darryl Rosin
177,0637.32+1.92
Pauline's UAP 1. Pauline Hanson
2. David Saville
101,4614.19+4.19
Family First 1. Jeff Buchanan
2. Beryl Spencer
3. Merlin Manners
4. Cathy Eaton
5. Shaun Hart
6. Elizabeth Benson-Scott
53,2492.20-1.17
Democrats 1. Andrew Bartlett
2. Sharon Neill
45,5841.88-0.32
Fishing Party 1. Bob Smith
2. Elizabeth Stocker
20,2900.84-0.44
Fishing and Lifestyle 1. Kevin Collins
2. Dave Donald
19,1310.79+0.79
What Women Want 1. Anne Bousfield
2. Sonya Beutel
17,3700.72+0.72
Shooters 1. Paul Feeney
2. Allen Hrstich
12,8450.53+0.53
Climate Change 1. Phil Johnson
2. Steve Posselt
8,8180.36+0.36
Democratic Labor 1. Noel Jackson
2. Brian Dowling
72650.30+0.30
Christian Democrats 1. Linda Brice
2. Malcolm Brice
6,2890.26+0.26
Carers Alliance 1. Felicity Maddison
2. Robert Gow
4,8220.20+0.20
One Nation 1. Ian Nelson
2. Lew Arroita
4,1740.17-2.97
Liberty & Democracy 1. John Humphreys
2. Joseph Clark
3,8900.16+0.16
Socialist Alliance 1. Sam Watson
2. Amelia Taylor
1,9410.08-0.02
Group K1. Richard Hackett-Jones
2. John Rivett
1,7380.07+0.07
Group X1. James Baker
2. Louise Fitzgerald-Baker
1,5060.06+0.06
Non-Custodial Parents 1. Bill Healey
2. Doug Thompson
1,3900.06-0.13
Senator On-Line 1. Ben Peake
2. Sharon Bateson
1,2510.05+0.05
Citizens Electoral Council 1. Jan Pukallus
2. Maurice Hetherington
1,1550.05-0.10
Group N1. David Couper
2. Michael Brown
8260.03+0.03
Independent 1. Katrina Alberts
2. Martin Rady
4930.02+0.02
Independent John Duggan4060.02+0.02
Independent Robin Petersen1980.01+0.01
Independent Leo DeMarchi1440.01+0.01
Independent James Reid700.00+0.00
Independent Marsileo Traversari520.00+0.00
Independent Pilly Low250.00+0.00
Total formal votes2,418,90797.66+0.45
Informal votes57,9122.34-0.45
Turnout 2,476,81994.81+0.68

The Coalition narrowly finished ahead of Labor on primary vote with around 40% each. The Greens finished with over 7% and Pauline's United Australia party with over 4%. The Coalition and Labor both won 2 seats each on primary vote alone. Preferences from the Democrats allowed the Greens to narrowly go ahead of Labor. Family first preferences were enough for Nationals candidate Ron Boswell to be re-elected and win a third seat for the Coalition. Pauline's United Australia party directed preferences to Labor which allowed them to win the final seat. The final result was three seats each to Labor and the Coalition. [6]

Western Australia

Elected#SenatorParty
20071 David Johnston  Liberal
20072 Louise Pratt  Labor
20073 Alan Eggleston  Liberal
20074 Mark Bishop  Labor
20075 Michaelia Cash  Liberal
20076 Scott Ludlam  Greens
2001
20041 Chris Ellison  Liberal
20042 Chris Evans  Labor
20043 Ian Campbell  Liberal
20044 Glenn Sterle  Labor
20045 Judith Adams  Liberal
20046 Rachel Siewert  Greens
2007 Australian federal election: Senate, Western Australia
PartyCandidateVotes%±%
Quota 171,822
Liberal 1. David Johnston (elected 1)
2. Alan Eggleston (elected 3)
3. Michaelia Cash (elected 5)
4. Michael Mischin
5. Jane Mouritz
6. Matt Brown
555,86846.22-3.12
Labor 1. Louise Pratt (elected 2)
2. Mark Bishop (elected 4)
3. Ruth Webber
433,04636.00+3.48
Greens 1. Scott Ludlam (elected 6)
2. Alison Xamon
3. Brenda Roy
111,8139.30+1.24
Christian Democrats 1. Gerard Goiran
2. Peter Watt
21,1791.76-0.12
National 1. Tony Crook
2. Wendy Duncan
17,3651.44+0.58
Democrats 1. Erica Lewin
2. Rob Olver
3. Don Hoddy
12,6041.05-0.95
One Nation 1. James Hopkinson
2. Ron McLean
11,6230.97-1.48
Democratic Labor 1. Bob Boulger
2. Eric Miller
11,3900.95+0.95
Family First 1. Linda Rose
2. Cathie Fabian
3. Steve Fuhrmann
10,3410.86+0.01
What Women Want 1. Meryki Basden
2. Saywood Lane
3,5330.29+0.29
Climate Change 1. Gary Warden
2. Sarah Bishop
3,4610.29+0.29
Group P1. Graeme Campbell
2. John Fischer
3. Russell Graham
4. Geoff Gibson
1,6210.13+0.13
Carers Alliance 1. Thomas Hoyer
2. Shirley Primeau
1,5710.13+0.13
Climate Conservatives 1. Gerard Kettle
2. Shirley Anton
1,5690.13+0.13
Citizens Electoral Council 1. Jean Robinson
2. Stuart Smith
1,0020.08-0.11
Non-Custodial Parents 1. Geoff Dixon
2. Mike Ward
9460.08-0.07
Socialist Alliance 1. Trent Hawkins
2. Julie Gray
9280.08+0.08
Senator On-Line 1. Daniel Mayer
2. Zoe Lamont
8240.07+0.07
Group M1. Eric Wynne
2. Kevin Fitzgerald
8190.07+0.07
Liberty & Democracy 1. Peter Whelan
2. Daniel Parker
5910.05+0.05
Independent Richard McNaught2910.02+0.02
Group Q1. Jennifer Armstrong
2. Michael Tan
2710.02+0.02
Independent Edward Dabrowski940.01+0.01
Total formal votes1,202,75097.58+1.12
Informal votes29,7972.42-1.12
Turnout 1,232,54793.86+0.20

Unlike in other states, the Liberal Party of Australia and Nationals were not on a joint ticket. However, the Liberals finished far ahead of Labor in the primary vote with a 10% margin between them. The Greens finished with over 9% of the vote. The Liberals won three seats on primary vote alone whilst Labor won two. After these seats were distributed, the Greens were ahead of all parties. The Democratic Labor Party distributed preferences to the Christian Democrats, allowing them to go ahead of the Liberal party. Preferences from the Liberal Party allowed the Christian Democrats to go ahead of Labor and narrowly behind the Greens. However, preferences from Labor led to Greens candidate Scott Ludlam winning the final seat. The end result was three seats to the Liberals, two to Labor and one to the Greens [7]

South Australia

Elected#SenatorParty
20071 Don Farrell  Labor
20072 Cory Bernardi  Liberal
20073 Nick Xenophon  Independent
20074 Penny Wong  Labor
20075 Simon Birmingham  Liberal
20076 Sarah Hanson-Young  Greens
2004
20041 Nick Minchin  Liberal
20042 Anne McEwen  Labor
20043 Amanda Vanstone  Liberal
20044 Annette Hurley  Labor
20045 Mary Jo Fisher  Liberal
20046 Dana Wortley  Labor
2007 Australian federal election: Senate, South Australia
PartyCandidateVotes%±%
Quota 143,830
Labor 1. Don Farrell (elected 1)
2. Penny Wong (elected 4)
3. Cath Perry
358,61535.62+0.13
Liberal 1. Cory Bernardi (elected 2)
2. Simon Birmingham (elected 5)
3. Grant Chapman
4. Maria Kourtesis
347,25634.49-13.00
Group S1. Nick Xenophon (elected 3)
2. Roger Bryson
148,78914.78+14.78
Greens 1. Sarah Hanson-Young (elected 6)
2. Nikki Mortier
3. Matt Rigney
65,3226.49-0.11
Family First 1. Tony Bates
2. Toni Turnbull
3. Colin Gibson
29,1142.89-1.09
Democratic Labor 1. Garry Hardy
2. David McCabe
9,3430.93+0.93
Democrats 1. Ruth Russell
2. Max Baumann
3. Richard Way
8,9080.88-1.51
One Nation 1. Mark Aldridge
2. David Dwyer
6,1780.61-0.53
Fishing and Lifestyle 1. Neil Armstrong
2. Paul Tippins
5,4130.54+0.54
What Women Want 1. Emma Neumann
2. Morag McIntosh
4,1140.41+0.41
Shooters 1. John Hahn
2. Basil Borun
3,9730.39+0.39
National 1. Rob Howard
2. Mark Cuthbertson
3,6320.36-0.04
Climate Change 1. Colin Endean
2. Vidas Kubilius
3,1310.31+0.31
Christian Democrats 1. Bruno Colangelo
2. Noelene Hunt
1,4860.15+0.15
Liberty & Democracy 1. David McAlary
2. Mark Hill
7980.08+0.08
Socialist Alliance 1. Renfrey Clarke
2. Liah Lazarou
7700.08-0.05
Senator On-Line 1. Joel Clark
2. Courtney Clarke
6100.06+0.06
Group B1. Brian Paterson
2. A. Brook
5770.06+0.06
Citizens Electoral Council 1. Martin Vincent
2. Paul Siebert
2670.03+0.03
Independent Michelle Drummond1010.01+0.01
Independent Stewart Glass730.01+0.01
Total formal votes1,006,80997.62+1.15
Informal votes24,5112.38-1.15
Turnout 1,031,32095.83+0.47

Both major parties finished with around 35% each, with Independent Nick Xenophon at almost 15% followed by the Greens on over 6%. The Liberals and Labor won two seats each whilst Xenophon won a seat on primary vote alone. Preferences from the What Women Want (Australia) Party and the Climate Change Coalition allowed the Greens to go ahead of all parties. This was followed by preferences from the Democratic Labor Party and Family First going to the Liberals, which allowed the Coalition to go ahead of the Greens. However, the Greens managed to crucially stay ahead of Labor, which led to preferences from Labor going to the Greens. This was enough for Greens candidate Sarah Hanson-Young winning the remaining seat. The final result was two seats to the Liberals, two seats to Labor, one seat to Xenophon and one seat to the Greens [8]

Tasmania

Elected#SenatorParty
20071 Nick Sherry  Labor
20072 Richard Colbeck  Liberal
20073 Bob Brown  Greens
20074 Carol Brown  Labor
20075 David Bushby  Liberal
20076 Catryna Bilyk  Labor
2004
20041 Eric Abetz  Liberal
20042 Kerry O'Brien  Labor
20043 Guy Barnett  Liberal
20044 Helen Polley  Labor
20045 Stephen Parry  Liberal
20046 Christine Milne  Greens
2007 Australian federal election: Senate, Tasmania
PartyCandidateVotes%±%
Quota 46,693
Labor 1. Nick Sherry (elected 1)
2. Carol Brown (elected 4)
3. Catryna Bilyk (elected 6)
131,05540.10+6.56
Liberal 1. Richard Colbeck (elected 2)
2. David Bushby (elected 5)
3. Don Morris
122,20337.39-8.74
Greens 1. Bob Brown (elected 3)
2. Andrew Wilkie
3. Sophie Houghton
4. Scott Jordan
59,25418.13+4.84
Family First 1. Jacquie Petrusma
2. Andrew Bennett
3. Betty Roberts
6,6632.04-0.34
What Women Want 1. Debra Cashion
2. Belinda Gleeson
2,5400.78+0.78
Democratic Labor 1. Pat Crea
2. Joan Shackcloth
2,0610.63+0.63
Group G1. Dino Ottavi
2. Mick Cook
3. Chris Smallbane
1,3980.43+0.03
Group C1. Steve Martin
2. Karley Nelson
7890.24-0.12
Citizens Electoral Council 1. Caroline Larner
2. Michael Phibbs
3130.10-0.06
Liberty & Democracy 1. Bede Ireland
2. Luke Hamilton
3020.09+0.09
Group H1. Robyn Doyle
2. David Hammond
2680.08+0.08
Total formal votes326,84697.37+0.74
Informal votes8,8302.63-0.74
Turnout 335,67695.98+0.08

Labor finished ahead of the Liberals with around 40% of the vote each, followed by the Greens with over 18%. Labor and the Liberals each won two seats on primary vote alone whilst the Greens won one on primary vote. Preferences from the Greens led to Labor winning the remaining seat. The final result was three seats to Labor, two seats to the Liberals and one seat to the Greens. [9]

Territories

Australian Capital Territory

Elected#SenatorParty
20071 Kate Lundy  Labor
20072 Gary Humphries  Liberal
2007 Australian federal election: Senate, Australian Capital Territory
PartyCandidateVotes%±%
Quota 75,108
Labor 1. Kate Lundy (elected 1)
2. Peter Conway
92,01840.84-0.26
Liberal 1. Gary Humphries (elected 2)
2. Jacqui Myers
77,05834.20-3.67
Greens 1. Kerrie Tucker
2. Elena Kirschbaum
48,38421.47+5.11
Democrats 1. Norvan Vogt
2. Anthony David
4,1411.84-0.30
What Women Want 1. Emma Davidson
2. Shannon Morris
1,4060.62+0.62
Climate Change 1. Michael Fullam-Stone
2. Andrew Gee
1,3230.59+0.59
Liberty & Democracy 1. Lisa Milat
2. Chris Textor
5450.24+0.24
Nuclear Disarmament 1. Michael Denborough
2. Erica Denborough
4460.20+0.20
Total formal votes225,32198.30+0.76
Informal votes3,9051.70-0.76
Turnout 229,22696.00+0.79

Northern Territory

Elected#SenatorParty
20071 Trish Crossin  Labor
20072 Nigel Scullion  CLP
2007 Australian federal election: Senate, Northern Territory
PartyCandidateVotes%±%
Quota 33,524
Labor 1. Trish Crossin (elected 1)
2. Kim Hill
47,20546.94+5.57
Country Liberal 1. Nigel Scullion (elected 2)
2. Bernadette Wallace
40,25340.03-5.37
Greens 1. Alan Tyley
2. Gregory Goodluck
8,8708.82+1.22
Citizens Electoral Council 1. Peter Flynn
2. Vernon Work
2,0192.01+2.01
Democrats 1. Duncan Dean
2. Joe Faggion
1,9491.94-2.79
Independent Bernardine Atkinson2730.27
Total formal votes100,56998.06+1.18
Informal votes1,9941.94-1.18
Turnout 102,56386.88+2.47

See also

Notes

  1. The Liberal and National parties ran a joint ticket in New South Wales, Victoria and Queensland. It includes the four senators from Queensland who ran on separate tickets at the 2004 election.
  2. The Liberals-only ticket ran in Western Australia, South Australia, Tasmania and the Australian Capital Territory.
  3. The Nationals-only ticket ran in Western Australia and South Australia.
  4. There are no Liberal or National parties in the Northern Territory, with the Country Liberal Party being the sole the centre-right coalition party .
  5. The Shooters Party total includes the result for a joint ticket with the Australian Fishing and Lifestyle Party in New South Wales (45,932 votes).
  6. The independenant senator was Nick Xenophon (South Australia).

Related Research Articles

<span class="mw-page-title-main">2001 Australian federal election</span> Election for the 40th Parliament of Australia

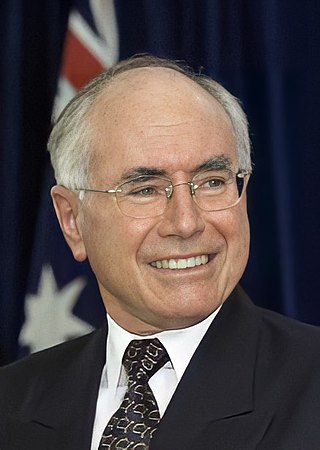
The 2001 Australian federal election was held in Australia on 10 November 2001. All 150 seats in the House of Representatives and 40 seats in the 76-member Senate were up for election. The incumbent Liberal Party of Australia led by Prime Minister of Australia John Howard and coalition partner the National Party of Australia led by John Anderson defeated the opposition Australian Labor Party led by Kim Beazley.

<span class="mw-page-title-main">2004 Australian federal election</span> Election for the 41st Parliament of Australia

The 2004 Australian federal election was held in Australia on 9 October 2004. All 150 seats in the House of Representatives and 40 seats in the 76-member Senate were up for election. The incumbent Liberal Party of Australia led by Prime Minister of Australia John Howard and coalition partner the National Party of Australia led by John Anderson defeated the opposition Australian Labor Party led by Mark Latham.

<span class="mw-page-title-main">1996 Australian federal election</span> Election

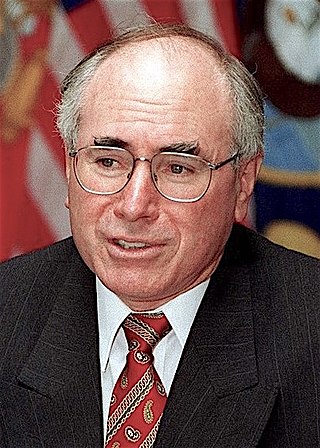
The 1996 Australian federal election was held to determine the members of the 38th Parliament of Australia. It was held on 2 March 1996. All 148 seats of the House of Representatives and 40 seats of the 76-seat Senate were up for election. The centre-right Liberal/National Coalition led by Opposition Leader John Howard of the Liberal Party and coalition partner Tim Fischer of the National Party defeated the incumbent centre-left Australian Labor Party government led by Prime Minister Paul Keating in a landslide victory.

<span class="mw-page-title-main">Family First Party</span> Political party in Australia

The Family First Party was a conservative political party in Australia which existed from 2002 to 2017. It was founded in South Australia where it enjoyed its greatest electoral support. Since the demise of the Australian Conservatives into which it merged, it has been refounded in that state as the Family First Party (2021), where it contested the state election in 2022, but failed to win a seat.

<span class="mw-page-title-main">Division of Mayo</span> Australian federal electoral division

The Division of Mayo is an Australian electoral division located to the east and south of Adelaide, South Australia. Created in the state redistribution of 3 September 1984, the division is named after Helen Mayo, a social activist and the first woman elected to an Australian University Council. The 9,315 km² rural seat covers an area from the Barossa Valley in the north to Cape Jervis in the south. Taking in the Adelaide Hills, Fleurieu Peninsula and Kangaroo Island regions, its largest population centre is Mount Barker. Its other population centres are Aldgate, Bridgewater, Littlehampton, McLaren Vale, Nairne, Stirling, Strathalbyn and Victor Harbor, and its smaller localities include American River, Ashbourne, Balhannah, Brukunga, Carrickalinga, Charleston, Cherry Gardens, Clarendon, Crafers, Cudlee Creek, Currency Creek, Delamere, Echunga, Forreston, Goolwa, Gumeracha, Hahndorf, Houghton, Inglewood, Kersbrook, Kingscote, Langhorne Creek, Lobethal, Macclesfield, McLaren Flat, Meadows, Middleton, Milang, Mount Compass, Mount Pleasant, Mount Torrens, Mylor, Myponga, Normanville, Norton Summit, Oakbank, Penneshaw, Piccadilly, Port Elliot, Second Valley, Springton, Summertown, Uraidla, Willunga, Woodchester, Woodside, Yankalilla, and parts of Birdwood, Old Noarlunga and Upper Sturt.

<span class="mw-page-title-main">2006 South Australian state election</span>

The state election for the 51st Parliament of South Australia was held in the Australian state of South Australia on 18 March 2006 to elect all members of the South Australian House of Assembly and 11 members of the South Australian Legislative Council. The election was conducted by the independent State Electoral Office.

<span class="mw-page-title-main">Greens South Australia</span> Political party in Australia

Australian Greens SA is a green political party located in the Australian state of South Australia. It is a member of the federation of the Australian Greens party.

<span class="mw-page-title-main">Queensland Greens</span> Political party in Australia

The Queensland Greens is a Green party in Queensland, Australia, and a state member of the Australian Greens. The party is currently represented in all three levels of government, by Larissa Waters and Penny Allman-Payne in the federal Senate; Stephen Bates, Max Chandler-Mather, and Elizabeth Watson-Brown in the House of Representatives; Michael Berkman and Amy MacMahon in the state Legislative Assembly; and Jonathan Sriranganathan in Brisbane City Council.

<span class="mw-page-title-main">1990 Australian federal election</span> Election

The 1990 Australian federal election was held in Australia on 24 March 1990. All 148 seats in the House of Representatives and 40 seats in the 76-member Senate were up for election. The incumbent Australian Labor Party led by Bob Hawke defeated the opposition Liberal Party of Australia led by Andrew Peacock with coalition partner the National Party of Australia led by Charles Blunt despite losing the nationwide popular and two-party-preferred vote. The election saw the reelection of a Hawke government, the fourth successive term.

<span class="mw-page-title-main">2007 New South Wales state election</span> State election for New South Wales, Australia in March 2007

Elections for the 54th Parliament of New South Wales were held on Saturday, 24 March 2007. The entire Legislative Assembly and half of the Legislative Council was up for election. The Labor Party led by Morris Iemma won a fourth four-year term against the Liberal-National coalition led by Peter Debnam.

<span class="mw-page-title-main">Nick Xenophon</span> Australian politician (born 1959)

Nick Xenophon is an Australian politician and lawyer who was a Senator for South Australia from 2008 to 2017. He was the leader of two political parties: Nick Xenophon Team federally, and Nick Xenophon's SA-BEST in South Australia.

The Climate Change Coalition (CCC), briefly known as 4Change, was an Australian political party, which was formed in 2007 with a view to accelerate action by politicians from all parties on global warming and climate change. Its position on working towards addressing climate change stressed cooperation with big business in order to achieve significant progress on the issue. The party therefore advocated a close working relationship between environmentalists and the business community. The CCC was registered as a political party with the Australian Electoral Commission (AEC) on 4 September 2007 and deregistered on 25 March 2010.

<span class="mw-page-title-main">2010 Australian federal election</span> Election for the 43rd Parliament of Australia

The 2010 Australian federal election was held on Saturday, 21 August 2010 to elect members of the 43rd Parliament of Australia. The incumbent centre-left Australian Labor Party led by Prime Minister Julia Gillard won a second term against the opposition centre-right Liberal Party of Australia led by Opposition Leader Tony Abbott and Coalition partner the National Party of Australia, led by Warren Truss, after Labor formed a minority government with the support of three independent MPs and one Australian Greens MP.

<span class="mw-page-title-main">2008 Mayo by-election</span>

The 2008 Mayo by-election was held for the Australian House of Representatives seat of Mayo, located in Adelaide, South Australia, on 6 September 2008, following the retirement of Liberal Party MP and former Liberal leader Alexander Downer. The by-election was held on the same day as the Lyne by-election, and the Western Australian state election.

<span class="mw-page-title-main">2013 Australian federal election</span> Election for the 44th Parliament of Australia

The 2013 Australian federal election to elect the members of the 44th Parliament of Australia took place on 7 September 2013. The centre-right Liberal/National Coalition opposition led by Opposition leader Tony Abbott of the Liberal Party of Australia and Coalition partner the National Party of Australia, led by Warren Truss, defeated the incumbent centre-left Labor Party government of Prime Minister Kevin Rudd in a landslide. Labor had been in government for six years since being elected in the 2007 election. This election marked the end of the Rudd-Gillard-Rudd Labor government and the start of the 9 year long Abbott-Turnbull-Morrison Liberal-National Coalition government. Abbott was sworn in by the Governor-General, Quentin Bryce, as Australia's new Prime Minister on 18 September 2013, along with the Abbott Ministry. The 44th Parliament of Australia opened on 12 November 2013, with the members of the House of Representatives and territory senators sworn in. The state senators were sworn in by the next Governor-General Peter Cosgrove on 7 July 2014, with their six-year terms commencing on 1 July.

<span class="mw-page-title-main">Results of the 2010 Australian federal election (Senate)</span> Australian federal election results

The following tables show state-by-state results in the Australian Senate at the 2010 federal election. Senators total 34 Coalition, 31 Labor, nine Green, one Democratic Labor Party, and one independent, Nick Xenophon. New Senators took their places from 1 July 2011.

<span class="mw-page-title-main">Results of the 2004 Australian federal election (Senate)</span> Australian federal election results

The following tables show state-by-state results in the Australian Senate at the 2004 federal election. Senators total 37 coalition, 28 Labor, four Green, one Family First, two non-coalition National and four Democrats. Senator terms are six years, and took their seats from 1 July 2005, except the territories who took their seats immediately.

<span class="mw-page-title-main">Results of the 2013 Australian federal election (Senate)</span> Australian federal election results

The following tables show state-by-state results in the Australian Senate at the 2013 Australian federal election.

Centre Alliance, formerly known as the Nick Xenophon Team (NXT), is a centrist political party in Australia based in the state of South Australia. It currently has one representative in the Parliament, Rebekha Sharkie in the House of Representatives.

<span class="mw-page-title-main">Results of the 2016 Australian federal election (Senate)</span> Australian federal election results

The 2016 Australian federal election in the Senate was part of a double dissolution election held on Saturday 2 July to elect all 226 members of the 45th Parliament of Australia, after an extended eight-week official campaign period. It was the first double dissolution election since the 1987 election and the first under a new voting system for the Senate that replaced group voting tickets with optional preferential voting.

References