Results of the 2007 Australian federal election in Western Australia

Last updated

2007 Australian federal election
(Western Australia)
Flag of Western Australia.svg
  2004 24 November 2007 2010  

All 15 Western Australian seats in the Australian House of Representatives
and 6 seats in the Australian Senate
 First partySecond party
  PMincoffs.jpg Kevin Rudd official portrait.jpg
Leader John Howard Kevin Rudd
Party Liberal/National coalition Labor
Last election10 seats5 seats
Seats won 11 seats4 seats
Seat changeIncrease2.svg 1Decrease2.svg 1
Popular vote558,824433,342
Percentage47.45%36.80%
SwingDecrease2.svg 1.24Increase2.svg 2.05
TPP 53.26%46.74%
TPP swingDecrease2.svg 2.14Increase2.svg 2.14

Map72007.gif
Electoral divisions: Western Australia

This is a list of electoral division results for the 2007 Australian federal election in the state of Western Australia. [1] [2] [3]

Contents

Overall results

Electoral divisions: Western Australia Map72007.gif
Electoral divisions: Western Australia
Turnout 93.26% (CV) — Informal 3.85% [1]
PartyVotes%SwingSeatsChange
  Liberal 545,36546.31–1.8211Increase2.svg 1
  Labor 433,34236.80+2.054Decrease2.svg 1
  Greens 105,1068.93+1.26
  Christian Democrats 24,8382.11–0.14
  Family First 14,2151.21+0.97
  One Nation 13,5291.15–1.37
  National 13,4591.14+0.58
  Citizens Electoral Council 3,1150.26–0.34
  Liberty and Democracy Party 2,7300.23+0.23
  Socialist Alliance 1,1410.10–0.05
  What Women Want 5900.05+0.05
  Socialist Equality 1570.01+0.01
  Independents 19,9501.69+0.34
Total1,177,537  15
Two-party-preferred vote
  Liberal 627,21153.26–2.1411Increase2.svg 1
  Labor 550,32646.74+2.144Decrease2.svg 1
Invalid/blank votes47,1523.85−1.47
Registered voters/turnout1,313,20193.26
Source: Commonwealth Election 2007

Labor to Liberal: Cowan, Swan

Liberal to Labor: Hasluck. [4]

Results by division

Brand

2007 Australian federal election: Brand
PartyCandidateVotes%±%
Labor Gary Gray 38,13146.15−0.94
Liberal Phil Edman 31,88238.58−1.31
Greens Dawn Jecks7,1108.60+3.77
Christian Democrats Brent Tremain2,0612.49+0.36
Family First Andrew Newhouse1,4821.79+1.79
One Nation Robin Scott 1,3211.60−1.16
Liberty & Democracy Huw Grossmith3500.42+0.42
Citizens Electoral Council Rob Totten2950.36−0.64
Total formal votes82,63296.10+1.90
Informal votes3,3543.90−1.90
Turnout 85,98693.50+0.09
Two-party-preferred result
Labor Gary Gray 45,95955.62+0.97
Liberal Phil Edman 36,67344.38−0.97
Labor hold Swing +0.97

Canning

2007 Australian federal election: Canning [3]
PartyCandidateVotes%±%
Liberal Don Randall 42,63949.70−3.04
Labor John Hughes31,69936.95+4.07
Greens Denise Hardie6,3967.45+2.40
Christian Democrats Kevin Swarts2,4272.83+0.42
One Nation Brian Deane1,2641.47−1.26
Family First Rodney Grasso1,1121.30+0.29
Citizens Electoral Council Brian McCarthy2610.30−0.56
Total formal votes85,79896.70+2.41
Informal votes2,9253.30−2.41
Turnout 88,72393.71−0.07
Two-party-preferred result
Liberal Don Randall 47,68955.58−3.96
Labor John Hughes38,10944.42+3.96
Liberal hold Swing -3.96

Cowan

2007 Australian federal election: Cowan
PartyCandidateVotes%±%
Liberal Luke Simpkins 38,87245.81+1.42
Labor Liz Prime35,63341.99−1.88
Greens Johannes Herrmann4,7785.63+0.04
Christian Democrats Martin Firth1,5841.87−0.58
Family First Rhonda Hamersley1,4521.71+1.71
Liberty & Democracy Ken Lee1,0031.18+1.18
One Nation Dave Tierney7830.92−1.09
Independent Norm Ramsay5580.66+0.66
Citizens Electoral Council Roger Blakeway1950.23−0.14
Total formal votes84,85895.84+0.85
Informal votes3,6794.16−0.85
Turnout 88,53794.79+0.62
Two-party-preferred result
Liberal Luke Simpkins 43,88351.71+2.49
Labor Liz Prime40,97548.29−2.49
Liberal gain from Labor Swing +2.49

Curtin

2007 Australian federal election: Curtin
PartyCandidateVotes%±%
Liberal Julie Bishop 46,91259.27−0.32
Labor Peter Grant19,41924.53+0.78
Greens Lee Hemsley10,64913.45+1.97
Christian Democrats Gail Forder1,0041.27−0.41
Independent Shahar Helel4450.56+0.56
Family First Bev Custers3940.50+0.50
One Nation Albert Caine3290.42−0.56
Total formal votes79,15298.09+1.61
Informal votes1,5421.91−1.61
Turnout 80,69493.72+0.60
Two-party-preferred result
Liberal Julie Bishop 50,32063.57−1.05
Labor Peter Grant28,83236.43+1.05
Liberal hold Swing −1.05

Forrest

2007 Australian federal election: Forrest
PartyCandidateVotes%±%
Liberal Nola Marino 38,92845.40−8.02
Labor Peter Macfarlane25,88330.18+2.25
Independent Noel Brunning 9,92411.57+11.57
Greens Kingsley Gibson7,1508.34−0.11
Christian Democrats John Lewis1,6431.92+0.32
Family First Leighton Knoll1,1501.34−0.31
One Nation Jodie Yardley9281.08−2.36
Citizens Electoral Council Ian Tuffnell1440.17−0.26
Total formal votes85,75096.67+2.17
Informal votes2,9543.33= −2.17
Turnout 88,70494.69+0.54
Two-party-preferred result
Liberal Nola Marino 47,87155.83−4.62
Labor Peter Macfarlane37,87944.17+4.62
Liberal hold Swing -4.62

Fremantle

2007 Australian federal election: Fremantle
PartyCandidateVotes%±%
Labor Melissa Parke 36,10245.18+0.60
Liberal John Jamieson28,04235.10−0.84
Greens Steve Walker11,64514.57+2.79
Christian Democrats Bill Heggers1,3761.72−0.38
Family First Andriette du Plessis1,1451.43+1.43
One Nation Sue Bateman9881.24−1.08
Socialist Alliance Sam Wainwright3610.45−0.03
Citizens Electoral Council Paul Ellison2420.30−0.80
Total formal votes79,90195.75+2.60
Informal votes3,5484.25−2.60
Turnout 83,44993.75+0.55
Two-party-preferred result
Labor Melissa Parke 47,25359.14+1.38
Liberal John Jamieson32,64840.86−1.38
Labor hold Swing +1.38

Hasluck

2007 Australian federal election: Hasluck
PartyCandidateVotes%±%
Liberal Stuart Henry 31,54142.94−2.43
Labor Sharryn Jackson 30,47141.48+3.19
Greens Jane Bremmer6,2588.52+1.66
Christian Democrats Rob Merrells2,2293.03−0.07
One Nation Bill Gaugg1,1211.53−1.84
Family First Stephen Bolt8631.17+1.17
Citizens Electoral Council Neil Vincent6870.94−0.34
Liberty & Democracy Siou Hong Chia2920.40+0.40
Total formal votes73,46295.58+0.56
Informal votes3,3974.42−0.56
Turnout 76,85993.35−0.14
Two-party-preferred result
Labor Sharryn Jackson 37,65851.26+3.08
Liberal Stuart Henry 35,80548.74−3.08
Labor gain from Liberal Swing +3.08

Kalgoorlie

2007 Australian federal election: Kalgoorlie
PartyCandidateVotes%±%
Liberal Barry Haase 31,56548.14+2.68
Labor Sharon Thiel26,65340.65+8.73
Greens Robin Chapple 4,0456.17−0.16
One Nation Derek Major1,0751.64−0.69
Christian Democrats Ross Patterson9621.47+0.19
Family First Ian Rose8201.25+1.25
Citizens Electoral Council Ian Burt2750.42−0.07
Liberty & Democracy Charles Dalton1760.28+0.27
Total formal votes65,57195.93+1.27
Informal votes2,7854.07−1.27
Turnout 68,35684.63+1.10
Two-party-preferred result
Liberal Barry Haase 34,47452.58−3.72
Labor Sharon Thiel31,09747.42+3.72
Liberal hold Swing -3.72

Moore

2007 Australian federal election: Moore
PartyCandidateVotes%±%
Liberal Mal Washer 38,26254.45−0.89
Labor Geraldine Burgess22,90232.59+1.14
Greens Annette Pericic-Herrmann5,9068.40+1.32
Christian Democrats Lachlan Dungey1,5562.21+0.09
Family First Douglas Croker8111.15+1.15
One Nation George Gault7191.02−1.02
Citizens Electoral Council Arthur Harvey1150.16−0.12
Total formal votes70,27197.03+1.37
Informal votes2,1512.97−1.37
Turnout 72,42294.35+0.45
Two-party-preferred result
Liberal Mal Washer 41,57659.17−1.66
Labor Geraldine Burgess28,69540.83+1.66
Liberal hold Swing -1.66

O'Connor

2007 Australian federal election: O'Connor
PartyCandidateVotes%±%
Liberal Wilson Tuckey 34,87645.85−7.40
Labor Dominic Rose15,54120.43+1.86
National Philip Gardiner 13,45917.69+8.25
Greens Adrian Price5,1886.82+0.09
Christian Democrats Mac Forsyth2,2352.94+0.12
One Nation Ross Paravicini1,2141.60−2.75
Independent Michael Walton1,1281.48+1.48
Family First Stephen Carson9911.30+1.30
Independent George Giudice9861.30−1.46
Independent Darius Crowe2370.31+0.31
Citizens Electoral Council Judy Sudholz2120.28−0.22
Total formal votes76,06795.36+0.85
Informal votes3,7024.64−0.85
Turnout 79,76994.45+1.19
Two-party-preferred result
Liberal Wilson Tuckey 50,62566.55−3.84
Labor Dominic Rose25,44233.45+3.84
Liberal hold Swing -3.84

Pearce

2007 Australian federal election: Pearce
PartyCandidateVotes%±%
Liberal Judi Moylan 43,87451.81−1.91
Labor Christopher Myson27,11132.01+3.96
Greens Yvonne Dols7,2778.59+0.74
Christian Democrats Paul Mewhor1,6831.99−0.99
Independent Steve Branwhite1,5331.81+1.81
One Nation David Gunnyon1,3751.62−2.12
Family First David Bolt1,2391.46+1.46
Socialist Alliance Annolies Truman3160.37−0.01
Citizens Electoral Council Ron McLean2750.32−0.21
Total formal votes84,68396.03+1.33
Informal votes3,5053.97−1.33
Turnout 88,18893.30−0.37
Two-party-preferred result
Liberal Judi Moylan 50,02259.07−3.87
Labor Christopher Myson34,66140.93+3.87
Liberal hold Swing -3.87

Perth

2007 Australian federal election: Perth
PartyCandidateVotes%±%
Labor Stephen Smith 36,68446.87+1.28
Liberal Daniel Nikolic28,16335.98−0.90
Greens Damian Douglas-Meyer8,32010.63+1.05
Christian Democrats Paul Connelly1,5942.04−0.42
Independent Stephen Brooks1,4131.81+1.81
Family First Sharon Fairfull8381.07+1.07
One Nation Marie Edmonds6280.80−1.19
Socialist Alliance Chris Latham4640.59−0.75
Citizens Electoral Council Orm Girvan1620.21−0.13
Total formal votes78,26695.42+1.40
Informal votes3,7574.58−1.40
Turnout 82,02393.03+0.10
Two-party-preferred result
Labor Stephen Smith 46,06158.85+2.12
Liberal Daniel Nikolic32,20541.15−2.12
Labor hold Swing +2.12

Stirling

2007 Australian federal election: Stirling
PartyCandidateVotes%±%
Liberal Michael Keenan 38,22047.21−0.05
Labor Peter Tinley 32,73740.44+1.50
Greens Tamara Desiatov6,1237.56+0.41
Christian Democrats Ray Moran1,4071.74−0.20
Liberty & Democracy Sam Ward6660.82+0.82
What Women Want Denise Hynd5900.73+0.73
Family First Symia Hopkinson5240.65+0.65
One Nation Alex Patrick5240.65−0.82
Citizens Electoral Council Keith Hallam1600.20−0.71
Total formal votes80,95195.09+1.01
Informal votes4,1784.91−1.01
Turnout 85,12993.43+0.48
Two-party-preferred result
Liberal Michael Keenan 41,52051.29−0.75
Labor Peter Tinley 39,43148.71+0.75
Liberal hold Swing -0.75

Swan

2007 Australian federal election: Swan
PartyCandidateVotes%±%
Liberal Steve Irons 32,18344.28+0.14
Labor Kim Wilkie 29,54440.65+0.73
Greens Kim Lisson7,36510.13+1.84
Christian Democrats Tasman Gilbert1,2101.66−0.09
Independent Linda Ross6560.90+0.90
One Nation Joy Harris6470.89−0.89
Family First Damon Fowler5790.80−0.04
Liberty & Democracy Mark Dixon2430.33+0.33
Socialist Equality Joe Lopez1570.22+0.22
Citizens Electoral Council Norman Gay920.13−0.16
Total formal votes72,67695.41+0.87
Informal votes3,4974.59−0.87
Turnout 76,17393.22+1.04
Two-party-preferred result
Liberal Steve Irons 36,42050.11+0.19
Labor Kim Wilkie 36,25649.89−0.19
Liberal gain from Labor Swing +0.19

Tangney

2007 Australian federal election: Tangney
PartyCandidateVotes%±%
Liberal Dennis Jensen 39,40650.85−2.87
Labor Mark Reynolds24,83232.04+3.50
Greens Christine Ivan6,8968.90+1.10
Independent Katherine Jackson3,0703.96+3.96
Christian Democrats Ka-ren Chew1,8672.41−0.37
Family First Lisa Saladine8151.05+1.05
One Nation Lloyd Boon6130.79−1.66
Total formal votes77,49997.27+1.71
Informal votes2,1782.73−1.71
Turnout 79,67794.56+0.65
Two-party-preferred result
Liberal Dennis Jensen 45,48058.68−3.07
Labor Mark Reynolds32,01941.32+3.07
Liberal hold Swing -3.07

Related Research Articles

<span class="mw-page-title-main">2001 Australian federal election</span> Election for the 40th Parliament of Australia

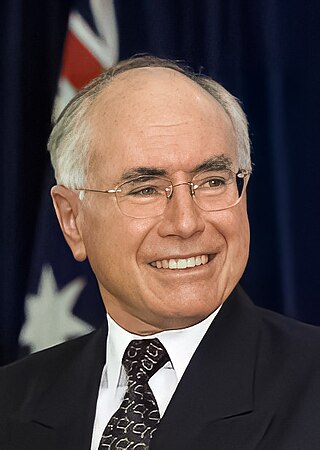
The 2001 Australian federal election was held in Australia on 10 November 2001. All 150 seats in the House of Representatives and 40 seats in the 76-member Senate were up for election. The incumbent Liberal Party of Australia led by Prime Minister of Australia John Howard and coalition partner the National Party of Australia led by John Anderson defeated the opposition Australian Labor Party led by Kim Beazley. Future Opposition Leader Peter Dutton entered parliament at this election. As of 2023 this was the most recent federal election to have a rematch in 11 years, and the most recent repeated election when Howard beat Beazley just 3 years earlier and until 2013 to have both major party leaders running in previous federal elections as major party leaders when in 2013, and the last for both major party leaders to appear in consecutive federal elections in 24 years.

<span class="mw-page-title-main">Division of Corangamite</span> Australian federal electoral division

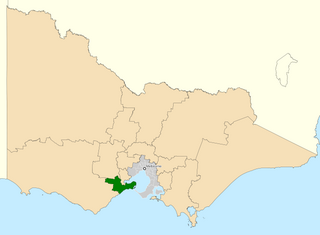
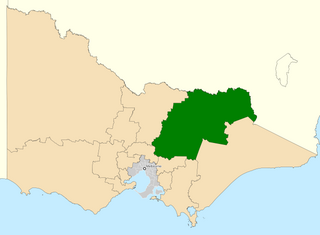
The Division of Corangamite is an Australian electoral division in the state of Victoria. The division was proclaimed in 1900, and was one of the original 65 divisions to be contested at the first federal election. It is named for Lake Corangamite, although the lake no longer falls within the division's boundaries.

<span class="mw-page-title-main">Division of Brand</span> Australian federal electoral division

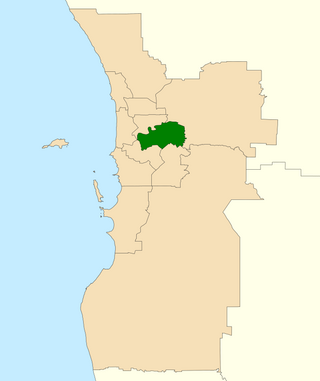
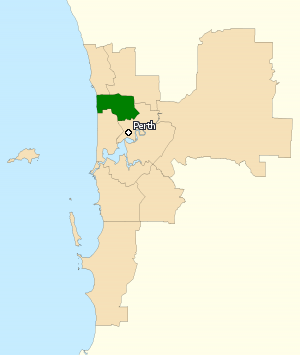
The Division of Brand is an Australian electoral division in Perth, Western Australia. Brand was first created in 1984 and is named after Sir David Brand, Premier of Western Australia 1959-71. Brand governed Western Australia at a time when the state was developing its new mining and industrial base.

<span class="mw-page-title-main">Division of Swan</span> Australian federal electoral division

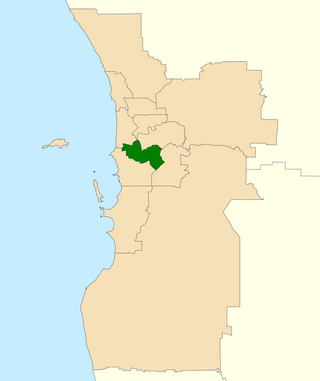
The Division of Swan is an Australian electoral division located in Western Australia.

<span class="mw-page-title-main">Division of Bennelong</span> Australian federal electoral division

The Division of Bennelong is an Australian electoral division in the state of New South Wales. The division was created in 1949 and is named after Woollarawarre Bennelong, an Aboriginal man befriended by the first Governor of New South Wales, Arthur Phillip. The seat is represented by Jerome Laxale since the 2022 Australian federal election.

<span class="mw-page-title-main">Division of Stirling</span> Australian federal electoral division

The Division of Stirling was an Australian electoral division in the inner northern and beachside suburbs of Perth, Western Australia, which included a large portion of the local government area of the City of Stirling.

The Division of Boothby is an Australian federal electoral division in South Australia. The division was one of the seven established when the former Division of South Australia was redistributed on 2 October 1903 and is named after William Boothby (1829–1903), the Returning Officer for the first federal election.

<span class="mw-page-title-main">Division of Canning</span> Australian federal electoral division

The Division of Canning is an Australian Electoral Division in Western Australia.

<span class="mw-page-title-main">Division of Cowan</span> Australian federal electoral division

The Division of Cowan is an Australian Electoral Division in Western Australia.

<span class="mw-page-title-main">Division of Macquarie</span> Australian federal electoral division

The Division of Macquarie is an Australian electoral division in the state of New South Wales. The division was created in 1900 and was one of the original 65 divisions contested at the first federal election. It is named for Lachlan Macquarie, who was Governor of New South Wales between 1810 and 1821.

<span class="mw-page-title-main">Division of Indi</span> Australian federal electoral division

The Division of Indi is an Australian electoral division in the state of Victoria. The division is located in the north-east of the state, adjoining the border with New South Wales. The largest settlements in the division are the regional cities of Wodonga, Wangaratta, and Benalla. Other towns in the electorate include Rutherglen, Mansfield, Beechworth, Myrtleford, Bright, Alexandra, Tallangatta, Corryong and a number of other small villages. While Indi is one of the largest electorates in Victoria, much of it is located within the largely uninhabited Australian Alps. While Wodonga serves as a regional hub for much of the more heavily populated northern part of the electorate, the southern part is closer to Melbourne than Wodonga.

<span class="mw-page-title-main">Division of Parramatta</span> Australian federal electoral division

The Division of Parramatta is an Australian electoral division in the state of New South Wales. The division was created in 1900 and was one of the original 65 divisions contested at the first federal election. It is named for the locality of Parramatta. The name Parramatta has been sourced to an Aboriginal word for the area. The Darug people had lived in the area for many generations, and regarded the area as a food bowl, rich in food from the river and forests. They called the area Baramada or Burramatta ("Parramatta") which means "the place where the eels lie down".

<span class="mw-page-title-main">Division of Solomon</span> Australian federal electoral division

The Division of Solomon is an Australian Electoral Division in the Northern Territory. It is largely coextensive with the Darwin/Palmerston metropolitan area. The only other division in the territory, the Division of Lingiari, covers the remainder of the territory.

<span class="mw-page-title-main">Division of Pearce</span> Australian federal electoral division

The Division of Pearce is an Australian electoral division in the state of Western Australia. It was created at the 1989 redistribution and named after George Pearce, the longest serving member of the Australian Senate, serving from 1901 to 1938. For most of its existence, Pearce was a hybrid urban-rural seat that covered Perth's outer northern suburbs before fanning inland from the Indian Ocean to take in portions of the Wheatbelt southeast, east and northeast of the capital. However, as of the 2021 redistribution, Pearce is largely coterminous with the City of Wanneroo in Perth's northern suburbs. It has had four members: Fred Chaney, Judi Moylan, Christian Porter, and Tracey Roberts. The first three were members of the Liberal Party, whereas Roberts, a former mayor of Wanneroo, is a member of the Labor Party.

<span class="mw-page-title-main">Division of Tangney</span> Australian federal electoral division

The Division of Tangney is an Australian electoral division in the state of Western Australia. The Division was named after Dame Dorothy Tangney, the first female member of the Australian Senate.

The Division of Flynn is an Australian Electoral Division in Queensland.

<span class="mw-page-title-main">2010 Australian federal election</span> Election for the 43rd Parliament of Australia

The 2010 Australian federal election was held on Saturday, 21 August 2010 to elect members of the 43rd Parliament of Australia. The incumbent centre-left Australian Labor Party led by Prime Minister Julia Gillard won a second term against the opposition centre-right Liberal Party of Australia led by Opposition Leader Tony Abbott and Coalition partner the National Party of Australia, led by Warren Truss, after Labor formed a minority government with the support of three independent MPs and one Australian Greens MP.

<span class="mw-page-title-main">Division of Burt</span> Australian federal electoral division

The Division of Burt is an Australian electoral division in Perth in the state of Western Australia.

<span class="mw-page-title-main">Results of the 2022 Australian federal election in Western Australia</span> Federal election results in Western Australia

The 2022 Australian federal election was held on 21 May 2022 to elect all 151 members of the Australian House of Representatives and 40 of 76 members of the Australian Senate. Of those, 15 MPs and 6 senators were elected to represent the state of Western Australia.

<span class="mw-page-title-main">Results of the 2007 Australian federal election in New South Wales</span>

This is a list of electoral division results in the Australian 2007 federal election for the state of New South Wales.

References

  1. 1 2 "2007 First preference votes for Western Australia". Australian Electoral Commission. Retrieved 4 June 2022.
  2. "2007 Western Australia division results". Australian Electoral Commission. Retrieved 4 June 2022.
  3. 1 2 "2007 House of Representatives: Western Australia". Psephos Adam Carr's Election Archive. Retrieved 29 May 2022.
  4. Bennett, Scott; Kopras, Andrew; Newman, Gerrard (2005). "Commonwealth Election 2007" (PDF). Research Paper 30 2007–08. Parliamentary Library. ISSN   1834-9854.