2007 Australian federal election |
---|
National results |
State and territory results |
This is a list of electoral division results for the Australian 2007 federal election for the Australian Capital Territory [1] [2] [3] and the Northern Territory. [4] [5] [6]
| |||||||||||||||||||||||||||||||||||||
All 2 Australian Capital Territory seats in the Australian House of Representatives and all 2 seats in the Australian Senate | |||||||||||||||||||||||||||||||||||||
---|---|---|---|---|---|---|---|---|---|---|---|---|---|---|---|---|---|---|---|---|---|---|---|---|---|---|---|---|---|---|---|---|---|---|---|---|---|
|
Party | Votes | % | Swing | Seats | Change | |
---|---|---|---|---|---|---|
Labor | 114,244 | 51.10 | +0.85 | 2 | ||
Liberal | 74,295 | 33.23 | –2.00 | 0 | ||
Australian Greens | 29,424 | 13.16 | +2.40 | |||
Australian Democrats | 2,509 | 1.12 | –1.28 | |||
Citizens Electoral Council | 1,295 | 0.58 | +0.21 | |||
Socialist Alliance | 539 | 0.24 | –0.75 | |||
Independents | 1,275 | 0.57 | +0.57 | |||
Total | 223,581 | 2 | ||||
Two-party-preferred vote | ||||||
Labor | 141,745 | 63.40 | +1.86 | 2 | ||
Liberal | 81,836 | 36.60 | –1.86 | 0 | ||
Invalid/blank votes | 5,289 | 2.31 | −1.13 | |||
Registered voters/turnout | 238,786 | 95.85 | ||||
Source: Commonwealth Election 2007 |
Party | Candidate | Votes | % | ±% | |
---|---|---|---|---|---|
Labor | Annette Ellis | 58,711 | 51.10 | +1.17 | |
Liberal | Natalie Colbert | 40,359 | 35.13 | −1.56 | |
Greens | Amanda Bresnan | 14,878 | 12.95 | +2.65 | |
Citizens Electoral Council | John Holder | 953 | 0.83 | +0.13 | |
Total formal votes | 114,901 | 97.74 | +1.11 | ||
Informal votes | 2,660 | 2.26 | −1.11 | ||
Turnout | 117,561 | 96.05 | +0.91 | ||
Two-party-preferred result | |||||
Labor | Annette Ellis | 71,030 | 61.82 | +1.91 | |
Liberal | Natalie Colbert | 43,871 | 38.18 | −1.91 | |
Labor hold | Swing | +1.91 |
Party | Candidate | Votes | % | ±% | |
---|---|---|---|---|---|
Labor | Bob McMullan | 55,533 | 51.10 | +0.50 | |
Liberal | Troy Williams | 33,936 | 31.23 | −2.41 | |
Greens | Meredith Hunter | 14,546 | 13.38 | +2.12 | |
Democrats | Darren Churchill | 2,509 | 2.31 | −0.27 | |
Independent | Kerri Taranto | 1,275 | 1.17 | +1.17 | |
Socialist Alliance | Farida Iqbal | 539 | 0.50 | −1.42 | |
Citizens Electoral Council | Jim Arnold | 342 | 0.31 | +0.31 | |
Total formal votes | 108,680 | 97.64 | +1.15 | ||
Informal votes | 2,629 | 2.36 | −1.15 | ||
Turnout | 111,309 | 95.67 | +0.92 | ||
Two-party-preferred result | |||||
Labor | Bob McMullan | 70,715 | 65.07 | +1.75 | |
Liberal | Troy Williams | 37,965 | 34.93 | −1.75 | |
Labor hold | Swing | +1.75 |
| |||||||||||||||||||||||||||||||||||||
All 2 Northern Territory seats in the Australian House of Representatives and all 2 seats in the Australian Senate | |||||||||||||||||||||||||||||||||||||
---|---|---|---|---|---|---|---|---|---|---|---|---|---|---|---|---|---|---|---|---|---|---|---|---|---|---|---|---|---|---|---|---|---|---|---|---|---|
|
Party | Votes | % | Swing | Seats | Change | |
---|---|---|---|---|---|---|
Labor | 46,794 | 47.65 | +3.38 | 2 | 1 | |
Country Liberal | 40,298 | 41.03 | –2.81 | 0 | 1 | |
Greens | 7,903 | 8.05 | +1.84 | |||
Liberty and Democracy Party | 358 | 0.36 | +0.36 | |||
Citizens Electoral Council | 245 | 0.25 | –0.01 | |||
Independents | 2,615 | 2.66 | +0.70 | |||
Total | 98,213 | 2 | ||||
Two-party-preferred vote | ||||||
Labor | 54,418 | 55.41 | +3.26 | 2 | 1 | |
Country Liberal | 43,795 | 44.59 | –3.26 | 0 | 1 | |
Invalid/blank votes | 3,936 | 3.85 | −0.60 | |||
Registered voters/turnout | 118,045 | 86.53 | ||||
Source: Commonwealth Election 2007 |
Party | Candidate | Votes | % | ±% | |
---|---|---|---|---|---|
Labor | Warren Snowdon | 25,213 | 53.99 | +3.33 | |
Country Liberal | Adam Giles | 16,189 | 34.66 | −3.70 | |
Greens | Emma Young | 3,231 | 6.92 | +1.34 | |
Independent | Maurie Ryan | 1,206 | 2.58 | +2.58 | |
Independent | Wayne Wright | 864 | 1.85 | +1.85 | |
Total formal votes | 46,703 | 95.15 | +0.09 | ||
Informal votes | 2,381 | 4.85 | −0.09 | ||
Turnout | 49,084 | 81.34 | +3.63 | ||
Two-party-preferred result | |||||
Labor | Warren Snowdon | 28,565 | 61.16 | +3.50 | |
Country Liberal | Adam Giles | 18,138 | 38.84 | −3.50 | |
Labor hold | Swing | +3.50 |
Party | Candidate | Votes | % | ±% | |
---|---|---|---|---|---|
Country Liberal | Dave Tollner | 24,109 | 46.80 | −1.95 | |
Labor | Damian Hale | 21,581 | 41.90 | +3.37 | |
Greens | Debbie Hudson | 4,672 | 9.07 | +2.30 | |
Independent | Maurice Foley | 545 | 1.06 | −0.44 | |
Liberty & Democracy | Jacques Chester | 358 | 0.70 | +0.70 | |
Citizens Electoral Council | Trudy Campbell | 245 | 0.48 | −0.01 | |
Total formal votes | 51,510 | 97.07 | +0.98 | ||
Informal votes | 1,555 | 2.93 | −1.07 | ||
Turnout | 53,065 | 91.29 | +0.98 | ||
Two-party-preferred result | |||||
Labor | Damian Hale | 25,853 | 50.19 | +3.00 | |
Country Liberal | Dave Tollner | 25,657 | 49.81 | −3.00 | |
Labor gain from Country Liberal | Swing | +3.00 |
This is a list of electoral results for the Division of Bennelong in Australian federal elections from the electorate's creation in 1949 until the present.
This is a list of electoral results for the Division of Warringah in Australian federal elections from the division's creation in 1922 until the present.
McEwan, an Australian Electoral Division in the Australian state of Victoria, has existed since 1984.
This is a list of electoral results for the Division of Canning in Australian federal elections from the division's creation in 1949 until the present.
This is a list of electoral results for the Division of Northern Territory in Australian federal elections from the division's creation in 1922 until its abolition in 2001.
This is a list of electoral results for the Division of Canberra in Australian federal elections from the division's creation in 1974 until the present.
This is a list of electoral results for the Division of Australian Capital Territory in Australian federal elections from the division's creation in 1949 until its abolition in 1974.
This is a list of electoral division results for the Australian 1954 federal election.
This is a list of electoral division results for the Australian 1951 federal election.
This is a list of electoral division results for the Australian 1955 federal election.
This is a list of electoral division results for the Australian 1963 federal election.
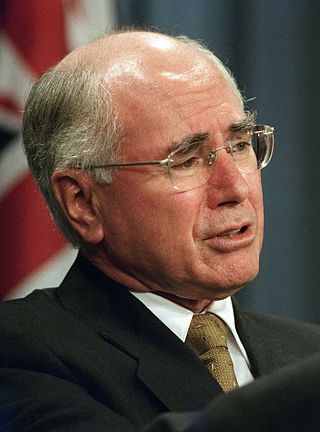
This is a list of electoral division results for the Australian 2004 federal election in the state of South Australia.
This is a list of electoral division results for the Australian 2004 federal election for the Australian Capital Territory and the Northern Territory.
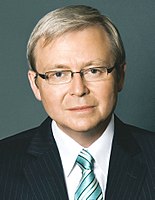
This is a list of electoral division results for the Australian 2001 federal election for the Australian Capital Territory and the Northern Territory.
This is a list of electoral division results for the Australian 1984 federal election for the Australian Capital Territory and the Northern Territory.
This is a list of electoral division results for the Australian 1987 federal election for the Australian Capital Territory and the Northern Territory.
This is a list of electoral division results for the Australian 1990 federal election for the Australian Capital Territory and the Northern Territory.
This is a list of electoral division results for the Australian 1993 federal election for the Australian Capital Territory and the Northern Territory.
This is a list of electoral division results for the Australian 1996 federal election for the Australian Capital Territory and the Northern Territory.
This is a list of electoral division results for the Australian 1998 federal election for the Australian Capital Territory and the Northern Territory.