Results of the 2007 Australian federal election in New South Wales

Last updated

2007 Australian federal election
(New South Wales)
Flag of New South Wales.svg
  2004 24 November 2007 2010  

All 49 New South Wales seats in the Australian House of Representatives
and 6 seats in the Australian Senate
 First partySecond party
  Kevin Rudd official portrait.jpg PMincoffs.jpg
Leader Kevin Rudd John Howard
Party Labor Liberal/National coalition
Last election21 seats21 seats
Seats won28 seats15 seats
Seat changeIncrease2.svg 7Decrease2.svg 6
Popular vote1,791,1711,645,493
Percentage44.12%40.53%
SwingIncrease2.svg 7.24Decrease2.svg 4.82
TPP 53.68%46.32%
TPP swingIncrease2.svg 5.61Decrease2.svg 5.61

This is a list of electoral division results in the Australian 2007 federal election for the state of New South Wales. [1] [2] [3]

Contents

Overall

Electoral divisions: New South Wales Map12007.gif
Electoral divisions: New South Wales
Electoral divisions: Sydney area Map22007.gif
Electoral divisions: Sydney area
Turnout 94.99% (CV) — Informal 4.95% [1]
PartyVotes %SwingSeatsChange
  Australian Labor Party 1,791,17144.12+7.4228Increase2.svg 7
  Liberal Party of Australia 1,324,31132.62–3.5415Decrease2.svg 6
  National Party of Australia 321,1827.91–1.285Decrease2.svg 1
  Australian Greens 320,0317.88–0.210Steady2.svg
  Christian Democratic Party 77,9031.92+0.700Steady2.svg
  Family First Party 35,4690.87+0.100Steady2.svg
  Australian Democrats 11,1060.27–0.800Steady2.svg
  Climate Change Coalition 9,4700.23+0.230Steady2.svg
  Citizens Electoral Council 9,0450.22–0.080Steady2.svg
  One Nation 8,4260.21–1.190Steady2.svg
  Liberty and Democracy Party 4,9060.12+0.120Steady2.svg
  Socialist Alliance 3,9700.10–0.010Steady2.svg
  Socialist Equality Party 3,4350.08+0.080Steady2.svg
  Conservatives for Climate and Environment 2,0740.05+0.050Steady2.svg
  The Fishing Party 1,0730.03–0.040Steady2.svg
  Non-Custodial Parents Party 7950.02–0.010Steady2.svg
  Independents 134,4243.31–0.691Decrease2.svg 1
 Not Affiliated6950.02–0.020Steady2.svg
 Total4,059,486  49Decrease2.svg 1
Two-party-preferred vote
  Australian Labor Party 53.68+5.6128Increase2.svg 7
  Liberal/National coalition  46.32–5.6120Decrease2.svg 7

Independents: Tony Windsor

Liberal to Labor: Bennelong, Dobell, Eden-Monaro, Lindsay, Parramatta (notional), Robertson

National to Labor: Page

Independent to National: Calare

Gwydir (National) was abolished in the last redistribution. Liberal-held Macquarie, a notionally Labor seat, was also won by the Labor Party.

New South Wales

Banks

This section is an excerpt from Electoral results for the Division of Banks § 2007
2007 Australian federal election: Banks [4]
PartyCandidateVotes%±%
Labor Daryl Melham 45,05954.62+8.37
Liberal Bruce Morrow27,72833.61−6.60
Greens Susan Roberts4,6125.59+0.91
Christian Democrats Stephen Chavura3,1803.85+0.27
CEC Huu Khoa Nguyen1,4301.73+1.68
Liberty & Democracy Don Nguyen4920.60+0.60
Total formal votes82,50193.64+1.57
Informal votes5,6086.36−1.57
Turnout 88,10995.02−0.29
Two-party-preferred result
Labor Daryl Melham 50,39261.08+7.86
Liberal Bruce Morrow32,10938.92−7.86
Labor hold Swing +7.86

Barton

This section is an excerpt from Electoral results for the Division of Barton § 2007
2007 Australian federal election: Barton
PartyCandidateVotes%±%
Labor Robert McClelland 45,29255.26+5.61
Liberal John La Mela27,42533.46−5.94
Greens Michele McKenzie6,7848.28+1.34
Christian Democrats Chris Svolos2,4653.01+3.01
Total formal votes81,96694.44+1.43
Informal votes4,8295.56−1.43
Turnout 86,79594.97+1.10
Two-party-preferred result
Labor Robert McClelland 50,90262.10+4.53
Liberal John La Mela31,06437.90−4.53
Labor hold Swing +4.53

Bennelong

This section is an excerpt from Electoral results for the Division of Bennelong § 2007
2007 Australian federal election: Bennelong [4]
PartyCandidateVotes%±%
Liberal John Howard 39,55145.49−4.14
Labor Maxine McKew 39,40845.33+16.18
Greens Lindsay Peters4,8115.53−10.08
Christian Democrats Robyn Peebles1,1191.29−1.06
Democrats Peter Goldfinch6100.70−0.56
Family First Lorraine Markwell2890.33+0.24
Climate Change Margherita Tracanelli2690.31+0.31
One Nation Victor Waterson2610.30+0.23
Independent Graeme Cordiner2390.27+0.27
Independent David Allen1230.14+0.14
Yusuf Tahir970.11+0.11
Liberty & Democracy David Leyonhjelm 890.10+0.10
CEC Gavin Spencer700.08+0.08
Total formal votes86,93693.78−0.24
Informal votes5,7646.22+0.24
Turnout 92,70095.01+0.02
Two-party-preferred result
Labor Maxine McKew 44,68551.40+5.53
Liberal John Howard 42,25148.60−5.53
Labor gain from Liberal Swing +5.53

Berowra

This section is an excerpt from Electoral results for the Division of Berowra § 2007
2007 Australian federal election: Berowra
PartyCandidateVotes%±%
Liberal Philip Ruddock 44,52553.42−4.38
Labor Michael Colnan25,56330.67+5.71
Greens Wendy McMurdo7,6539.18+0.00
Christian Democrats Ray Levick2,1252.55−0.52
Independent Mick Gallagher1,4561.75+1.75
Family First Sam Ellis1,0491.26+0.15
Democrats Rob McFarlane9741.17−0.65
Total formal votes83,34595.22+0.89
Informal votes4,1884.78−0.89
Turnout 87,53395.47+0.10
Two-party-preferred result
Liberal Philip Ruddock 49,12258.94−4.88
Labor Michael Colnan34,22341.06+4.88
Liberal hold Swing −4.88

Blaxland

This section is an excerpt from Electoral results for the Division of Blaxland § 2007
2007 Australian federal election: Blaxland [4]
PartyCandidateVotes%±%
Labor Jason Clare 47,49561.32+5.09
Liberal Mark Majewski18,66524.10−5.34
Greens John Ky5,0046.46+1.14
Christian Democrats Chris McLachlan1,8502.39−0.14
Independent Harry Stavrinos1,5351.98+1.98
One Nation Bob Vinnicombe1,2021.55−1.86
Family First Gabrielle Kent1,1831.53+1.53
Socialist Alliance Raul Bassi5220.67+0.17
Total formal votes77,45690.51+0.78
Informal votes8,1269.49−0.78
Turnout 85,58293.26+0.12
Two-party-preferred result
Labor Jason Clare 52,95368.37+3.14
Liberal Mark Majewski24,50331.63−3.14
Labor hold Swing +3.14

Bradfield

This section is an excerpt from Electoral results for the Division of Bradfield § 2007
2007 Australian federal election: Bradfield [4]
PartyCandidateVotes%±%
Liberal Brendan Nelson 49,81759.07−3.41
Labor Victoria Brookman22,50926.69+5.11
Greens Susie Gemmell9,49511.26+0.01
Christian Democrats Witold Wiszniewski1,4661.74+1.45
Family First James Turnbull7590.90−0.88
CEC Robert H. Butler2850.34+0.34
Total formal votes84,33196.01+0.53
Informal votes3,5013.99−0.53
Turnout 87,83294.04−0.55
Two-party-preferred result
Liberal Brendan Nelson 53,51263.45−4.10
Labor Victoria Brookman30,81936.55+4.10
Liberal hold Swing −4.10

Calare

This section is an excerpt from Electoral results for the Division of Calare § 2007
2007 Australian federal election: Calare [4]
PartyCandidateVotes%±%
National John Cobb 39,94148.48+10.06
Labor Michael Allen20,26624.60+4.76
Independent Gavin Priestley19,03523.10+23.10
Greens Jeremy Buckingham 2,3512.85+0.17
CEC David John Simpson7940.96+0.13
Total formal votes82,38796.56+0.19
Informal votes2,9333.44−0.19
Turnout 85,32095.78−0.80
Two-party-preferred result
National John Cobb 51,12462.05+0.64
Labor Michael Allen31,26337.95−0.64
National gain from Independent Swing N/A

The sitting member was Peter Andren (Independent) however a redistribution effectively cut Calare in half [5] and Andren did not contest the election.

Charlton

This section is an excerpt from Electoral results for the Division of Charlton § 2007
2007 Australian federal election: Charlton
PartyCandidateVotes%±%
Labor Greg Combet 44,15653.08+6.47
Liberal Lindsay Paterson26,35331.68−3.49
Greens Suzanne Pritchard6,7088.06−0.71
Independent Stuart Ulrich2,0082.41+2.41
Christian Democrats Jim Kendall2,0072.41+2.41
Independent Patrick Barry1,2531.51+1.51
Socialist Equality Terry Cook4040.49+0.49
CEC David Stow2940.35−0.23
Total formal votes83,18395.34+0.46
Informal votes4,0664.66−0.46
Turnout 87,24995.74+0.14
Two-party-preferred result
Labor Greg Combet 52,29862.87+4.47
Liberal Lindsay Paterson30,88537.13−4.47
Labor hold Swing +4.47

Chifley

This section is an excerpt from Electoral results for the Division of Chifley § 2007
2007 Australian federal election: Chifley
PartyCandidateVotes%±%
Labor Roger Price 51,56864.18+10.12
Liberal Jess Diaz19,09223.76−6.62
Greens John Forrester2,8973.61−1.66
Christian Democrats Dave Vincent2,7513.42+1.21
One Nation Louise Kedwell1,1831.47−0.53
Socialist Equality James Cogan1,0691.33+1.33
Family First Evan Jewell1,0161.26−0.24
Independent Wayne Hyland4840.60−0.24
Independent Amarjit Tanda2880.36+0.36
Total formal votes80,34892.01+2.90
Informal votes6,9767.99−2.90
Turnout 87,32494.40+0.55
Two-party-preferred result
Labor Roger Price 56,77670.66+8.69
Liberal Jess Diaz23,57229.34−8.69
Labor hold Swing +8.69

Cook

This section is an excerpt from Electoral results for the Division of Cook § 2007
2007 Australian federal election: Cook
PartyCandidateVotes%±%
Liberal Scott Morrison 45,11652.40−5.11
Labor Mark Buttigieg 30,92135.91+7.69
Greens Naomi Waizer5,3426.20−0.82
Christian Democrats Beth Smith1,9292.24−0.17
One Nation Richard Putral1,1161.30−0.63
Independent Graeme Strang6930.80+0.23
Family First Ari Katsoulas5960.69+0.69
Independent Patricia Poulos3940.46+0.46
Total formal votes86,10796.13+1.59
Informal votes3,4653.87−1.59
Turnout 89,57295.91−0.18
Two-party-preferred result
Liberal Scott Morrison 48,71156.57−6.71
Labor Mark Buttigieg 37,39543.43+6.71
Liberal hold Swing −6.71

Cowper

This section is an excerpt from Electoral results for the Division of Cowper § 2007
2007 Australian federal election: Cowper
PartyCandidateVotes%±%
National Luke Hartsuyker 39,44446.54−3.92
Labor Paul Sekfy32,27638.08+6.43
Greens John Carty9,35911.04+2.15
Christian Democrats Deborah Lions2,4282.86+2.86
Family First Flavia Arapi-Nunez7590.90+0.70
Liberty & Democracy Leon Belgrave4910.58+0.58
Total formal votes84,75796.02+0.36
Informal votes3,5103.98−0.36
Turnout 88,26795.15+0.48
Two-party-preferred result
National Luke Hartsuyker 43,42351.23−5.52
Labor Paul Sekfy41,33448.77+5.52
National hold Swing −5.52

Cunningham

This section is an excerpt from Electoral results for the Division of Cunningham § 2007
2007 Australian federal election: Cunningham [4]
PartyCandidateVotes%±%
Labor Sharon Bird 44,83553.23+12.46
Liberal Colin Fowler22,43826.64−2.45
Greens Michael Organ 12,32614.63−4.80
Christian Democrats Nolene Norsworthy2,2322.65−0.54
Family First Jemma Tribe1,2031.43+1.43
Socialist Alliance Jess Moore 7060.84+0.45
Non-Custodial Parents John Flanagan4890.58+0.14
Total formal votes84,22996.04+2.40
Informal votes3,4713.96−2.40
Turnout 87,70095.68+0.26
Two-party-preferred result
Labor Sharon Bird 57,38268.13+6.51
Liberal Colin Fowler26,84731.87−6.51
Labor hold Swing +6.51

Dobell

This section is an excerpt from Electoral results for the Division of Dobell § 2007
2007 Australian federal election: Dobell
PartyCandidateVotes%±%
Labor Craig Thomson 38,16846.32+8.85
Liberal Ken Ticehurst 34,86542.31-6.32
Greens Scott Rickard4,4295.38+0.28
Independent Doug Eaton1,6391.99+1.99
Christian Democrats Michael Darby 1,5491.88+1.88
Family First Hadden Ervin1,4071.71-0.49
Liberty & Democracy Graeme Bird1820.22+0.22
CEC Steve Hughes1570.19+0.03
Total formal votes82,39695.68+2.96
Informal votes3,7194.32-2.97
Turnout 86,11595.34+0.42
Two-party-preferred result
Labor Craig Thomson 44,41353.90+8.74
Liberal Ken Ticehurst 37,98346.10-8.74
Labor gain from Liberal Swing +8.74

Eden-Monaro

This section is an excerpt from Electoral results for the Division of Eden-Monaro § 2007
2007 Australian federal election: Eden-Monaro
PartyCandidateVotes%±%
Labor Mike Kelly 37,72444.56+6.64
Liberal Gary Nairn 36,86343.55-5.85
Greens Keith Hughes6,3037.45+0.53
Independent Acacia Rose1,9242.27+2.27
Christian Democrats Matthew Chivers9111.08-0.30
Family First Peter Harris6570.78+0.58
Liberty & Democracy Tim Quilty 2720.32+0.32
Total formal votes84,65496.31+1.10
Informal votes3,2393.69-1.10
Turnout 87,89395.94+0.67
Two-party-preferred result
Labor Mike Kelly 45,20753.40+6.67
Liberal Gary Nairn 39,44746.60-6.67
Labor gain from Liberal Swing +6.67

Farrer

This section is an excerpt from Electoral results for the Division of Farrer § 2007
2007 Australian federal election: Farrer [4]
PartyCandidateVotes%±%
Liberal Sussan Ley 49,79457.73+5.90
Labor Chris Ryan28,23832.74+6.30
Greens Darran Stonehouse4,1694.83+1.28
Family First Rhonda Lever2,6573.08+1.59
Climate Conservatives Douglas McGregor Henderson1,0881.26+1.26
CEC Pat Mathers3130.36-0.15
Total formal votes86,25996.18+2.38
Informal votes3,4273.82-2.38
Turnout 89,68695.49-0.52
Two-party-preferred result
Liberal Sussan Ley 52,76661.17-5.46
Labor Chris Ryan33,49338.83+5.46
Liberal hold Swing -5.46

Fowler

This section is an excerpt from Electoral results for the Division of Fowler § 2007
2007 Australian federal election: Fowler
PartyCandidateVotes%±%
Labor Julia Irwin 50,18064.25+8.54
Liberal Rose Torossian21,70627.79-5.07
Greens Vlaudin Vega4,2785.49-0.10
Christian Democrats Paul Termeulen1,9322.47+1.78
Total formal votes78,10792.33+1.20
Informal votes6,4907.67-1.20
Turnout 84,59794.88+0.75
Two-party-preferred result
Labor Julia Irwin 53,30668.25+4.93
Liberal Rose Torossian24,80131.75-4.93
Labor hold Swing +4.93

Gilmore

This section is an excerpt from Electoral results for the Division of Gilmore § 2007
2007 Australian federal election: Gilmore
PartyCandidateVotes%±%
Liberal Joanna Gash 40,51350.39-3.83
Labor Neil Reilly30,38637.79+5.71
Greens Ben van der Wijngaart6,0707.55+0.32
Christian Democrats Bohdan Brumerskyj1,7552.18-1.71
Independent Of The Above None6860.85+0.85
Family First Brett Greenhalgh4070.51+0.51
Climate Conservatives Simon Blake3700.46+0.46
Liberty & Democracy Kevin Ramsey1510.19+0.19
CEC Warwick Hunt590.07-0.09
Total formal votes80,39795.79+0.24
Informal votes3,5364.21-0.24
Turnout 83,93395.88+0.61
Two-party-preferred result
Liberal Joanna Gash 43,46754.07-5.34
Labor Neil Reilly36,93045.93+5.34
Liberal hold Swing -5.34

Grayndler

This section is an excerpt from Electoral results for the Division of Grayndler § 2007
2007 Australian federal election: Grayndler [4]
PartyCandidateVotes%±%
Labor Anthony Albanese 46,50955.47+4.77
Liberal Daniel Caffery17,48520.86-4.77
Greens Saeed Khan15,67518.70-1.34
Democrats Jeffrey Gabriel1,4071.68-0.35
Socialist Alliance Pip Hinman1,3941.66+0.45
Christian Democrats Ehab Hennien1,0421.24+1.06
Socialist Equality Patrick O'Connor3280.39+0.39
Total formal votes83,84094.02-0.22
Informal votes5,3335.98+0.22
Turnout 89,17393.82+0.59
Two-party-preferred result
Labor Anthony Albanese 62,82174.93+3.74
Liberal Daniel Caffery21,01925.07-3.74
Labor hold Swing +3.74

Greenway

This section is an excerpt from Electoral results for the Division of Greenway § 2007
2007 Australian federal election: Greenway
PartyCandidateVotes%±%
Liberal Louise Markus 40,33850.10-5.07
Labor Michael Vassili30,97338.47+9.11
Greens Leigh Williams4,6175.73+0.20
Christian Democrats John Phillips1,7112.12-0.07
Independent F Ivor1,3431.67+1.44
Family First Joanne Muller1,3121.63+0.09
CEC Goran Reves2280.28+0.16
Total formal votes80,52295.37+4.29
Informal votes3,9084.63-4.29
Turnout 84,43095.71+1.21
Two-party-preferred result
Liberal Louise Markus 43,88154.50-6.85
Labor Michael Vassili36,64145.50+6.85
Liberal hold Swing -6.85

Hughes

This section is an excerpt from Electoral results for the Division of Hughes § 2007
2007 Australian federal election: Hughes
PartyCandidateVotes%±%
Liberal Danna Vale 40,33448.29-4.73
Labor Greg Holland35,08742.01+8.26
Greens Jamie Paterson4,6465.56-1.20
Christian Democrats John Vanderjagt2,4192.90-0.07
Family First Julie Mezyed1,0331.24+1.24
Total formal votes83,51995.74+1.26
Informal votes3,7124.26-1.26
Turnout 87,23195.67+0.55
Two-party-preferred result
Liberal Danna Vale 43,56252.16-6.39
Labor Greg Holland39,95747.84+6.39
Liberal hold Swing -6.39

Hume

This section is an excerpt from Electoral results for the Division of Hume § 2007
2007 Australian federal election: Hume
PartyCandidateVotes%±%
Liberal Alby Schultz 41,34449.18−7.45
Labor David Grant31,88237.93+8.88
Greens Jim Clark6,4147.63+0.68
Christian Democrats Geoff Peet2,0102.39−1.09
Family First Cathy Trent1,9582.33+2.33
CEC Lindsay Cosgrove4550.54−0.08
Total formal votes84,06396.61+1.68
Informal votes2,9463.39−1.68
Turnout 87,00996.18+0.92
Two-party-preferred result
Liberal Alby Schultz 45,52654.16−8.68
Labor David Grant38,53745.84+8.68
Liberal hold Swing −8.68

Hunter

This section is an excerpt from Electoral results for the Division of Hunter § 2007
2007 Australian federal election: Hunter
PartyCandidateVotes%±%
Labor Joel Fitzgibbon 49,56159.95+8.64
National Beth Black22,32827.01-2.89
Greens Jan Davis5,2656.37+0.11
Climate Change John Harvey2,5003.02+3.02
Christian Democrats Bernie Neville1,7362.10+0.36
CEC Daniel Albury1,2871.56-1.33
Total formal votes82,67795.71+0.95
Informal votes3,7104.29-0.95
Turnout 86,38795.77+0.19
Two-party-preferred result
Labor Joel Fitzgibbon 54,50465.92+4.83
National Beth Black28,17334.08-4.83
Labor hold Swing +4.83

Kingsford Smith

This section is an excerpt from Electoral results for the Division of Kingsford Smith § 2007
2007 Australian federal election: Kingsford Smith [4]
PartyCandidateVotes%±%
Labor Peter Garrett 45,83152.85+4.24
Liberal Caroline Beinke29,40233.90-2.13
Greens Sue Mahony8,99510.37+2.53
Christian Democrats Marcus Campbell1,4021.62+1.62
Socialist Equality Alex Safari1,0961.26+1.26
Total formal votes86,72694.67+2.97
Informal votes4,8845.33-2.97
Turnout 91,61094.22-0.06
Two-party-preferred result
Labor Peter Garrett 54,88963.29+4.56
Liberal Caroline Beinke31,83736.71-4.56
Labor hold Swing +4.56

Lindsay

This section is an excerpt from Electoral results for the Division of Lindsay § 2007
2007 Australian federal election: Lindsay
PartyCandidateVotes%±%
Labor David Bradbury 41,99151.39+11.68
Liberal Karen Chijoff31,17638.15-7.49
Greens Lesley Edwards2,7593.38-0.38
Christian Democrats Andrew Green2,4983.06+0.31
Independent Lisa Harrold9531.17+1.17
Family First Iris Muller9151.12-0.32
Independent Kerry McNally7280.89+0.89
Liberty & Democracy Grant Bayley6890.84+0.84
Total formal votes81,70994.46+2.32
Informal votes4,7915.54-2.32
Turnout 86,50095.74+0.31
Two-party-preferred result
Labor David Bradbury 46,39456.78+9.70
Liberal Karen Chijoff35,31543.22-9.70
Labor gain from Liberal Swing +9.70

Lowe

This section is an excerpt from Electoral results for the Division of Lowe § 2007
2007 Australian federal election: Lowe [4]
PartyCandidateVotes%±%
Labor John Murphy 38,76649.27+6.23
Liberal Jim Tsolakis31,51840.06-2.90
Greens Marc Rerceretnam6,7748.61-0.07
Christian Democrats Bill Shailer1,6162.05+0.04
Total formal votes78,67495.05+1.65
Informal votes4,0984.95-1.65
Turnout 82,77294.97+1.56
Two-party-preferred result
Labor John Murphy 45,13657.37+4.34
Liberal Jim Tsolakis33,53842.63-4.34
Labor hold Swing +4.34

Lyne

This section is an excerpt from Electoral results for the Division of Lyne § 2007
2007 Australian federal election: Lyne [4]
PartyCandidateVotes%±%
National Mark Vaile 41,31952.26−4.44
Labor James Langley25,35832.07+5.52
Greens Susie Russell5,6497.15+2.37
Independent Jamie Harrison3,3264.21+4.21
Christian Democrats Robert Waldron1,6792.12+2.12
Independent Barry Wright9791.24+1.24
Independent Stewart Scott-Irving3300.42+0.42
Independent Rodger Riach2380.30+0.30
CEC Graeme Muldoon1840.23−0.02
Total formal votes79,06294.93+0.23
Informal votes4,2205.07−0.23
Turnout 83.28295.96+0.55
Two-party-preferred result
National Mark Vaile 46,31158.58−4.83
Labor James Langley32,75141.42+4.83
National hold Swing −4.83

Macarthur

This section is an excerpt from Electoral results for the Division of Macarthur § 2007
2007 Australian federal election: Macarthur [4]
PartyCandidateVotes%±%
Liberal Pat Farmer 35,99646.98-8.79
Labor Nick Bleasdale33,68843.97+12.55
Greens Ben Raue3,3344.35-0.52
Christian Democrats Godwin Goh1,3571.77-0.77
Family First Douglas Rauch1,3231.73-0.19
Democrats Samantha Elliott-Halls6180.81-0.12
Non-Custodial Parents Andy Thompson3060.40+0.40
Total formal votes76,62294.63+1.50
Informal votes4,3475.37-1.50
Turnout 80,96995.66+1.24
Two-party-preferred result
Liberal Pat Farmer 38,86550.72-10.43
Labor Nick Bleasdale37,75749.28+10.43
Liberal hold Swing -10.43

Mackellar

This section is an excerpt from Electoral results for the Division of Mackellar § 2007
2007 Australian federal election: Mackellar [4]
PartyCandidateVotes%±%
Liberal Bronwyn Bishop 47,34356.41-0.62
Labor Chris Sharpe20,43924.35+4.24
Greens Craige McWhirter9,84011.72+1.19
Christian Democrats Mike Hubbard1,9552.33+2.33
Climate Change John Adams1,7722.11+2.11
Independent Matt McLellan1,6511.97+1.97
Democrats Clinton Barnes9331.11-0.29
Total formal votes83,93395.29+0.11
Informal votes4,1504.71-0.11
Turnout 88,08395.32+1.86
Two-party-preferred result
Liberal Bronwyn Bishop 52,39562.42-3.04
Labor Chris Sharpe31,53837.58+3.04
Liberal hold Swing -3.04

Macquarie

This section is an excerpt from Electoral results for the Division of Macquarie § 2007
2007 Australian federal election: Macquarie [4]
PartyCandidateVotes%±%
Labor Bob Debus 38,67244.08+17.13
Liberal Kerry Bartlett 33,19737.84-14.93
Greens Carmel McCallum9,09210.36+1.94
Independent Tim Williams4,1454.72+3.49
Christian Democrats Robert Gifford1,7021.94+0.35
Family First Charles Liptak4650.53-0.60
Liberty & Democracy Kirk Fletcher3550.40+0.40
CEC Michael Segedin990.11-0.30
Total formal votes87,72796.44+0.38
Informal votes3,2403.56-0.38
Turnout 90,96796.09-0.09
Two-party-preferred result
Labor Bob Debus 50,03757.04+6.57
Liberal Kerry Bartlett 37,69042.96-6.57
Labor notional  hold Swing +6.57

The sitting member was Kerry Bartlett (Liberal) however a redistribution made it a notional Labor seat with a margin of 0.5%. [4]

Mitchell

This section is an excerpt from Electoral results for the Division of Mitchell § 2007
2007 Australian federal election: Mitchell [4]
PartyCandidateVotes%±%
Liberal Alex Hawke 46,11556.74-7.64
Labor Nigel Gould25,21131.02+10.02
Greens Toni Wright-Turner4,3025.29-0.64
Christian Democrats Darryl Allen2,0992.58+0.07
Climate Change James Fiander1,7152.11+2.11
Family First Jarrod Graetz1,0221.26-0.11
Independent Jordie Stuart Bodlay8151.00+0.45
Total formal votes81,27996.12+2.73
Informal votes3,2783.88-2.73
Turnout 84,55795.63+1.95
Two-party-preferred result
Liberal Alex Hawke 50,05861.59-9.09
Labor Nigel Gould31,22138.41+9.09
Liberal hold Swing -9.09

New England

This section is an excerpt from Electoral results for the Division of New England § 2007
2007 Australian federal election: New England
PartyCandidateVotes%±%
Independent Tony Windsor 52,73461.94+7.24
National Phil Betts19,85023.31+2.54
Labor Luke Brand8,3689.83+0.65
Greens Bruce Taylor2,8923.40+0.06
One Nation Brian Dettmann1,0711.26-0.28
CEC Richard Witten2250.26-0.32
Total formal votes85,14097.12-0.09
Informal votes2,5222.88+0.09
Turnout 87,66295.92-0.52
Two-party-preferred result
National Phil Betts55,16764.8+1.21
Labor Luke Brand29,97335.2-1.21
Two-candidate-preferred result
Independent Tony Windsor 63,28674.33+2.95
National Phil Betts21,85425.67-2.95
Independent hold Swing +2.95

Newcastle

This section is an excerpt from Electoral results for the Division of Newcastle2007
2007 Australian federal election: Newcastle
PartyCandidateVotes%±%
Labor Sharon Grierson 42,93650.78+5.21
Liberal Krysia Walker21,61125.56-10.71
Greens Charmian Eckersley8,46310.01-1.30
Independent Aaron Buman6,3437.50+7.50
Family First Malcolm East1,9262.28+2.12
Christian Democrats Milton Caine1,0641.26+1.26
Democrats Aaron Johnson8911.05-1.25
Independent Joel Curry7010.83+0.83
Socialist Alliance Geoff Payne3330.39-0.14
Socialist Equality Noel Holt2770.33+0.33
Total formal votes84,54595.56+0.75
Informal votes3,9304.44-0.75
Turnout 88,47594.67-0.82
Two-party-preferred result
Labor Sharon Grierson 55,72565.91+6.82
Liberal Krysia Walker28,82034.09-6.82
Labor hold Swing +6.82

North Sydney

This section is an excerpt from Electoral results for the Division of North Sydney § 2007
2007 Australian federal election: North Sydney
PartyCandidateVotes%±%
Liberal Joe Hockey 44,17751.81-4.42
Labor Mike Bailey 30,37235.62+8.35
Greens Ted Nixon7,8519.21-3.12
Climate Change Barry Thompson1,1191.31+1.31
Christian Democrats Arie Baalbergen6210.73+0.73
Independent Marcus Aussie-Stone5260.62+0.62
Family First John Cafferatta3520.41+0.39
CEC Kundan Misra2450.29+0.29
Total formal votes85,26396.53+0.19
Informal votes3,0613.47-0.19
Turnout 88,32493.80+0.18
Two-party-preferred result
Liberal Joe Hockey 47,22255.38-4.66
Labor Mike Bailey 38,04144.62+4.66
Liberal hold Swing -4.66

Page

This section is an excerpt from Electoral results for the Division of Page § 2007
2007 Australian federal election: Page
PartyCandidateVotes%±%
National Chris Gulaptis 36,81343.05-6.68
Labor Janelle Saffin 35,63641.67+8.60
Greens Theo Jongen6,9308.10-1.46
Independent Doug Behn1,5251.78+0.40
Christian Democrats Rhonda Avasalu1,4301.67+1.67
Democrats Julia Melland9101.06+0.79
Independent Tony Kane8771.03+1.03
Family First Mirian Vega7840.92+0.76
Liberty & Democracy Ben Beatty4620.54+0.54
CEC John Culverwell1430.17-0.78
Total formal votes85,51095.70-0.22
Informal votes3,8424.30+0.22
Turnout 89,35295.64-0.29
Two-party-preferred result
Labor Janelle Saffin 44,77052.36+7.83
National Chris Gulaptis 40,74047.64-7.83
Labor gain from National Swing +7.83

Parkes

This section is an excerpt from Electoral results for the Division of Parkes § 2007
2007 Australian federal election: Parkes
PartyCandidateVotes%±%
National Mark Coulton 38,57446.77-15.02
Labor Margaret Patriarca20,92225.37+0.72
Independent Tim Horan17,09820.73+20.73
Greens Matt Parmeter2,4963.03-1.24
Independent Bruce Haigh 2,1532.61-1.21
Climate Change Michael Kiely9391.14+1.14
CEC Richard Stringer2870.35-0.75
Total formal votes82,46995.80-0.55
Informal votes3,6174.20+0.55
Turnout 86,08695.97-0.75
Two-party-preferred result
National Mark Coulton 51,98563.04-4.52
Labor Margaret Patriarca30,48436.96+4.52
National hold Swing -4.52

Parramatta

This section is an excerpt from Electoral results for the Division of Parramatta § 2007
2007 Australian federal election: Parramatta [4]
PartyCandidateVotes%±%
Labor Julie Owens 43,08350.58+10.68
Liberal Colin Robinson32,15537.75-7.39
Greens Astrid O'Neill4,2885.03+0.16
Christian Democrats Sam Baissari2,4032.82+0.00
Socialist Alliance Rachel Evans1,0151.19+1.19
Family First Rene Hernandez8881.04+0.09
Independent Brian Buckley6390.75+0.75
Liberty & Democracy Graham Nickols2740.32+0.32
Socialist Equality Chris Gordon2610.31+0.31
Alasdair Macdonald1740.20+0.20
Total formal votes85,18093.44+2.69
Informal votes5,9816.56-2.69
Turnout 91,16194.75-0.06
Two-party-preferred result
Labor Julie Owens 48,45356.88+7.71
Liberal Colin Robinson36,72743.12-7.71
Labor notional  gain from Liberal Swing +7.71

The sitting member was Julie Owens (Labor) however a redistribution made it a notional Liberal seat with a margin of 1.1%. [4]

Paterson

This section is an excerpt from Electoral results for the Division of Paterson § 2007
2007 Australian federal election: Paterson [4]
PartyCandidateVotes%±%
Liberal Bob Baldwin 40,46648.22+1.72
Labor Jim Arneman35,29142.06+5.76
Greens Judy Donnelly4,3445.18+0.70
Fishing Party Paul Hennelly1,0731.28+0.48
Christian Democrats Heather Haynes1,0101.20+0.81
One Nation John Hamberger8320.99-0.97
Family First Christopher Stokes5590.67-0.25
CEC Tony King3410.41-0.89
Total formal votes83,91696.43+2.24
Informal votes3,1063.57-2.24
Turnout 87,02296.15+0.37
Two-party-preferred result
Liberal Bob Baldwin 43,22851.51-4.81
Labor Jim Arneman40,68848.49+4.81
Liberal hold Swing -4.81

Prospect

This section is an excerpt from Electoral results for the Division of Prospect § 2007
2007 Australian federal election: Prospect
PartyCandidateVotes%±%
Labor Chris Bowen 46,13558.18+9.11
Liberal Lily Arthur24,70531.15-7.16
Greens Lizza Gebilagin3,6184.56-0.61
Family First Carolyn Lever2,6553.35+3.27
Christian Democrats Jason Callander2,1872.76-0.55
Total formal votes79,30092.27+1.68
Informal votes6,6487.73-1.68
Turnout 85,94894.84+0.90
Two-party-preferred result
Labor Chris Bowen 50,32763.46+7.06
Liberal Lily Arthur28,97336.54-7.06
Labor hold Swing +7.06

Reid

This section is an excerpt from Electoral results for the Division of Reid § 2007
2007 Australian federal election: Reid
PartyCandidateVotes%±%
Labor Laurie Ferguson 47,73960.10+9.26
Liberal Ronney Oueik21,51627.09-4.98
Greens Mark Lipscombe4,1605.24-0.33
Christian Democrats Alex Sharah3,1703.99+0.88
Family First Veronica Lambert1,3011.64+1.42
Democrats Silma Ihram 1,1231.41+0.16
CEC Hal Johnson4290.54+0.54
Total formal votes79,43892.43+3.77
Informal votes6,5087.57-3.77
Turnout 85,94692.77+1.12
Two-party-preferred result
Labor Laurie Ferguson 53,06566.80+4.72
Liberal Ronney Oueik26,37333.20-4.72
Labor hold Swing +4.72

Richmond

This section is an excerpt from Electoral results for the Division of Richmond § 2007
2007 Australian federal election: Richmond
PartyCandidateVotes%±%
Labor Justine Elliot 35,69943.81+8.15
National Sue Page 30,13436.98-7.53
Greens Giovanni Ebono12,16814.93+1.32
Liberty & Democracy Daniel Farmilo1,3201.62+1.62
Christian Democrats Barbara Raymond1,0391.28+1.28
Democrats Scott Sledge9501.17+0.12
CEC Graham McCallum1760.22+0.16
Total formal votes81,48695.72-0.62
Informal votes3,6474.28+0.62
Turnout 85,13394.57+0.24
Two-party-preferred result
Labor Justine Elliot 47,97358.87+7.43
National Sue Page 33,51341.13-7.43
Labor hold Swing +7.43

Riverina

This section is an excerpt from Electoral results for the Division of Riverina § 2007
2007 Australian federal election: Riverina
PartyCandidateVotes%±%
National Kay Hull 52,77962.57-4.47
Labor Peter Knox24,47129.01+4.48
Greens Ray Goodlass4,1304.90+0.58
One Nation Craig Hesketh1,8372.18-1.77
CEC Gary Johnson1,1411.35+1.31
Total formal votes84,35896.17-0.01
Informal votes3,3613.83+0.01
Turnout 87,71996.01-0.31
Two-party-preferred result
National Kay Hull 55,86866.23-4.62
Labor Peter Knox28,49033.77+4.62
National hold Swing -4.62

Robertson

This section is an excerpt from Electoral results for the Division of Robertson § 2007
2007 Australian federal election: Robertson
PartyCandidateVotes%±%
Liberal Jim Lloyd 39,79245.63-7.83
Labor Belinda Neal 37,43742.93+8.29
Greens Mira Wroblewski6,2797.20-0.65
Christian Democrats George Grant1,9292.21+2.21
One Nation Helen Ryan9241.06-0.66
Family First Daniel Le7080.81-0.91
CEC Nicholas Tomlin1410.16-0.11
Total formal votes87,21096.56+1.09
Informal votes3,1093.44-1.09
Turnout 90,31995.74+0.11
Two-party-preferred result
Labor Belinda Neal 43,69750.11+6.98
Liberal Jim Lloyd 43,51349.89-6.98
Labor gain from Liberal Swing +6.98

Shortland

This section is an excerpt from Electoral results for the Division of Shortland § 2007
2007 Australian federal election: Shortland [4]
PartyCandidateVotes%±%
Labor Jill Hall 48,52556.73+7.40
Liberal Jon Kealy26,62031.12-4.69
Greens Keith Parsons7,0978.30+0.15
Christian Democrats Les Wallace1,6551.93+1.93
Family First Matthew Reeves1,6441.92-0.49
Total formal votes85,54195.84+0.41
Informal votes3,7144.16-0.41
Turnout 89,25595.78-0.46
Two-party-preferred result
Labor Jill Hall 55,37964.74+5.50
Liberal Jon Kealy30,16235.26-5.50
Labor hold Swing +5.50

Sydney

This section is an excerpt from Electoral results for the Division of Sydney § 2007
2007 Australian federal election: Sydney
PartyCandidateVotes%±%
Labor Tanya Plibersek 37,50648.99+3.92
Liberal Georgina Anderson20,44026.70-0.81
Greens Jenny Leong 15,85420.71-1.38
Independent Jane Ward9791.28-0.29
Democrats Mayo Materazzo8741.14-1.00
Christian Democrats John Lee7270.95+0.95
CEC Adrian Ford1840.24+0.06
Total formal votes76,56495.88+1.09
Informal votes3,2864.12-1.09
Turnout 79,85090.85+0.84
Two-party-preferred result
Labor Tanya Plibersek 53,21469.50+2.12
Liberal Georgina Anderson23,35030.50-2.12
Labor hold Swing +2.12

Throsby

This section is an excerpt from Electoral results for the Division of Throwsby § 2007
2007 Australian federal election: Throsby
PartyCandidateVotes%±%
Labor Jennie George 52,27564.98+9.97
Liberal Stuart Wright18,26622.71-9.40
Greens Peter Moran7,3089.08-0.97
Christian Democrats Scott Deakes2,5983.23+2.97
Total formal votes80,44794.76+0.20
Informal votes4,4465.24-0.20
Turnout 84,89395.92+0.44
Two-party-preferred result
Labor Jennie George 59,09973.46+9.64
Liberal Stuart Wright21,34826.54-9.64
Labor hold Swing +9.64

Warringah

This section is an excerpt from Electoral results for the Division of Warringah § 2007
2007 Australian federal election: Warringah [6]
PartyCandidateVotes%±%
Liberal Tony Abbott 46,39854.53−0.97
Labor Hugh Zochling23,31727.40+2.29
Greens Conny Harris10,66012.53+0.71
Independent Patricia Petersen 1,5291.80−0.50
Democrats Georgina Johanson1,0951.29+1.04
Christian Democrats Bill McCudden1,0201.20+1.20
Climate Conservatives Goronwy Price6160.72+0.72
Independent Brett Middleton4560.54−0.83
Total formal votes85,09196.42+2.18
Informal votes3,1623.58−2.18
Turnout 88,25393.63−0.17
Two-party-preferred result
Liberal Tony Abbott 50,62759.50−1.79
Labor Hugh Zochling34,46440.50+1.79
Liberal hold Swing −1.79

Watson

This section is an excerpt from Electoral results for the Division of Watson § 2007
2007 Australian federal election: Watson
PartyCandidateVotes%±%
Labor Tony Burke 49,65261.81+5.43
Liberal Philip Mansour20,95726.09-5.54
Greens Christine Donayre5,3026.60+0.22
Family First Merry Foy2,0112.50+1.04
Christian Democrats Josephine Sammut1,9882.47+1.89
Ronald Poulsen4240.53+0.14
Total formal votes80,33490.95+0.11
Informal votes7,9979.05-0.11
Turnout 88,33193.31+0.44
Two-party-preferred result
Labor Tony Burke 56,49970.33+5.77
Liberal Philip Mansour23,83529.67-5.77
Labor hold Swing +5.77

Wentworth

This section is an excerpt from Electoral results for the Division of Wentworth § 2007
2007 Australian federal election: Wentworth
PartyCandidateVotes%±%
Liberal Malcolm Turnbull 44,46350.37+10.10
Labor George Newhouse 26,90330.48+1.55
Greens Susan Jarnason13,20514.96+2.10
Climate Change Dixie Coulton1,1561.31+1.31
Independent Dani Ecuyer7740.88+0.88
Democrats Pierce Field7210.82-0.28
Christian Democrats Bradley Molony3230.37+0.37
Independent Pat Sheil2650.30+0.06
Family First James Adams2550.29-0.04
Liberty & Democracy Jonatan Kelu1290.15+0.15
CEC John Jamieson780.09-0.01
Total formal votes88,27295.10+1.05
Informal votes4,5484.90-1.05
Turnout 92,82092.56-0.54
Two-party-preferred result
Liberal Malcolm Turnbull 47,53853.85+1.34
Labor George Newhouse 40,73446.15-1.34
Liberal hold Swing +1.34

Werriwa

This section is an excerpt from Electoral results for the Division of Werriwa § 2007
2007 Australian federal election: Werriwa
PartyCandidateVotes%±%
Labor Chris Hayes 46,89258.83+8.92
Liberal Rachel Elliott24,04630.17−7.44
Greens Neerav Bhatt3,0223.79+0.07
Independent Joe Bryant2,0162.53+2.53
Family First Andrew Mills1,9202.41+2.00
Christian Democrats Hany Gayed1,8142.28+1.90
Total formal votes79,71093.47+1.45
Informal votes5,5696.53−1.45
Turnout 85,27994.43+1.10
Two-party-preferred result
Labor Chris Hayes 51,99965.24+8.30
Liberal Rachel Elliott27,71134.76−8.30
Labor hold Swing +8.30

See also

Related Research Articles

Peter James Andren AM was an Australian politician. He was an independent member of the Australian House of Representatives from March 1996 until October 2007, representing the electorate of Calare, New South Wales.

Division of Calare Australian federal electoral division

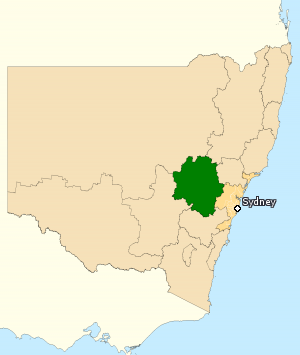
The Division of Calare is an Australian electoral division in the state of New South Wales.

Division of Macquarie Australian federal electoral division

The Division of Macquarie is an Australian electoral division in the state of New South Wales. The division was created in 1900 and was one of the original 65 divisions contested at the first federal election. It is named for Lachlan Macquarie, who was Governor of New South Wales between 1810 and 1821.

This article provides details on candidates who stood at the 2007 Australian federal election.

This is a list of electoral results for the Division of Calare in Australian federal elections from the division's creation in 1906 until the present.

The following tables show state-by-state results in the Australian House of Representatives at the 2007 federal election, 83 Labor, 65 coalition, 2 independent. Detailed results for all 150 seats are also available. The Nationals were reduced to nine seats and the coalition to 64 when independent Rob Oakeshott won the 2008 Lyne by-election.

This is a list of electoral results for the Division of Macquarie in Australian federal elections from the division's creation in 1901 until the present.

Results of the 2010 Australian federal election in New South Wales

This is a list of electoral division results for the Australian 2010 federal election in the state of New South Wales.

Results of the 2013 Australian federal election in New South Wales

This is a list of electoral division results for the Australian 2013 federal election in the state of New South Wales.

Results of the 2016 Australian federal election in New South Wales

This is a list of electoral division results for the 2016 Australian federal election in the state of New South Wales.

This is a list of electoral division results for the Australian 1954 federal election.

Results of the 2019 Australian federal election in New South Wales

This is a list of electoral division results for the 2019 Australian federal election in the state of New South Wales.

This is a list of electoral division results for the Australian 1946 federal election.

This is a list of electoral division results for the Australian 1949 federal election.

This is a list of electoral division results for the Australian 1951 federal election.

This is a list of electoral division results for the Australian 1955 federal election.

This is a list of electoral division results for the Australian 1969 federal election.

This is a list of electoral division results for the Australian 1974 federal election.

This is a list of electoral division results for the Australian 1977 federal election.

Results of the 2004 Australian federal election in New South Wales

This is a list of electoral division results in the Australian 2004 federal election for the state of New South Wales.

References

  1. 1 2 "2007 First preference votes for New South Wales". Australian Electoral Commission. Retrieved 4 June 2022.
  2. "2007 New South Wales division results". Australian Electoral Commission. Retrieved 24 May 2022.
  3. "2007 House of Representatives". Psephos Adam Carr's Election Archive. Retrieved 3 June 2022.
  4. 1 2 3 4 5 6 7 8 9 10 11 12 13 14 15 16 17 18 19 20 "2007 House of Representatives: NSW". Psephos Adam Carr's Election Archive. Retrieved 3 June 2022.
  5. "Redistribution forces Andren to decide on electorate". ABC News Online. ABC. 14 September 2006. Retrieved 3 June 2022.
  6. "2007 Warringah". Virtual Tally Room 2007. Australian Electoral Commission. Retrieved 20 August 2021.