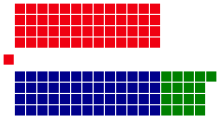
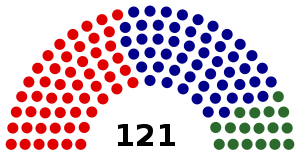
This is a list of electoral division results for the Australian 1951 federal election. [1]
Party | Votes | % | Swing | Seats | Change | ||
---|---|---|---|---|---|---|---|
Liberal–Country coalition | 2,298,512 | 50.34 | +0.08 | 69 | –5 | ||
Liberal | 1,854,799 | 40.62 | +1.23 | 52 | –3 | ||
Country | 443,713 | 9.72 | –1.15 | 17 | –2 | ||
Labor | 2,174,840 | 47.63 | +1.65 | 54 [lower-alpha 1] | +6 | ||
Communist | 44,782 | 0.98 | +0.09 | 0 | 0 | ||
Independents | 47,765 | 1.05 | –1.11 | 0 | –1 | ||
Total | 4,565,899 | 123 | |||||
Two-party-preferred (estimated) | |||||||
Liberal–Country coalition | Win | 50.70 | −0.30 | 69 | −5 | ||
Labor | 49.30 | +0.30 | 52 | +5 |
| |||||||||||||||||||||||||||||||||||||
All 47 NSW seats in the House of Representatives 24 seats needed for a majority | |||||||||||||||||||||||||||||||||||||
---|---|---|---|---|---|---|---|---|---|---|---|---|---|---|---|---|---|---|---|---|---|---|---|---|---|---|---|---|---|---|---|---|---|---|---|---|---|
|
Party | Candidate | Votes | % | ±% | |
---|---|---|---|---|---|
Labor | Eric Costa | 28,219 | 61.7 | +3.4 | |
Liberal | George Roffey | 17,536 | 38.3 | +1.8 | |
Total formal votes | 45,755 | 97.6 | |||
Informal votes | 1,143 | 2.4 | |||
Turnout | 46,898 | 95.8 | |||
Labor hold | Swing | −0.5 |
Party | Candidate | Votes | % | ±% | |
---|---|---|---|---|---|
Labor | Herbert Evatt | 20,949 | 50.3 | −2.9 | |
Liberal | Nancy Wake | 20,706 | 49.7 | +2.9 | |
Total formal votes | 41,655 | 98.6 | |||
Informal votes | 580 | 1.4 | |||
Turnout | 42,235 | 97.4 | |||
Labor hold | Swing | −2.9 |
Party | Candidate | Votes | % | ±% | |
---|---|---|---|---|---|
Liberal | John Cramer | 24,732 | 61.0 | +1.4 | |
Labor | William Fitzgibbon | 15,840 | 39.0 | −1.4 | |
Total formal votes | 40,572 | 98.1 | |||
Informal votes | 797 | 1.9 | |||
Turnout | 41,369 | 96.3 | |||
Liberal hold | Swing | +1.4 |
Party | Candidate | Votes | % | ±% | |
---|---|---|---|---|---|
Labor | Jim Harrison | 25,749 | 63.9 | +14.6 | |
Liberal | Jim Dennison | 14,547 | 36.1 | +12.3 | |
Total formal votes | 40,296 | 97.5 | |||
Informal votes | 1,039 | 2.5 | |||
Turnout | 41,335 | 94.9 | |||
Labor hold | Swing | +10.5 |
Party | Candidate | Votes | % | ±% | |
---|---|---|---|---|---|
Liberal | Billy Hughes | 32,469 | 78.7 | +7.3 | |
Labor | Hugh Milne | 8,784 | 21.3 | −0.4 | |
Total formal votes | 41,253 | 98.2 | |||
Informal votes | 762 | 1.8 | |||
Turnout | 42,015 | 95.8 | |||
Liberal hold | Swing | +3.8 |
Party | Candidate | Votes | % | ±% | |
---|---|---|---|---|---|
Liberal | John Howse | 20,517 | 54.4 | −2.9 | |
Labor | John Howell | 15,141 | 40.1 | −2.9 | |
Independent | Archibald Gardiner | 2,067 | 5.5 | +5.5 | |
Total formal votes | 37,725 | 98.7 | |||
Informal votes | 497 | 1.3 | |||
Turnout | 38,204 | 96.5 | |||
Two-party-preferred result | |||||
Liberal | John Howse | 56.2 | −0.8 | ||
Labor | John Howell | 43.8 | +0.8 | ||
Liberal hold | Swing | −0.8 |
Party | Candidate | Votes | % | ±% | |
---|---|---|---|---|---|
Labor | Tom Sheehan | 27,637 | 78.1 | +3.1 | |
Liberal | Roy Hatfield | 4,790 | 13.5 | −2.8 | |
Communist | Harry Hatfield | 2,976 | 8.4 | +4.9 | |
Total formal votes | 35,403 | 97.3 | |||
Informal votes | 965 | 2.7 | |||
Turnout | 36,368 | 94.4 | |||
Two-party-preferred result | |||||
Labor | Tom Sheehan | 85.7 | +3.6 | ||
Liberal | Roy Hatfield | 34.3 | −3.6 | ||
Labor hold | Swing | +3.6 |
Party | Candidate | Votes | % | ±% | |
---|---|---|---|---|---|
Country | Sir Earle Page | 22,632 | 61.0 | −0.7 | |
Labor | William Bailey | 13,743 | 37.0 | −1.3 | |
Independent | William Tomlinson | 724 | 2.0 | +2.0 | |
Total formal votes | 37,099 | 98.9 | |||
Informal votes | 425 | 1.1 | |||
Turnout | 37,524 | 96.7 | |||
Two-party-preferred result | |||||
Country | Sir Earle Page | 62.0 | +0.3 | ||
Labor | William Bailey | 38.0 | −0.3 | ||
Country hold | Swing | +0.3 |
Party | Candidate | Votes | % | ±% | |
---|---|---|---|---|---|
Labor | Billy Davies | 24,433 | 61.7 | +1.0 | |
Liberal | Alan Thomson | 12,674 | 32.0 | +0.3 | |
Communist | Eric Aarons | 2,466 | 6.2 | −1.4 | |
Total formal votes | 39,573 | 98.3 | |||
Informal votes | 691 | 1.7 | |||
Turnout | 40,264 | 96.1 | |||
Two-party-preferred result | |||||
Labor | Billy Davies | 67.7 | −0.5 | ||
Liberal | Alan Thomson | 32.3 | +0.5 | ||
Labor hold | Swing | −0.5 |
Party | Candidate | Votes | % | ±% | |
---|---|---|---|---|---|
Labor | Sol Rosevear | 24,851 | 67.1 | −5.9 | |
Liberal | John Laffin | 12,204 | 32.9 | +5.9 | |
Total formal votes | 37,055 | 97.7 | |||
Informal votes | 877 | 2.3 | |||
Turnout | 37,932 | 96.0 | |||
Labor hold | Swing | −5.9 |
Party | Candidate | Votes | % | ±% | |
---|---|---|---|---|---|
Labor | Joe Clark | 22,610 | 68.8 | +5.0 | |
Country | Elson Whyte | 10,253 | 31.2 | −0.5 | |
Total formal votes | 32,863 | 97.4 | |||
Informal votes | 864 | 2.6 | |||
Turnout | 33,727 | 94.5 | |||
Labor hold | Swing | +1.5 |
Party | Candidate | Votes | % | ±% | |
---|---|---|---|---|---|
Labor | Eddie Ward | 20,379 | 54.9 | −2.1 | |
Liberal | Allan Stewart | 16,767 | 45.1 | +6.1 | |
Total formal votes | 37,146 | 97.5 | |||
Informal votes | 961 | 2.5 | |||
Turnout | 38,107 | 94.2 | |||
Labor hold | Swing | -3.1 |
Party | Candidate | Votes | % | ±% | |
---|---|---|---|---|---|
Labor | Allan Fraser | 19,574 | 51.0 | +0.1 | |
Liberal | Bill Keys | 18,832 | 49.0 | −0.1 | |
Total formal votes | 38,406 | 98.9 | |||
Informal votes | 419 | 1.1 | |||
Turnout | 38,825 | 96.7 | |||
Labor hold | Swing | +0.1 |
Party | Candidate | Votes | % | ±% | |
---|---|---|---|---|---|
Liberal | Frederick Osborne | 21,936 | 58.6 | +2.0 | |
Labor | Robert Bailey | 15,467 | 41.4 | −2.0 | |
Total formal votes | 37,403 | 98.3 | |||
Informal votes | 666 | 1.7 | |||
Turnout | 38,069 | 96.3 | |||
Liberal hold | Swing | +2.0 |
Party | Candidate | Votes | % | ±% | |
---|---|---|---|---|---|
Liberal | David Fairbairn | 21,678 | 56.4 | +18.2 | |
Labor | Daniel Byrnes | 26,744 | 43.6 | +4.3 | |
Total formal votes | 38,422 | 98.5 | |||
Informal votes | 570 | 1.5 | |||
Turnout | 38,992 | 96.5 | |||
Liberal hold | Swing | -2.4 |
Party | Candidate | Votes | % | ±% | |
---|---|---|---|---|---|
Labor | Fred Daly | 23,038 | 74.9 | +7.8 | |
Liberal | Roy Squire | 8,398 | 22.4 | −7.2 | |
Republican | William McCristal | 977 | 2.6 | +1.7 | |
Total formal votes | 37,413 | 97.7 | |||
Informal votes | 869 | 2.3 | |||
Turnout | 38,282 | 96.1 | |||
Two-party-preferred result | |||||
Labor | Fred Daly | 76.2 | +6.5 | ||
Liberal | Roy Squire | 23.8 | −6.5 | ||
Labor hold | Swing | +6.5 |
Party | Candidate | Votes | % | ±% | |
---|---|---|---|---|---|
Country | Thomas Treloar | 19,460 | 53.2 | −1.9 | |
Labor | Norman Ferguson | 17,147 | 46.8 | +1.9 | |
Total formal votes | 36,607 | 98.9 | |||
Informal votes | 408 | 1.1 | |||
Turnout | 37,015 | 95.5 | |||
Country hold | Swing | -1.9 |
Party | Candidate | Votes | % | ±% | |
---|---|---|---|---|---|
Labor | Arthur Fuller | 18,849 | 50.3 | +1.3 | |
Country | Charles Anderson | 18,622 | 49.7 | −1.3 | |
Total formal votes | 37,471 | 99.0 | |||
Informal votes | 374 | 1.0 | |||
Turnout | 37,845 | 96.2 | |||
Labor gain from Country | Swing | +1.3 |
Party | Candidate | Votes | % | ±% | |
---|---|---|---|---|---|
Labor | Rowley James | 28,595 | 70.8 | +2.2 | |
Liberal | Ted Fletcher | 6,810 | 16.9 | −4.9 | |
Communist | Evan Phillips | 2,927 | 7.2 | −2.4 | |
Independent | Arthur English | 2,075 | 5.1 | +5.1 | |
Total formal votes | 40,407 | 97.6 | |||
Informal votes | 1,007 | 2.4 | |||
Turnout | 41,414 | 97.1 | |||
Two-party-preferred result | |||||
Labor | Rowley James | 78.9 | +1.6 | ||
Liberal | Ted Fletcher | 21.1 | −1.6 | ||
Labor hold | Swing | +1.6 |
Party | Candidate | Votes | % | ±% | |
---|---|---|---|---|---|
Labor | Gordon Anderson | 18,110 | 50.5 | +0.8 | |
Liberal | Arthur Butterell | 17,784 | 49.5 | +3.0 | |
Total formal votes | 35,894 | 98.0 | |||
Informal votes | 740 | 2.0 | |||
Turnout | 36,634 | 95.3 | |||
Labor hold | Swing | -0.4 |
Party | Candidate | Votes | % | ±% | |
---|---|---|---|---|---|
Labor | Dan Mulcahy | 20,944 | 50.0 | −0.2 | |
Liberal | Robert Bruce | 18,951 | 45.3 | +0.2 | |
Communist | Roy Boyd | 1,968 | 4.7 | +0.0 | |
Total formal votes | 41,863 | 98.3 | |||
Informal votes | 721 | 1.7 | |||
Turnout | 42,584 | 97.4 | |||
Two-party-preferred result | |||||
Labor | Dan Mulcahy | 53.2 | −1.5 | ||
Liberal | Robert Bruce | 46.8 | +1.5 | ||
Labor hold | Swing | -1.5 |
Party | Candidate | Votes | % | ±% | |
---|---|---|---|---|---|
Country | Laurie Failes | 19,819 | 53.0 | +22.0 | |
Labor | Alan Manning | 17,570 | 47.0 | +4.0 | |
Total formal votes | 37,389 | 98.4 | |||
Informal votes | 607 | 1.6 | |||
Turnout | 37,996 | 96.3 | |||
Country hold | Swing | -2.8 |
Party | Candidate | Votes | % | ±% | |
---|---|---|---|---|---|
Liberal | William McMahon | 22,276 | 57.8 | +5.1 | |
Labor | John Burton | 16,250 | 42.2 | +1.3 | |
Total formal votes | 38,526 | 98.7 | |||
Informal votes | 521 | 1.3 | |||
Turnout | 39,047 | 97.0 | |||
Liberal hold | Swing | -0.7 |
Party | Candidate | Votes | % | ±% | |
---|---|---|---|---|---|
Country | Jim Eggins | 24,971 | 65.5 | −4.0 | |
Labor | Edward Hayes | 11,381 | 29.9 | +2.3 | |
Independent | Joe Cordner | 1,745 | 4.6 | +1.7 | |
Total formal votes | 38,097 | 98.4 | |||
Informal votes | 615 | 1.6 | |||
Turnout | 38,712 | 97.0 | |||
Two-party-preferred result | |||||
Country | Jim Eggins | 68.8 | +2.8 | ||
Labor | Edward Hayes | 31.2 | −2.8 | ||
Country hold | Swing | +2.8 |
Party | Candidate | Votes | % | ±% | |
---|---|---|---|---|---|
Liberal | Jeff Bate | 25,835 | 63.8 | −0.8 | |
Labor | William McDonnell | 14,633 | 36.2 | +0.8 | |
Total formal votes | 40,468 | 98.5 | |||
Informal votes | 622 | 1.5 | |||
Turnout | 41,090 | 96.0 | |||
Liberal hold | Swing | -0.8 |
Party | Candidate | Votes | % | ±% | |
---|---|---|---|---|---|
Liberal | Bill Wentworth | 26,832 | 63.1 | +0.5 | |
Labor | Thomas Sherley | 15,684 | 36.9 | −0.5 | |
Total formal votes | 42,516 | 98.8 | |||
Informal votes | 953 | 2.2 | |||
Turnout | 43,469 | 95.2 | |||
Liberal hold | Swing | +0.5 |
Party | Candidate | Votes | % | ±% | |
---|---|---|---|---|---|
Labor | Ben Chifley | 23,136 | 61.8 | +4.1 | |
Liberal | Bob Cotton | 14,325 | 38.2 | −0.6 | |
Total formal votes | 37,461 | 98.5 | |||
Informal votes | 555 | 1.5 | |||
Turnout | 38,016 | 96.9 | |||
Labor hold | Swing | +0.8 |
Party | Candidate | Votes | % | ±% | |
---|---|---|---|---|---|
Labor | William O'Connor | 20,362 | 53.9 | +0.4 | |
Liberal | George Read | 14,132 | 37.4 | −0.4 | |
Communist | Terry Gordon | 2,379 | 6.3 | +1.5 | |
Independent | Malinda Ivey | 908 | 2.4 | +2.4 | |
Total formal votes | 37,781 | 97.5 | |||
Informal votes | 974 | 2.5 | |||
Turnout | 38,755 | 96.6 | |||
Two-party-preferred result | |||||
Labor | William O'Connor | 60.8 | +1.2 | ||
Liberal | George Read | 39.2 | −1.2 | ||
Labor hold | Swing | +1.2 |
Party | Candidate | Votes | % | ±% | |
---|---|---|---|---|---|
Liberal | Roy Wheeler | 23,028 | 53.8 | −3.1 | |
Labor | Joseph White | 17,580 | 41.1 | −2.0 | |
Communist | Mel McCalman | 2,158 | 5.0 | +5.0 | |
Total formal votes | 42,766 | 97.8 | |||
Informal votes | 978 | 2.2 | |||
Turnout | 43,744 | 95.7 | |||
Two-party-preferred result | |||||
Liberal | Roy Wheeler | 55.3 | −1.6 | ||
Labor | Joseph White | 44.7 | +1.6 | ||
Liberal hold | Swing | -1.6 |
Party | Candidate | Votes | % | ±% | |
---|---|---|---|---|---|
Country | David Drummond | 21,259 | 57.9 | −5.1 | |
Labor | William Wilson | 15,462 | 42.1 | +5.1 | |
Total formal votes | 36,721 | 98.7 | |||
Informal votes | 491 | 1.3 | |||
Turnout | 37,212 | 96.7 | |||
Country hold | Swing | -3.3 |
Party | Candidate | Votes | % | ±% | |
---|---|---|---|---|---|
Labor | David Watkins | 23,152 | 60.5 | +4.8 | |
Liberal | Roy Stewart | 13,485 | 35.2 | −4.7 | |
Communist | Laurie Aarons | 1,645 | 4.3 | +1.1 | |
Total formal votes | 38,282 | 98.4 | |||
Informal votes | 606 | 1.6 | |||
Turnout | 38,888 | 96.9 | |||
Two-party-preferred result | |||||
Labor | David Watkins | 63.4 | +5.1 | ||
Liberal | Roy Stewart | 36.6 | −5.1 | ||
Labor hold | Swing | +5.1 |
Party | Candidate | Votes | % | ±% | |
---|---|---|---|---|---|
Liberal | William Jack | 22,110 | 58.0 | +7.1 | |
Labor | Eileen Powell | 15,984 | 42.0 | +0.3 | |
Total formal votes | 38,094 | 98.3 | |||
Informal votes | 643 | 1.7 | |||
Turnout | 38,737 | 96.4 | |||
Liberal hold | Swing | +4.7 |
Party | Candidate | Votes | % | ±% | |
---|---|---|---|---|---|
Labor | Les Haylen | 18,964 | 50.9 | −0.9 | |
Liberal | Dick Dein | 18,283 | 49.1 | +0.9 | |
Total formal votes | 37,247 | 98.2 | |||
Informal votes | 676 | 1.8 | |||
Turnout | 37,923 | 96.1 | |||
Labor hold | Swing | -0.9 |
Party | Candidate | Votes | % | ±% | |
---|---|---|---|---|---|
Liberal | Howard Beale | 26,852 | 63.5 | +0.9 | |
Labor | John Holmes | 15,422 | 36.5 | −0.9 | |
Total formal votes | 42,274 | 98.0 | |||
Informal votes | 855 | 2.0 | |||
Turnout | 43,129 | 96.2 | |||
Liberal hold | Swing | +0.9 |
Party | Candidate | Votes | % | ±% | |
---|---|---|---|---|---|
Liberal | Allen Fairhall | 21,677 | 57.1 | +27.0 | |
Labor | Cecil Robinson | 16,312 | 42.9 | +5.0 | |
Total formal votes | 37,989 | 98.1 | |||
Informal votes | 736 | 1.9 | |||
Turnout | 38,725 | 97.1 | |||
Liberal hold | Swing | -1.4 |
Party | Candidate | Votes | % | ±% | |
---|---|---|---|---|---|
Labor | Joe Fitzgerald | 19,401 | 53.4 | +2.2 | |
Liberal | Les Fingleton | 16,913 | 46.6 | +3.7 | |
Total formal votes | 36,314 | 97.9 | |||
Informal votes | 779 | 2.1 | |||
Turnout | 37,093 | 95.4 | |||
Labor hold | Swing | -2.3 |
Party | Candidate | Votes | % | ±% | |
---|---|---|---|---|---|
Labor | Charles Morgan | 28,115 | 62.4 | +4.3 | |
Liberal | Jim Clough | 15,051 | 33.4 | +4.4 | |
Independent | Rupert Sheldon | 1,903 | 4.2 | +4.2 | |
Total formal votes | 45,069 | 98.1 | |||
Informal votes | 895 | 1.9 | |||
Turnout | 45,964 | 96.2 | |||
Two-party-preferred result | |||||
Labor | Charles Morgan | 65.6 | −2.2 | ||
Liberal | Jim Clough | 34.4 | +2.2 | ||
Labor hold | Swing | -2.2 |
Party | Candidate | Votes | % | ±% | |
---|---|---|---|---|---|
Country | Larry Anthony | 28,034 | 76.3 | +1.2 | |
Labor | Alexander Bryen | 8,718 | 23.7 | −1.2 | |
Total formal votes | 36,752 | 98.7 | |||
Informal votes | 486 | 1.3 | |||
Turnout | 37,238 | 96.4 | |||
Country hold | Swing | +1.2 |
Party | Candidate | Votes | % | ±% | |
---|---|---|---|---|---|
Country | Hugh Roberton | 19,781 | 53.3 | +0.0 | |
Labor | Michael Sheehan | 15,975 | 43.0 | −2.2 | |
Communist | Les Kelton | 1,358 | 3.7 | +2.2 | |
Total formal votes | 37,114 | 98.6 | |||
Informal votes | 510 | 1.4 | |||
Turnout | 37,624 | 95.1 | |||
Two-party-preferred result | |||||
Country | Hugh Roberton | 54.7 | +1.2 | ||
Labor | Michael Sheehan | 45.3 | −1.2 | ||
Country hold | Swing | +1.2 |
Party | Candidate | Votes | % | ±% | |
---|---|---|---|---|---|
Liberal | Roger Dean | 22,804 | 54.0 | −0.2 | |
Labor | Walter Geraghty | 19,406 | 46.0 | +0.2 | |
Total formal votes | 42,210 | 98.0 | |||
Informal votes | 874 | 2.0 | |||
Turnout | 43,084 | 96.2 | |||
Liberal hold | Swing | -0.2 |
Party | Candidate | Votes | % | ±% | |
---|---|---|---|---|---|
Labor | Charles Griffiths | 26,708 | 65.0 | +10.6 | |
Liberal | Arthur Downey | 14,369 | 35.0 | +8.9 | |
Total formal votes | 41,077 | 98.1 | |||
Informal votes | 781 | 1.9 | |||
Turnout | 41,858 | 97.0 | |||
Labor hold | Swing | +0.9 |
Party | Candidate | Votes | % | ±% | |
---|---|---|---|---|---|
Liberal | Bill Graham | 19,890 | 51.6 | −0.4 | |
Labor | Nelson Lemmon | 18,670 | 48.4 | +0.4 | |
Total formal votes | 38,560 | 98.3 | |||
Informal votes | 654 | 1.7 | |||
Turnout | 39,214 | 97.0 | |||
Liberal hold | Swing | -0.4 |
Party | Candidate | Votes | % | ±% | |
---|---|---|---|---|---|
Liberal | Francis Bland | 29,362 | 75.7 | +5.4 | |
Labor | Frank McCullum | 9,417 | 24.3 | +24.3 | |
Total formal votes | 38,779 | 98.2 | |||
Informal votes | 691 | 1.8 | |||
Turnout | 39,470 | 95.4 | |||
Liberal hold | Swing | +5.4 |
Party | Candidate | Votes | % | ±% | |
---|---|---|---|---|---|
Labor | Dan Curtin | 22,510 | 56.7 | +7.3 | |
Liberal | Donald Clark | 17,158 | 43.3 | +5.0 | |
Total formal votes | 39,668 | 97.4 | |||
Informal votes | 1,051 | 2.6 | |||
Turnout | 40,719 | 95.6 | |||
Labor hold | Swing | -2.3 |
Party | Candidate | Votes | % | ±% | |
---|---|---|---|---|---|
Liberal | Eric Harrison | 28,127 | 75.7 | +0.6 | |
Labor | Cecil Trevelyan | 9,041 | 24.3 | −0.6 | |
Total formal votes | 37,168 | 98.4 | |||
Informal votes | 614 | 1.6 | |||
Turnout | 37,782 | 95.3 | |||
Liberal hold | Swing | +0.6 |
Party | Candidate | Votes | % | ±% | |
---|---|---|---|---|---|
Labor | Bert Lazzarini | 26,104 | 55.1 | −1.1 | |
Liberal | Ian Griffith | 21,257 | 44.9 | +1.1 | |
Total formal votes | 47,361 | 97.7 | |||
Informal votes | 1,114 | 2.3 | |||
Turnout | 48,475 | 95.6 | |||
Labor hold | Swing | −1.1 |
Party | Candidate | Votes | % | ±% | |
---|---|---|---|---|---|
Labor | Dan Minogue | 21,123 | 63.4 | +13.6 | |
Liberal | Basil Mottershead | 8,203 | 24.6 | +4.3 | |
Communist | Jack Miles | 3,483 | 10.4 | +5.4 | |
Independent Labor | Clare Peters | 528 | 1.6 | +1.6 | |
Total formal votes | 33,337 | 96.2 | |||
Informal votes | 1,300 | 3.8 | |||
Turnout | 34,637 | 91.9 | |||
Two-party-preferred result | |||||
Labor | Dan Minogue | 74.6 | +18.9 | ||
Liberal | Basil Mottershead | 25.4 | +25.4 | ||
Labor hold | Swing | +18.9 |
| |||||||||||||||||||||||||||||||||||||
All 33 Victorian seats in the House of Representatives 17 seats needed for a majority | |||||||||||||||||||||||||||||||||||||
---|---|---|---|---|---|---|---|---|---|---|---|---|---|---|---|---|---|---|---|---|---|---|---|---|---|---|---|---|---|---|---|---|---|---|---|---|---|
|
Party | Candidate | Votes | % | ±% | |
---|---|---|---|---|---|
Liberal | Thomas White | 25,578 | 63.3 | −0.6 | |
Labor | Arthur Lewis | 14,845 | 36.7 | +0.6 | |
Total formal votes | 40,423 | 98.7 | |||
Informal votes | 525 | 1.3 | |||
Turnout | 40,948 | 96.1 | |||
Liberal hold | Swing | −0.6 |
Party | Candidate | Votes | % | ±% | |
---|---|---|---|---|---|
Labor | Bob Joshua | 20,482 | 51.2 | +1.6 | |
Liberal | Alan Pittard | 19,517 | 48.8 | −1.6 | |
Total formal votes | 39,999 | 99.1 | |||
Informal votes | 356 | 0.9 | |||
Turnout | 40,355 | 97.2 | |||
Labor gain from Liberal | Swing | +1.6 |
Party | Candidate | Votes | % | ±% | |
---|---|---|---|---|---|
Labor | Alan Bird | 23,335 | 60.6 | +2.2 | |
Liberal | Fred Capp | 15,184 | 39.4 | −2.2 | |
Total formal votes | 38,519 | 98.3 | |||
Informal votes | 673 | 1.7 | |||
Turnout | 39,192 | 95.8 | |||
Labor hold | Swing | +2.2 |
Party | Candidate | Votes | % | ±% | |
---|---|---|---|---|---|
Labor | Percy Clarey | 21,975 | 53.6 | +6.6 | |
Liberal | Charles Carty-Salmon | 18,997 | 46.4 | −1.3 | |
Total formal votes | 40,972 | 98.8 | |||
Informal votes | 509 | 1.2 | |||
Turnout | 41,481 | 96.8 | |||
Labor hold | Swing | +3.4 |
Party | Candidate | Votes | % | ±% | |
---|---|---|---|---|---|
Labor | Ted Peters | 27,422 | 72.4 | +10.3 | |
Liberal | Alfred Wall | 10,446 | 27.6 | +2.4 | |
Total formal votes | 37,868 | 97.8 | |||
Informal votes | 861 | 2.2 | |||
Turnout | 38,729 | 96.1 | |||
Labor hold | Swing | +3.0 |
Party | Candidate | Votes | % | ±% | |
---|---|---|---|---|---|
Liberal | Wilfrid Kent Hughes | 27,016 | 65.0 | +0.3 | |
Labor | Ronald Whiting | 14,563 | 35.0 | +1.9 | |
Total formal votes | 41,579 | 98.8 | |||
Informal votes | 501 | 1.2 | |||
Turnout | 42,080 | 95.7 | |||
Liberal hold | Swing | +0.1 |
Party | Candidate | Votes | % | ±% | |
---|---|---|---|---|---|
Liberal | Allan McDonald | 22,087 | 58.7 | +1.2 | |
Labor | Angus McLean | 15,535 | 41.3 | +1.7 | |
Total formal votes | 37,622 | 99.1 | |||
Informal votes | 357 | 0.9 | |||
Turnout | 37,979 | 97.0 | |||
Liberal hold | Swing | −1.3 |
Party | Candidate | Votes | % | ±% | |
---|---|---|---|---|---|
Liberal | Hubert Opperman | 20,731 | 50.2 | −0.1 | |
Labor | John Dedman | 20,592 | 49.8 | +0.1 | |
Total formal votes | 41,323 | 99.1 | |||
Informal votes | 368 | 0.9 | |||
Turnout | 41,691 | 96.2 | |||
Liberal hold | Swing | −0.1 |
Party | Candidate | Votes | % | ±% | |
---|---|---|---|---|---|
Labor | Tom Andrews | 26,412 | 64.4 | +1.7 | |
Liberal | Gordon Savage | 14,572 | 35.6 | −1.7 | |
Total formal votes | 40,984 | 98.6 | |||
Informal votes | 581 | 1.4 | |||
Turnout | 41,565 | 96.9 | |||
Labor hold | Swing | +1.7 |
Party | Candidate | Votes | % | ±% | |
---|---|---|---|---|---|
Liberal | Frank Davis | 22,946 | 48.6 | −7.0 | |
Labor | Gordon Bryant | 21,908 | 46.4 | +2.0 | |
Independent | Eric Butler | 2,364 | 5.0 | +5.0 | |
Total formal votes | 47,218 | 98.7 | |||
Informal votes | 617 | 1.3 | |||
Turnout | 47,835 | 95.3 | |||
Two-party-preferred result | |||||
Liberal | Frank Davis | 24,347 | 51.6 | −4.0 | |
Labor | Gordon Bryant | 22,871 | 48.4 | +4.0 | |
Liberal hold | Swing | -4.0 |
Party | Candidate | Votes | % | ±% | |
---|---|---|---|---|---|
Labor | Bill Bourke | 20,158 | 51.6 | +1.6 | |
Liberal | Peter Howson | 18,586 | 47.6 | −2.4 | |
Independent | Colin Kennedy | 332 | 0.8 | +0.8 | |
Total formal votes | 39,076 | 98.3 | |||
Informal votes | 681 | 1.7 | |||
Turnout | 39,757 | 95.7 | |||
Two-party-preferred result | |||||
Labor | Bill Bourke | 52.0 | +2.0 | ||
Liberal | Peter Howson | 48.0 | −2.0 | ||
Labor hold | Swing | +2.0 |
Party | Candidate | Votes | % | ±% | |
---|---|---|---|---|---|
Liberal | Rupert Ryan | 22,728 | 54.8 | +0.0 | |
Labor | Keith Ewert | 17,833 | 43.0 | +13.4 | |
Independent | Robert Hipwell | 891 | 2.1 | +2.1 | |
Total formal votes | 41,452 | 98.4 | |||
Informal votes | 663 | 1.6 | |||
Turnout | 42,115 | 96.2 | |||
Two-party-preferred result | |||||
Liberal | Rupert Ryan | 55.9 | −7.7 | ||
Labor | Keith Ewert | 44.1 | +7.7 | ||
Liberal hold | Swing | -7.7 |
Party | Candidate | Votes | % | ±% | |
---|---|---|---|---|---|
Labor | John Mullens | 25,863 | 64.9 | +13.6 | |
Liberal | Gordon Trewin | 9,973 | 25.0 | −2.8 | |
Communist | Alex Dobbin | 4,003 | 10.0 | +6.5 | |
Total formal votes | 39,839 | 97.8 | |||
Informal votes | 896 | 2.2 | |||
Turnout | 40,735 | 96.5 | |||
Two-party-preferred result | |||||
Labor | John Mullens | 74.4 | +4.7 | ||
Liberal | Gordon Trewin | 25.6 | −4.7 | ||
Labor hold | Swing | +4.7 |
Party | Candidate | Votes | % | ±% | |
---|---|---|---|---|---|
Country | George Bowden | 22,799 | 65.1 | −1.6 | |
Labor | Victor Fitzgerald | 12,247 | 34.9 | +1.6 | |
Total formal votes | 35,046 | 98.5 | |||
Informal votes | 521 | 1.5 | |||
Turnout | 35,567 | 95.9 | |||
Country hold | Swing | -1.6 |
Party | Candidate | Votes | % | ±% | |
---|---|---|---|---|---|
Liberal | Jo Gullett | 23,642 | 57.3 | +2.1 | |
Labor | Percy Treyvaud | 16,814 | 40.8 | −1.9 | |
Communist | Doris McRae | 781 | 1.9 | +1.9 | |
Total formal votes | 41,237 | 98.6 | |||
Informal votes | 584 | 1.4 | |||
Turnout | 41,821 | 96.4 | |||
Two-party-preferred result | |||||
Liberal | Jo Gullett | 57.5 | +2.1 | ||
Labor | Percy Treyvaud | 42.5 | −2.1 | ||
Liberal hold | Swing | +2.1 |
Party | Candidate | Votes | % | ±% | |
---|---|---|---|---|---|
Liberal | Harold Holt | 24,217 | 64.4 | −2.4 | |
Labor | Benjamin Nicholas | 11,490 | 30.5 | −2.7 | |
Independent | Mary Kent Hughes | 1,925 | 5.1 | +5.1 | |
Total formal votes | 37,632 | 98.5 | |||
Informal votes | 584 | 1.5 | |||
Turnout | 38,216 | 94.2 | |||
Two-party-preferred result | |||||
Liberal | Harold Holt | 68.2 | +1.4 | ||
Labor | Benjamin Nicholas | 31.8 | −1.4 | ||
Liberal hold | Swing | +1.4 |
Party | Candidate | Votes | % | ±% | |
---|---|---|---|---|---|
Liberal | Frank Timson | 25,493 | 54.4 | +0.8 | |
Labor | Geoffrey Sowerbutts | 21,368 | 45.6 | −0.8 | |
Total formal votes | 46,861 | 98.6 | |||
Informal votes | 644 | 1.4 | |||
Turnout | 47,505 | 96.4 | |||
Liberal hold | Swing | +0.8 |
Party | Candidate | Votes | % | ±% | |
---|---|---|---|---|---|
Labor | Jack Cremean | 27,685 | 78.7 | +1.6 | |
Liberal | Jack Easton | 6,193 | 17.6 | −0.3 | |
Communist | Leslie Loye | 1,310 | 3.7 | +0.6 | |
Total formal votes | 35,188 | 96.5 | |||
Informal votes | 1,276 | 3.5 | |||
Turnout | 36,464 | 94.4 | |||
Two-party-preferred result | |||||
Labor | Jack Cremean | 82.1 | +1.3 | ||
Liberal | Jack Easton | 17.9 | −1.3 | ||
Labor hold | Swing | +1.3 |
Party | Candidate | Votes | % | ±% | |
---|---|---|---|---|---|
Liberal | William Bostock | 22,137 | 58.6 | +25.3 | |
Labor | Charles Edmondson | 15,623 | 41.4 | +4.7 | |
Total formal votes | 37,760 | 98.8 | |||
Informal votes | 445 | 1.2 | |||
Turnout | 38,205 | 95.5 | |||
Liberal hold | Swing | −1.1 |
Party | Candidate | Votes | % | ±% | |
---|---|---|---|---|---|
Liberal | William Haworth | 19,548 | 51.5 | −2.5 | |
Labor | John Bourke | 16,165 | 42.6 | −3.4 | |
Independent Labor | Sam Goldbloom | 2,224 | 5.9 | +5.9 | |
Total formal votes | 37,937 | 97.9 | |||
Informal votes | 818 | 2.1 | |||
Turnout | 38,755 | 94.6 | |||
Two-party-preferred result | |||||
Liberal | William Haworth | 52.1 | −1.9 | ||
Labor | John Bourke | 47.9 | +1.9 | ||
Liberal hold | Swing | -1.9 |
Party | Candidate | Votes | % | ±% | |
---|---|---|---|---|---|
Liberal | Robert Menzies | 28,174 | 67.4 | +0.3 | |
Labor | Maurice Sheehy | 11,873 | 28.4 | −4.5 | |
Communist | Ted Laurie | 1,734 | 4.2 | +4.2 | |
Total formal votes | 41,781 | 98.8 | |||
Informal votes | 516 | 1.2 | |||
Turnout | 42,297 | 96.2 | |||
Two-party-preferred result | |||||
Liberal | Robert Menzies | 68.8 | +1.7 | ||
Labor | Maurice Sheehy | 31.2 | −1.7 | ||
Liberal hold | Swing | +1.7 |
Party | Candidate | Votes | % | ±% | |
---|---|---|---|---|---|
Liberal | Richard Casey | 26,920 | 58.0 | −0.6 | |
Labor | Bernard Rees | 19,464 | 42.0 | +0.6 | |
Total formal votes | 46,384 | 98.1 | |||
Informal votes | 877 | 1.9 | |||
Turnout | 47,261 | 96.0 | |||
Liberal hold | Swing | −0.6 |
Party | Candidate | Votes | % | ±% | |
---|---|---|---|---|---|
Labor | Reg Pollard | 23,278 | 54.9 | +3.3 | |
Liberal | Allen Bateman | 19,103 | 45.1 | −3.3 | |
Total formal votes | 42,381 | 98.5 | |||
Informal votes | 635 | 1.5 | |||
Turnout | 43,016 | 95.2 | |||
Labor hold | Swing | +3.3 |
Party | Candidate | Votes | % | ±% | |
---|---|---|---|---|---|
Country | Winton Turnbull | 21,784 | 61.7 | −2.9 | |
Labor | Alfred O'Connor | 13,542 | 38.3 | +2.9 | |
Total formal votes | 35,326 | 98.5 | |||
Informal votes | 527 | 1.5 | |||
Turnout | 35,853 | 97.5 | |||
Country hold | Swing | −2.9 |
Party | Candidate | Votes | % | ±% | |
---|---|---|---|---|---|
Labor | Arthur Drakeford | 27,963 | 64.3 | +2.4 | |
Liberal | Stuart Collie | 15,502 | 35.7 | +1.6 | |
Total formal votes | 43,465 | 98.5 | |||
Informal votes | 661 | 1.5 | |||
Turnout | 44,126 | 96.9 | |||
Labor hold | Swing | +0.3 |
Party | Candidate | Votes | % | ±% | |
---|---|---|---|---|---|
Liberal | Geoffrey Brown | 21,465 | 55.7 | +23.3 | |
Labor | Horace Hawkins | 15,717 | 40.8 | +2.1 | |
Communist | Fred Charlesworth | 1,328 | 3.4 | +0.9 | |
Total formal votes | 38,510 | 98.1 | |||
Informal votes | 747 | 1.9 | |||
Turnout | 39,257 | 95.7 | |||
Two-party-preferred result | |||||
Liberal | Geoffrey Brown | 56.0 | −0.9 | ||
Labor | Horace Hawkins | 44.0 | +0.9 | ||
Liberal hold | Swing | -0.9 |
Party | Candidate | Votes | % | ±% | |
---|---|---|---|---|---|
Labor | Arthur Calwell | 23,131 | 63.0 | −1.5 | |
Liberal | Desmond Byrne | 12,168 | 33.1 | +8.1 | |
Communist | Gerry O'Day | 1,441 | 3.9 | +0.6 | |
Total formal votes | 36,740 | 96.5 | |||
Informal votes | 1,324 | 3.5 | |||
Turnout | 38,064 | 93.8 | |||
Two-party-preferred result | |||||
Labor | Arthur Calwell | 66.6 | −4.3 | ||
Liberal | Desmond Byrne | 33.4 | +4.3 | ||
Labor hold | Swing | -4.3 |
Party | Candidate | Votes | % | ±% | |
---|---|---|---|---|---|
Labor | Frank Crean | 26,502 | 71.2 | +3.3 | |
Liberal | Michael Prowse | 10,740 | 28.8 | −3.3 | |
Total formal votes | 37,242 | 97.8 | |||
Informal votes | 839 | 2.2 | |||
Turnout | 38,081 | 94.9 | |||
Labor hold | Swing | +3.3 |
Party | Candidate | Votes | % | ±% | |
---|---|---|---|---|---|
Country | John McEwen | 23,248 | 61.0 | −2.5 | |
Labor | Gordon Anderson | 14,834 | 39.0 | +2.5 | |
Total formal votes | 38,082 | 98.7 | |||
Informal votes | 502 | 1.3 | |||
Turnout | 38,584 | 96.1 | |||
Country hold | Swing | -2.5 |
Party | Candidate | Votes | % | ±% | |
---|---|---|---|---|---|
Labor | Don McLeod | 18,427 | 51.1 | +4.0 | |
Liberal | Dan Mackinnon | 17,601 | 48.9 | +12.0 | |
Total formal votes | 36,028 | 99.2 | |||
Informal votes | 299 | 0.8 | |||
Turnout | 36,327 | 97.6 | |||
Labor gain from Liberal | Swing | +1.9 |
Party | Candidate | Votes | % | ±% | |
---|---|---|---|---|---|
Labor | Bill Bryson | 21,136 | 48.9 | +4.7 | |
Liberal | Baden Grafen | 14,461 | 33.5 | −1.8 | |
Progressive Labor | Doris Blackburn | 7,595 | 17.6 | −3.0 | |
Total formal votes | 43,192 | 98.2 | |||
Informal votes | 782 | 1.8 | |||
Turnout | 43,974 | 96.3 | |||
Two-party-preferred result | |||||
Labor | Bill Bryson | 26,682 | 61.8 | +3.0 | |
Liberal | Baden Grafen | 16,510 | 38.2 | −3.0 | |
Labor hold | Swing | +3.0 |
Party | Candidate | Votes | % | ±% | |
---|---|---|---|---|---|
Liberal | William Lawrence | 22,005 | 63.0 | +24.0 | |
Labor | Cyril Sudholz | 12,932 | 37.0 | +5.3 | |
Total formal votes | 34,937 | 99.0 | |||
Informal votes | 358 | 1.0 | |||
Turnout | 35,295 | 96.9 | |||
Liberal hold | Swing | -1.9 |
Party | Candidate | Votes | % | ±% | |
---|---|---|---|---|---|
Labor | Stan Keon | 23,039 | 60.1 | +1.3 | |
Liberal | Kenneth Bisney | 13,668 | 35.7 | −0.2 | |
Communist | Ken Miller | 1,619 | 4.2 | +1.4 | |
Total formal votes | 38,326 | 97.7 | |||
Informal votes | 883 | 2.3 | |||
Turnout | 39,209 | 95.6 | |||
Two-party-preferred result | |||||
Labor | Stan Keon | 63.9 | +1.2 | ||
Liberal | Kenneth Bisney | 36.1 | −1.2 | ||
Labor hold | Swing | +1.2 |
| |||||||||||||||||||||||||||||||||||||
All 18 Queensland seats in the House of Representatives 9 seats needed for a majority | |||||||||||||||||||||||||||||||||||||
---|---|---|---|---|---|---|---|---|---|---|---|---|---|---|---|---|---|---|---|---|---|---|---|---|---|---|---|---|---|---|---|---|---|---|---|---|---|
|
Party | Candidate | Votes | % | ±% | |
---|---|---|---|---|---|
Liberal | Malcolm McColm | 21,410 | 54.1 | +0.7 | |
Labor | Michael Lyons | 16,637 | 42.0 | −2.9 | |
Communist | Mabel Hanson | 1,552 | 3.9 | +2.2 | |
Total formal votes | 39,599 | 97.8 | |||
Informal votes | 907 | 2.2 | |||
Turnout | 40,506 | 96.0 | |||
Two-party-preferred result | |||||
Liberal | Malcolm McColm | 55.6 | +1.8 | ||
Labor | Michael Lyons | 44.4 | −1.8 | ||
Liberal hold | Swing | +1.8 |
Party | Candidate | Votes | % | ±% | |
---|---|---|---|---|---|
Labor | George Lawson | 18,588 | 53.6 | +1.3 | |
Liberal | Donagh McDonagh | 13,883 | 40.0 | −2.3 | |
Communist | Alby Graham | 2,225 | 6.4 | +1.0 | |
Total formal votes | 34,696 | 97.5 | |||
Informal votes | 886 | 2.5 | |||
Turnout | 35,582 | 93.5 | |||
Two-party-preferred result | |||||
Labor | George Lawson | 59.5 | +2.2 | ||
Liberal | Donagh McDonagh | 40.5 | −2.2 | ||
Labor hold | Swing | +2.2 |
Party | Candidate | Votes | % | ±% | |
---|---|---|---|---|---|
Liberal | Henry Pearce | 17,073 | 51.9 | −0.2 | |
Labor | Mick Gardner | 15,848 | 48.1 | +1.5 | |
Total formal votes | 32,921 | 99.0 | |||
Informal votes | 346 | 1.0 | |||
Turnout | 33,267 | 96.7 | |||
Liberal hold | Swing | −0.4 |
Party | Candidate | Votes | % | ±% | |
---|---|---|---|---|---|
Liberal | Reginald Swartz | unopposed | |||
Liberal hold | Swing |
Party | Candidate | Votes | % | ±% | |
---|---|---|---|---|---|
Country | Charles Davidson | 19,058 | 56.3 | −2.1 | |
Labor | George Hyde | 14,773 | 43.7 | +6.2 | |
Total formal votes | 33,831 | 98.4 | |||
Informal votes | 554 | 1.6 | |||
Turnout | 34,385 | 95.3 | |||
Country hold | Swing | -2.3 |
Party | Candidate | Votes | % | ±% | |
---|---|---|---|---|---|
Country | Charles Adermann | 29,417 | 72.9 | +6.4 | |
Labor | Geoffrey Arnell | 10,952 | 27.1 | +2.2 | |
Total formal votes | 40,369 | 98.6 | |||
Informal votes | 575 | 1.4 | |||
Turnout | 40,944 | 96.9 | |||
Country hold | Swing | +2.2 |
Party | Candidate | Votes | % | ±% | |
---|---|---|---|---|---|
Liberal | Doug Berry | 19,019 | 53.7 | +2.0 | |
Labor | William Thieme | 16,373 | 46.3 | +0.0 | |
Total formal votes | 35,392 | 97.6 | |||
Informal votes | 852 | 2.4 | |||
Turnout | 36,244 | 95.5 | |||
Liberal hold | Swing | +1.8 |
Party | Candidate | Votes | % | ±% | |
---|---|---|---|---|---|
Labor | Bill Edmonds | 19,445 | 54.1 | +4.7 | |
Country | Doug Jeffrey | 15,332 | 42.7 | −2.7 | |
Communist | Gloria Phelan | 1,160 | 3.2 | −2.0 | |
Total formal votes | 35,937 | 97.3 | |||
Informal votes | 991 | 2.7 | |||
Turnout | 36,928 | 93.7 | |||
Two-party-preferred result | |||||
Labor | Bill Edmonds | 57.0 | +3.3 | ||
Country | Doug Jeffrey | 43.0 | −3.3 | ||
Labor hold | Swing | +3.3 |
Party | Candidate | Votes | % | ±% | |
---|---|---|---|---|---|
Labor | Bill Riordan | 16,700 | 60.2 | +5.1 | |
Country | Ulick Browne | 11,038 | 39.8 | −1.7 | |
Total formal votes | 27,738 | 98.3 | |||
Informal votes | 494 | 1.7 | |||
Turnout | 28,232 | 90.5 | |||
Labor hold | Swing | +1.8 |
Party | Candidate | Votes | % | ±% | |
---|---|---|---|---|---|
Labor | Harry Bruce | 16,827 | 49.0 | +6.7 | |
Country | Tom Gilmore | 16,163 | 47.1 | −2.5 | |
Communist | Richard Anear | 1,329 | 3.9 | +0.4 | |
Total formal votes | 34,319 | 97.5 | |||
Informal votes | 867 | 2.5 | |||
Turnout | 35,186 | 92.8 | |||
Two-party-preferred result | |||||
Labor | Harry Bruce | 18,083 | 52.7 | +4.4 | |
Country | Tom Gilmore | 16,236 | 47.3 | −4.4 | |
Labor gain from Country | Swing | +4.4 |
Party | Candidate | Votes | % | ±% | |
---|---|---|---|---|---|
Liberal | Bruce Wight | 22,945 | 57.8 | −1.6 | |
Labor | Jim Hadley | 15,055 | 37.9 | −2.7 | |
Independent | Walter Collings | 1,681 | 4.2 | +4.2 | |
Total formal votes | 39,681 | 97.9 | |||
Informal votes | 865 | 2.1 | |||
Turnout | 40,546 | 95.2 | |||
Two-party-preferred result | |||||
Liberal | Bruce Wight | 58.9 | −0.5 | ||
Labor | Jim Hadley | 41.1 | +0.5 | ||
Liberal hold | Swing | -0.5 |
Party | Candidate | Votes | % | ±% | |
---|---|---|---|---|---|
Labor | Alfred Dohring | 11,989 | 37.7 | −2.7 | |
Country | Wilfred Brimblecombe | 10,316 | 32.4 | −27.2 | |
Independent | Charles Russell | 9,502 | 29.9 | +29.9 | |
Total formal votes | 31,807 | 98.5 | |||
Informal votes | 475 | 1.5 | |||
Turnout | 32,282 | 93.4 | |||
Two-party-preferred result | |||||
Country | Wilfred Brimblecombe | 18,071 | 56.8 | −2.8 | |
Labor | Alfred Dohring | 13,736 | 43.2 | +2.8 | |
Country hold | Swing | -2.8 |
Party | Candidate | Votes | % | ±% | |
---|---|---|---|---|---|
Country | Arthur Fadden | 24,899 | 74.9 | +0.7 | |
Independent | John Rosser | 8,338 | 25.1 | +25.1 | |
Total formal votes | 33,237 | 97.8 | |||
Informal votes | 747 | 2.2 | |||
Turnout | 33,984 | 96.4 | |||
Country hold | Swing | +0.7 |
Party | Candidate | Votes | % | ±% | |
---|---|---|---|---|---|
Liberal | Josiah Francis | 27,146 | 59.5 | −1.9 | |
Labor | Ted Mansfield | 17,661 | 38.7 | +2.3 | |
Communist | Bill Yarrow | 813 | 1.8 | −0.4 | |
Total formal votes | 45,620 | 98.0 | |||
Informal votes | 914 | 2.0 | |||
Turnout | 46,534 | 96.0 | |||
Two-party-preferred result | |||||
Liberal | Josiah Francis | 59.7 | −1.9 | ||
Labor | Ted Mansfield | 40.3 | +1.9 | ||
Liberal hold | Swing | -1.9 |
Party | Candidate | Votes | % | ±% | |
---|---|---|---|---|---|
Liberal | Donald Cameron | 21,219 | 58.2 | +16.1 | |
Labor | Andrew Crilly | 14,648 | 40.2 | −0.1 | |
Communist | Frank O'Connor | 602 | 1.7 | +0.1 | |
Total formal votes | 36,469 | 98.2 | |||
Informal votes | 656 | 1.8 | |||
Turnout | 37,125 | 97.5 | |||
Two-party-preferred result | |||||
Liberal | Donald Cameron | 58.4 | +1.6 | ||
Labor | Andrew Crilly | 41.6 | −1.6 | ||
Liberal hold | Swing | +1.6 |
Party | Candidate | Votes | % | ±% | |
---|---|---|---|---|---|
Liberal | Alan Hulme | 24,843 | 58.6 | −1.1 | |
Labor | Patrick Bredhauer | 17,533 | 41.4 | +4.8 | |
Total formal votes | 42,376 | 98.0 | |||
Informal votes | 849 | 2.0 | |||
Turnout | 43,225 | 95.9 | |||
Liberal hold | Swing | -3.0 |
Party | Candidate | Votes | % | ±% | |
---|---|---|---|---|---|
Liberal | Nigel Drury | 26,021 | 60.9 | +0.6 | |
Labor | Frank Luton | 16,733 | 39.1 | −0.6 | |
Total formal votes | 42,754 | 98.2 | |||
Informal votes | 783 | 1.2 | |||
Turnout | 43,537 | 93.6 | |||
Liberal hold | Swing | +0.6 |
Party | Candidate | Votes | % | ±% | |
---|---|---|---|---|---|
Country | Bernard Corser | 22,895 | 56.9 | +0.4 | |
Labor | Thomas Wallace | 17,337 | 43.1 | +15.1 | |
Total formal votes | 40,232 | 98.5 | |||
Informal votes | 594 | 1.5 | |||
Turnout | 40,826 | 97.1 | |||
Country hold | Swing | -7.4 |
| ||||||||||||||||||||||||||||
All 10 SA seats in the House of Representatives 5 seats needed for a majority | ||||||||||||||||||||||||||||
---|---|---|---|---|---|---|---|---|---|---|---|---|---|---|---|---|---|---|---|---|---|---|---|---|---|---|---|---|
|
Party | Candidate | Votes | % | ±% | |
---|---|---|---|---|---|
Labor | Cyril Chambers | 22,938 | 59.8 | +0.0 | |
Liberal | Thomas Phillips | 14,670 | 38.3 | +1.1 | |
Communist | Edward Robertson | 732 | 1.9 | +0.0 | |
Total formal votes | 38,340 | 97.3 | |||
Informal votes | 1,076 | 2.7 | |||
Turnout | 39,416 | 97.2 | |||
Two-party-preferred result | |||||
Labor | Cyril Chambers | 61.6 | −0.4 | ||
Liberal | Thomas Phillips | 38.4 | +0.4 | ||
Labor hold | Swing | −0.4 |
Party | Candidate | Votes | % | ±% | |
---|---|---|---|---|---|
Liberal | Alick Downer | 25,323 | 63.9 | +3.1 | |
Labor | John Edwards | 14,324 | 36.1 | +1.6 | |
Total formal votes | 39,647 | 97.9 | |||
Informal votes | 863 | 2.1 | |||
Turnout | 40,510 | 97.1 | |||
Liberal hold | Swing | +0.8 |
Party | Candidate | Votes | % | ±% | |
---|---|---|---|---|---|
Liberal | Archie Cameron | 25,256 | 61.4 | −3.1 | |
Labor | Jim Corcoran | 14,880 | 36.2 | +3.1 | |
Independent | Charles Lloyd | 528 | 1.3 | +1.3 | |
Independent | Frank Rieck | 481 | 1.2 | +1.2 | |
Total formal votes | 41,145 | 98.1 | |||
Informal votes | 794 | 1.9 | |||
Turnout | 41,939 | 97.5 | |||
Two-party-preferred result | |||||
Liberal | Archie Cameron | 62.7 | −3.1 | ||
Labor | Jim Corcoran | 37.3 | +3.1 | ||
Liberal hold | Swing | −3.1 |
Party | Candidate | Votes | % | ±% | |
---|---|---|---|---|---|
Liberal | John McLeay | 24,644 | 61.1 | −0.2 | |
Labor | Len Wright | 15,714 | 38.9 | +0.2 | |
Total formal votes | 40,358 | 98.1 | |||
Informal votes | 786 | 1.9 | |||
Turnout | 41,144 | 96.9 | |||
Liberal hold | Swing | −0.2 |
Party | Candidate | Votes | % | ±% | |
---|---|---|---|---|---|
Labor | Edgar Russell | 21,384 | 56.1 | +1.7 | |
Liberal | Edward Andrews | 16,749 | 43.9 | −1.7 | |
Total formal votes | 38,133 | 98.4 | |||
Informal votes | 616 | 1.6 | |||
Turnout | 38,749 | 96.3 | |||
Labor hold | Swing | +1.7 |
Party | Candidate | Votes | % | ±% | |
---|---|---|---|---|---|
Labor | Clyde Cameron | unopposed | |||
Labor hold | Swing |
Party | Candidate | Votes | % | ±% | |
---|---|---|---|---|---|
Labor | Pat Galvin | 24,834 | 50.6 | +2.2 | |
Liberal | Jim Handby | 23,614 | 48.1 | −0.3 | |
Communist | Eric Stead | 654 | 1.3 | +1.3 | |
Total formal votes | 49,102 | 98.1 | |||
Informal votes | 966 | 1.9 | |||
Turnout | 50,068 | 97.2 | |||
Two-party-preferred result | |||||
Labor | Pat Galvin | 51.8 | +3.4 | ||
Liberal | Jim Handby | 48.2 | −3.4 | ||
Labor gain from Liberal | Swing | +3.4 |
Party | Candidate | Votes | % | ±% | |
---|---|---|---|---|---|
Labor | Albert Thompson | 33,979 | 71.3 | −0.2 | |
Liberal | John Caskey | 12,342 | 25.9 | −0.6 | |
Communist | Alan Finger | 1,304 | 2.7 | +0.7 | |
Total formal votes | 47,625 | 97.7 | |||
Informal votes | 1,129 | 2.3 | |||
Turnout | 48,754 | 96.6 | |||
Two-party-preferred result | |||||
Labor | Albert Thompson | 73.8 | +0.5 | ||
Liberal | John Caskey | 26.2 | −0.5 | ||
Labor hold | Swing | +0.5 |
Party | Candidate | Votes | % | ±% | |
---|---|---|---|---|---|
Liberal | Keith Wilson | 22,599 | 52.4 | +1.6 | |
Labor | Leslie McMullin | 20,554 | 47.6 | +2.4 | |
Total formal votes | 43,153 | 97.7 | |||
Informal votes | 1,038 | 2.3 | |||
Turnout | 44,191 | 97.3 | |||
Liberal hold | Swing | -0.4 |
Party | Candidate | Votes | % | ±% | |
---|---|---|---|---|---|
Liberal | Philip McBride | 23,232 | 60.1 | −1.3 | |
Labor | Cyril Hasse | 15,437 | 39.9 | +1.3 | |
Total formal votes | 38,669 | 98.4 | |||
Informal votes | 642 | 1.6 | |||
Turnout | 39,311 | 97.7 | |||
Liberal hold | Swing | -1.3 |
| |||||||||||||||||||||||||||||||||||||
All 8 WA seats in the House of Representatives 4 seats needed for a majority | |||||||||||||||||||||||||||||||||||||
---|---|---|---|---|---|---|---|---|---|---|---|---|---|---|---|---|---|---|---|---|---|---|---|---|---|---|---|---|---|---|---|---|---|---|---|---|---|
|
Party | Candidate | Votes | % | ±% | |
---|---|---|---|---|---|
Country | Len Hamilton | 22,012 | 64.6 | +27.8 | |
Labor | Percy Munday | 12,057 | 35.4 | +5.1 | |
Total formal votes | 34,069 | 97.1 | |||
Informal votes | 1,018 | 2.9 | |||
Turnout | 35,087 | 96.0 | |||
Country hold | Swing | +11.1 |
Party | Candidate | Votes | % | ±% | |
---|---|---|---|---|---|
Liberal | Paul Hasluck | 25,998 | 64.7 | +3.5 | |
Labor | John Henshaw | 14,193 | 35.3 | −3.5 | |
Total formal votes | 40,191 | 97.9 | |||
Informal votes | 863 | 2.1 | |||
Turnout | 41,054 | 96.0 | |||
Liberal hold | Swing | +3.5 |
Party | Candidate | Votes | % | ±% | |
---|---|---|---|---|---|
Liberal | Gordon Freeth | 22,287 | 59.5 | +32.5 | |
Labor | Frederick O'Connor | 15,171 | 40.5 | −3.3 | |
Total formal votes | 37,458 | 97.7 | |||
Informal votes | 868 | 2.3 | |||
Turnout | 38,326 | 97.0 | |||
Liberal hold | Swing | +6.7 |
Party | Candidate | Votes | % | ±% | |
---|---|---|---|---|---|
Labor | Kim Beazley Sr. | 23,901 | 56.7 | +2.0 | |
Liberal | Len Seaton | 18,273 | 43.3 | −0.3 | |
Total formal votes | 42,174 | 97.8 | |||
Informal votes | 960 | 2.2 | |||
Turnout | 43,134 | 97.1 | |||
Labor hold | Swing | +0.5 |
Party | Candidate | Votes | % | ±% | |
---|---|---|---|---|---|
Labor | Herbert Johnson | unopposed | |||
Labor hold | Swing |
Party | Candidate | Votes | % | ±% | |
---|---|---|---|---|---|
Country | Hugh Leslie | 19,921 | 59.6 | +21.8 | |
Labor | Arthur Hunter | 13,492 | 40.4 | +2.4 | |
Total formal votes | 33,413 | 96.8 | |||
Informal votes | 1,099 | 3.2 | |||
Turnout | 34,512 | 95.2 | |||
Country hold | Swing | +0.6 |
Party | Candidate | Votes | % | ±% | |
---|---|---|---|---|---|
Liberal | Billy Snedden | 17,705 | 49.5 | +3.1 | |
Labor | Tom Burke | 17,501 | 49.0 | +1.2 | |
Communist | James Kelly | 532 | 1.5 | +0.2 | |
Total formal votes | 35,738 | 97.4 | |||
Informal votes | 965 | 2.6 | |||
Turnout | 36,703 | 94.6 | |||
Two-party-preferred result | |||||
Labor | Tom Burke | 17,926 | 50.2 | +0.1 | |
Liberal | Billy Snedden | 17,812 | 49.8 | −0.1 | |
Labor hold | Swing | +0.1 |
Party | Candidate | Votes | % | ±% | |
---|---|---|---|---|---|
Liberal | Bill Grayden | 24,336 | 53.0 | +0.6 | |
Labor | Harry Webb | 20,258 | 44.2 | −3.4 | |
Communist | Alex Jolly | 1,280 | 2.8 | +2.8 | |
Total formal votes | 45,874 | 97.5 | |||
Informal votes | 1,155 | 2.5 | |||
Turnout | 47,029 | 95.8 | |||
Two-party-preferred result | |||||
Liberal | Bill Grayden | 53.3 | +0.9 | ||
Labor | Harry Webb | 46.7 | −0.9 | ||
Liberal hold | Swing | +0.9 |
| |||||||||||||||||||||||||||||||||||||
All 5 Tasmanian seats in the House of Representatives 3 seats needed for a majority | |||||||||||||||||||||||||||||||||||||
---|---|---|---|---|---|---|---|---|---|---|---|---|---|---|---|---|---|---|---|---|---|---|---|---|---|---|---|---|---|---|---|---|---|---|---|---|---|
|
Party | Candidate | Votes | % | ±% | |
---|---|---|---|---|---|
Liberal | Bruce Kekwick | 16,469 | 53.4 | +2.8 | |
Labor | Colman O'Byrne | 14,346 | 46.6 | −2.8 | |
Total formal votes | 30,815 | 96.4 | |||
Informal votes | 1,137 | 3.6 | |||
Turnout | 31,952 | 96.8 | |||
Liberal hold | Swing | +2.8 |
Party | Candidate | Votes | % | ±% | |
---|---|---|---|---|---|
Liberal | Aubrey Luck | 14,819 | 49.7 | −6.9 | |
Labor | Max Poulter | 9,820 | 32.9 | +6.9 | |
Labor | Clem Foster | 5,171 | 17.3 | +17.3 | |
Total formal votes | 29,810 | 97.3 | |||
Informal votes | 822 | 2.7 | |||
Turnout | 30,632 | 97.3 | |||
Two-party-preferred result | |||||
Liberal | Aubrey Luck | 16,103 | 54.0 | −2.6 | |
Labor | Max Poulter | 13,707 | 46.0 | +2.6 | |
Liberal hold | Swing | -2.6 |
Party | Candidate | Votes | % | ±% | |
---|---|---|---|---|---|
Liberal | Athol Townley | 15,449 | 53.3 | −1.8 | |
Labor | Mervyn McNeair | 13,545 | 46.7 | +1.8 | |
Total formal votes | 28,994 | 96.7 | |||
Informal votes | 1,001 | 3.3 | |||
Turnout | 29,995 | 96.1 | |||
Liberal hold | Swing | -1.8 |
Party | Candidate | Votes | % | ±% | |
---|---|---|---|---|---|
Liberal | Bill Falkinder | 17,983 | 55.4 | −2.6 | |
Labor | Jack Frost | 14,460 | 44.6 | +2.6 | |
Total formal votes | 32,443 | 97.8 | |||
Informal votes | 934 | 2.8 | |||
Turnout | 33,377 | 97.0 | |||
Liberal hold | Swing | -2.6 |
Party | Candidate | Votes | % | ±% | |
---|---|---|---|---|---|
Labor | Gil Duthie | 16,746 | 53.1 | +0.5 | |
Liberal | Lionel Browning | 14,794 | 46.9 | −0.5 | |
Total formal votes | 31,540 | 96.7 | |||
Informal votes | 1,072 | 3.3 | |||
Turnout | 32,612 | 96.1 | |||
Labor hold | Swing | +0.5 |
| |||||||||||||||||||||||||||||||||||||
Division of Australian Capital Territory | |||||||||||||||||||||||||||||||||||||
---|---|---|---|---|---|---|---|---|---|---|---|---|---|---|---|---|---|---|---|---|---|---|---|---|---|---|---|---|---|---|---|---|---|---|---|---|---|
|
Party | Candidate | Votes | % | ±% | |
---|---|---|---|---|---|
Labor | Jim Fraser | 5,905 | 49.9 | +6.7 | |
Independent | Lewis Nott | 3,265 | 27.6 | −3.5 | |
Liberal | Clyde Greenwood | 2,287 | 19.3 | −3.2 | |
Independent | Jessie Ashton | 373 | 3.2 | −0.1 | |
Total formal votes | 11,830 | 99.4 | |||
Informal votes | 69 | 0.6 | |||
Turnout | 11,899 | 93.2 | |||
Two-party-preferred result | |||||
Labor | Jim Fraser | 52.9 | +6.7 | ||
Independent | Lewis Nott | 47.1 | −6.7 | ||
Labor gain from Independent | Swing | +6.7 |
| |||||||||||||||||||||||||||||||||||||
Division of Northern Territory | |||||||||||||||||||||||||||||||||||||
---|---|---|---|---|---|---|---|---|---|---|---|---|---|---|---|---|---|---|---|---|---|---|---|---|---|---|---|---|---|---|---|---|---|---|---|---|---|
|
Party | Candidate | Votes | % | ±% | |
---|---|---|---|---|---|
Labor | Jock Nelson | 3,213 | 64.1 | +19.8 | |
Country | Ralph Edwards | 1,085 | 21.6 | +21.6 | |
Independent | Jessie Litchfield | 717 | 14.3 | +14.3 | |
Total formal votes | 5,015 | 98.1 | |||
Informal votes | 95 | 1.9 | |||
Turnout | 5,110 | 78.4 | |||
Two-party-preferred result | |||||
Labor | Jock Nelson | 71.3 | +18.6 | ||
Country | Ralph Edwards | 28.7 | +28.7 | ||
Labor hold | Swing | +18.6 |
This is a list of electoral results for the Division of Cunningham in Australian federal elections from the division's creation in 1949 until the present.
This is a list of electoral results for the Division of Farrer in Australian federal elections from the electorate's creation in 1949 until the present.
This is a list of electoral results for the Division of Grayndler in Australian federal elections from the electorate's creation in 1949 until the present. Grayndler is currently held by Anthony Albanese, the Prime Minister of Australia and the leader of the Australian Labor Party.
This is a list of electoral results for the Division of Bowman in Australian federal elections from the division's creation in 1949 until the present.
This is a list of electoral results for the Division of Australian Capital Territory in Australian federal elections from the division's creation in 1949 until its abolition in 1974.
This is a list of electoral division results for the Australian 1954 federal election.
This is a list of electoral division results for the Australian 1946 federal election.
This is a list of electoral division results for the Australian 1949 federal election.
This is a list of electoral division results for the Australian 1955 federal election.
This is a list of electoral division results for the Australian 1958 federal election.
This is a list of electoral division results for the Australian 1961 federal election.
This is a list of electoral division results for the Australian 1966 federal election.
This is a list of electoral division results for the Australian 1969 federal election.
This is a list of electoral division results for the Australian 1972 federal election.
This is a list of electoral division results for the Australian 1974 federal election.
This is a list of electoral division results for the Australian 1975 federal election.
This is a list of electoral division results for the Australian 1977 federal election.
This is a list of electoral division results for the Australian 1980 federal election.
This is a list of electoral division results for the Australian 1983 federal election.
This is a list of electoral division results for the Australian 1984 federal election in the state of New South Wales.