Results of the 1949 Australian federal election (House of Representatives)

Last updated

This is a list of electoral division results for the Australian 1949 federal election. [1]

Contents

Overall

This section is an excerpt from 1949 Australian federal election § House of Representatives
.mw-parser-output .legend{page-break-inside:avoid;break-inside:avoid-column}.mw-parser-output .legend-color{display:inline-block;min-width:1.25em;height:1.25em;line-height:1.25;margin:1px 0;text-align:center;border:1px solid black;background-color:transparent;color:black}.mw-parser-output .legend-text{}
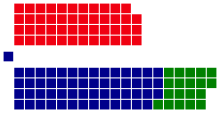
Labor: 47 seats
Liberal Party: 55 seats
Country: 19 seats Australian Federal Election, 1949.svg
  Labor: 47 seats
  Liberal Party: 55 seats
  Country: 19 seats
House of Reps (IRV) — 1949–51—Turnout 95.97% (CV) — Informal 1.99%
1949 Australian House.svg
PartyVotes %SwingSeatsChange
  Liberal–Country coalition 2,314,14350.26+6.6174+45
  Liberal  1,813,79439.39+6.4455+37
  Country  500,34910.87+0.1719+8
  Labor 2,117,08845.98–3.7348 [lower-alpha 1] +4
  Communist 40,9410.89–0.6000
  Lang Labor 32,8700.71–0.880–1
  Independents 99,3682.16+0.341 [lower-alpha 2] –1
 Total4,604,410  123+48
Two-party-preferred (estimated)
  Liberal–Country coalition Win51.00+5.1074+45
  Labor 49.00−5.1047+4

New South Wales

1949 Australian federal election (New South Wales)
Flag of New South Wales.svg
  1946 10 December 1949 1951  

All 47 NSW seats in the House of Representatives
24 seats needed for a majority
 First partySecond partyThird party
  Robert Menzies headshot (cropped).jpg Benchifley.jpg Jack Lang 1928 (cropped).jpg
Leader Robert Menzies Ben Chifley Jack Lang
Party Coalition Labor Lang Labor
Seats before8191
Seats won24230
Seat changeIncrease2.svg 16Increase2.svg 4Decrease2.svg 1
Popular vote871,675832,15332,870
Percentage48.4%46.4%1.8%
SwingIncrease2.svg 7.7ppDecrease2.svg 5.0ppDecrease2.svg 2.2pp
TPP 49.2%50.8%

Banks

This section is an excerpt from Electoral results for the Division of Banks § 1949
1949 Australian federal election: Banks [2]
PartyCandidateVotes%±%
Labor Eric Costa 24,53758.3−3.8
Liberal Howard Fletcher15,37136.5+7.6
Lang Labor Francis Foy2,2025.2+5.2
Total formal votes42,11098.8
Informal votes9412.2
Turnout 43,05195.5
Two-party-preferred result
Labor Eric Costa 62.2−4.1
Liberal Howard Fletcher37.8+4.1
Labor notional  hold Swing −4.1

Barton

This section is an excerpt from Electoral results for the Division of Barton § 1949
1949 Australian federal election: Barton
PartyCandidateVotes%±%
Labor Herbert Evatt 21,68153.2−13.0
Liberal Nancy Wake 19,03746.8+13.0
Total formal votes40,71898.4
Informal votes6531.6
Turnout 41,37198.0
Labor hold Swing −13.0

Bennelong

This section is an excerpt from Electoral results for the Division of Bennelong § 1949
1949 Australian federal election: Bennelong [2]
PartyCandidateVotes%±%
Liberal John Cramer 23,56859.6+8.2
Labor Raymond Watt15,95240.4−8.2
Total formal votes39,52097.9
Informal votes8492.1
Turnout 40,36996.5
Liberal notional  hold Swing +8.2

Blaxland

This section is an excerpt from Electoral results for the Division of Blaxland § 1949
1949 Australian federal election: Blaxland [2]
PartyCandidateVotes%±%
Labor Jim Harrison 19,40349.3+21.7
Lang Labor Jack Lang 9,75224.8−15.0
Liberal Thomas Handran-Smith9,36423.8−7.7
Communist Roy Kirby8652.2+2.2
Total formal votes39,38498.0
Informal votes8022.0
Turnout 40,18696.1
Two-party-preferred result
Labor Jim Harrison 53.4+53.4
Lang Labor Jack Lang 46.6−13.9
Labor notional  gain from Lang Labor Swing +53.4

Bradfield

This section is an excerpt from Electoral results for the Division of Bradfield § 1949
1949 Australian federal election: Bradfield [2]
PartyCandidateVotes%±%
Liberal Billy Hughes 28,42871.4−3.8
Labor Ken Gee 8,64521.7−3.0
Independent Edward Price2,7646.9+6.9
Total formal votes39,83798.2
Informal votes7221.8
Turnout 40,55995.8
Two-party-preferred result
Liberal Billy Hughes 74.9−0.3
Labor Ken Gee 25.1+0.3
Liberal notional  hold Swing −0.3

Calare

This section is an excerpt from Electoral results for the Division of Calare § 1949
1949 Australian federal election: Calare
PartyCandidateVotes%±%
Liberal John Howse 21,39957.0+25.1
Labor George Gibbons 16,13943.0−5.3
Total formal votes37,53898.8
Informal votes4721.2
Turnout 38,01097.3
Liberal hold Swing +6.4

Cook

This section is an excerpt from Electoral results for the Division of Cook (1906–1955) § 1949
1949 Australian federal election: Cook
PartyCandidateVotes%±%
Labor Tom Sheehan 27,48575.0+2.7
Liberal Gerald Davis5,97016.3+3.9
Lang Labor John Eldridge1,9205.2−9.5
Communist Mervyn Pidcock1,2763.5−2.9
Total formal votes36,65196.9
Informal votes1,1743.1
Turnout 37,82595.9
Two-party-preferred result
Labor Tom Sheehan 82.1+8.7
Liberal Gerald Davis17.9+17.9
Labor hold Swing +8.7

Cowper

This section is an excerpt from Electoral results for the Division of Cowper § 1949
1949 Australian federal election: Cowper
PartyCandidateVotes%±%
Country Sir Earle Page 22,79161.7+0.9
Labor Louis Jabour14,13438.3+3.0
Total formal votes36,92598.9
Informal votes4041.1
Turnout 47,32996.9
Country hold Swing −1.0

Cunningham

This section is an excerpt from Electoral results for the Division of Cunningham § 1949
1949 Australian federal election: Cunningham [2]
PartyCandidateVotes%±%
Labor Billy Davies 22,79560.7+3.0
Liberal Alan Thomson11,89231.7+0.8
Communist Eric Aarons 2,8547.6−4.7
Total formal votes37,54197.3
Informal votes1,0472.7
Turnout 38,58895.7
Two-party-preferred result
Labor Billy Davies 68.2+0.4
Liberal Alan Thomson31.8−0.4
Labor notional  hold Swing +0.4

Dalley

This section is an excerpt from Electoral results for the Division of Dalley § 1949
1949 Australian federal election: Dalley
PartyCandidateVotes%±%
Labor Sol Rosevear 27,50173.0+9.6
Liberal Charles Shields10,19027.0−2.9
Total formal votes37,69197.1
Informal votes1,1112.9
Turnout 38,80296.6
Labor hold Swing +3.3

Darling

This section is an excerpt from Electoral results for the Division of Darling § 1949
1949 Australian federal election: Darling
PartyCandidateVotes%±%
Labor Joe Clark 20,84363.8−2.7
Country Elson Whyte10,34831.7+9.7
Communist Cecil Connors1,0173.1+3.1
Independent Madge Roberts4501.4+1.4
Total formal votes32,65897.2
Informal votes9292.8
Turnout 33,58794.7
Two-party-preferred result
Labor Joe Clark 67.3−3.0
Country Elson Whyte32.7+3.0
Labor hold Swing −3.0

East Sydney

This section is an excerpt from Electoral results for the Division of East Sydney § 1949
1949 Australian federal election: East Sydney
PartyCandidateVotes%±%
Labor Eddie Ward 22,49657.0-4.8
Liberal John Mant 15,39839.0+5.9
Independent William Dalton1,5523.9+3.9
Total formal votes39,44697.5
Informal votes1,0152.5
Turnout 40,46195.5
Two-party-preferred result
Labor Eddie Ward 58.0-6.3
Liberal John Mant 42.0+6.3
Labor hold Swing -6.3

Eden-Monaro

This section is an excerpt from Electoral results for the Division of Eden-Monaro § 1949
1949 Australian federal election: Eden-Monaro
PartyCandidateVotes%±%
Labor Allan Fraser 19,00450.9-5.4
Liberal Denzil Macarthur-Onslow 18,31749.1+15.0
Total formal votes37,32198.6
Informal votes5171.4
Turnout 37,83896.6
Labor hold Swing -6.6

Evans

This section is an excerpt from Electoral results for the Division of Evans § 1949
1949 Australian federal election: Evans [2]
PartyCandidateVotes%±%
Liberal Frederick Osborne 21,61656.6+5.6
Labor Ronald Nicholls16,58843.4-5.6
Total formal votes38,20498.1
Informal votes7341.9
Turnout 38,93896.8
Liberal notional  hold Swing +5.6

Farrer

This section is an excerpt from Electoral results for the Division of Farrer § 1949
1949 Australian federal election: Farrer [2]
PartyCandidateVotes%±%
Labor Thomas McGrath14,85339.3-7.0
Liberal David Fairbairn 14,42538.2+20.4
Country John Mackay8,09921.4-14.1
Communist Bill Gollan4191.1+1.1
Total formal votes37,79698.3
Informal votes6651.7
Turnout 38,46197.0
Two-party-preferred result
Liberal David Fairbairn 22,22258.8N/A
Labor Thomas McGrath15,57441.2N/A
Liberal notional  gain from Country Swing N/A

Grayndler

This section is an excerpt from Electoral results for the Division of Grayndler § 1949
1949 Australian federal election: Grayndler [2]
PartyCandidateVotes%±%
Labor Fred Daly 25,62267.1+5.2
Liberal Donald Clark11,29929.6+11.5
Communist Henry McPhillips9202.4-1.8
Republican William McCristal 3490.9+0.9
Total formal votes38,19097.3
Informal votes1,0572.7
Turnout 39,24796.4
Two-party-preferred result
Labor Fred Daly 69.7-6.9
Liberal Donald Clark30.3+6.9
Labor notional  hold Swing -6.9

Gwydir

This section is an excerpt from Electoral results for the Division of Gwydir § 1949
1949 Australian federal election: Gwydir
PartyCandidateVotes%±%
Country Thomas Treloar 20,01855.1+17.4
Labor William Scully 16,28244.9-3.5
Total formal votes36,30099.1
Informal votes3460.9
Turnout 36,64695.8
Country gain from Labor Swing +9.2

Hume

This section is an excerpt from Electoral results for the Division of Hume § 1949
1949 Australian federal election: Hume
PartyCandidateVotes%±%
Country Charles Anderson 18,87151.0+18.8
Labor Arthur Fuller 18,10449.0−4.2
Total formal votes36,97598.9
Informal votes4281.1
Turnout 37,40396.3
Country gain from Labor Swing +5.9

Hunter

This section is an excerpt from Electoral results for the Division of Hunter § 1949
1949 Australian federal election: Hunter
PartyCandidateVotes%±%
Labor Rowley James 26,70468.6-14.4
Liberal Ted Fletcher8,50221.8+10.4
Communist Evan Phillips3,7299.6+9.6
Total formal votes38,93597.6
Informal votes9642.4
Turnout 39,89997.2
Two-party-preferred result
Labor Rowley James 77.3-9.7
Liberal Ted Fletcher32.7+9.7
Labor hold Swing -9.7

Kingsford Smith

This section is an excerpt from Electoral results for the Division of Kingsford Smith § 1949
1949 Australian federal election: Kingsford-Smith [2]
PartyCandidateVotes%±%
Labor Gordon Anderson 18,57349.7-4.3
Liberal Charles de Monchaux17,38746.5+9.5
Independent Henry Crittenden1,2063.2+3.2
Independent Clare Peters2210.6+0.6
Total formal votes37,38797.7
Informal votes8832.3
Turnout 38,27096.5
Two-party-preferred result
Labor Gordon Anderson 19,04250.9-7.6
Liberal Charles de Monchaux18,34549.1+7.6
Labor notional  hold Swing -7.6

Lang

This section is an excerpt from Electoral results for the Division of Lang § 1949
1949 Australian federal election: Lang
PartyCandidateVotes%±%
Labor Dan Mulcahy 20,42150.2+0.3
Liberal Eric Willis 18,36945.1+9.1
Communist Roy Boyd1,9054.7-2.8
Total formal votes40,69598.0
Informal votes8272.0
Turnout 41,52297.9
Two-party-preferred result
Labor Dan Mulcahy 54.7-6.4
Liberal Eric Willis 45.3+6.4
Labor hold Swing -6.4

Lawson

This section is an excerpt from Electoral results for the Division of Lawson § 1949
1949 Australian federal election: Lawson [2]
PartyCandidateVotes%±%
Labor Alan Manning15,96943.0-3.9
Country Laurie Failes 11,53131.0-4.3
Liberal Elwyn Croft9,24924.9+18.6
Independent William Ferguson 3921.1+1.1
Total formal votes37,14198.7
Informal votes4761.3
Turnout 37,61796.6
Two-party-preferred result
Country Laurie Failes 20,77355.8+7.6
Labor Alan Manning16,40844.2-7.6
Country notional  gain from Labor Swing +7.6

Lowe

This section is an excerpt from Electoral results for the Division of Lowe § 1949
1949 Australian federal election: Lowe [2]
PartyCandidateVotes%±%
Liberal William McMahon 20,48952.7+3.8
Labor Hector McDonald15,90840.9-8.0
Independent Liberal Edith Shortland2,4706.4+6.4
Total formal votes38,86798.0
Informal votes7862.0
Turnout 39,65397.5
Two-party-preferred result
Liberal William McMahon 58.5+9.0
Labor Hector McDonald41.5-9.0
Liberal notional  gain from Labor Swing +9.0

Lyne

This section is an excerpt from Electoral results for the Division of Lyne § 1949
1949 Australian federal election: Lyne [2]
PartyCandidateVotes%±%
Country Jim Eggins 10,21227.7+9.3
Labor Edward Hayes10,16027.6−8.8
Country Philip Lucock 6,98419.0+19.0
Country Eric Mackay6,11116.6+16.6
Country Francis Hain2,2966.2+6.2
Independent Joe Cordner1,0572.9+2.9
Total formal votes36,82096.8
Informal votes1,2353.2
Turnout 38,05597.0
Two-party-preferred result
Country Jim Eggins 24,30866.0+4.1
Labor Edward Hayes12,51234.0−4.1
Country notional  hold Swing +4.1

Macarthur

This section is an excerpt from Electoral results for the Division of Macarthur § 1949
1949 Australian federal election: Macarthur [2]
PartyCandidateVotes%±%
Liberal Jeff Bate 25,18464.6+16.6
Labor William McDonnell13,77635.4-9.1
Total formal votes38,96098.3
Informal votes6891.7
Turnout 39,64995.9
Liberal notional  hold Swing +12.2

Mackellar

This section is an excerpt from Electoral results for the Division of Mackellar § 1949
1949 Australian federal election: Mackellar [2]
PartyCandidateVotes%±%
Liberal Bill Wentworth 25,67862.6+7.2
Labor James Mitchell15,31437.4-7.2
Total formal votes40,99297.5
Informal votes1,0682.5
Turnout 42,06096.2
Liberal notional  hold Swing +7.2

Macquarie

This section is an excerpt from Electoral results for the Division of Macquarie § 1949
1949 Australian federal election: Macquarie
PartyCandidateVotes%±%
Labor Ben Chifley 21,68357.7-5.1
Liberal Bob Cotton 14,58538.8+13.3
Communist John King1,3203.5+3.5
Total formal votes37,58898.8
Informal votes4411.2
Turnout 38,02997.6
Two-party-preferred result
Labor Ben Chifley 61.0-4.4
Liberal Bob Cotton 39.0+4.4
Labor hold Swing -4.4

Martin

This section is an excerpt from Electoral results for the Division of Martin § 1949
1949 Australian federal election: Martin
PartyCandidateVotes%±%
Labor William O'Connor 20,60353.5-1.9
Liberal Frederick Mann14,55037.8+8.2
Communist Tom Dowling1,8474.8+0.6
Lang Labor Frank Moss8082.1-3.8
Independent Malinda Ivey6811.8+1.8
Total formal votes38,48997.3
Informal votes1,0572.7
Turnout 39,54697.3
Two-party-preferred result
Labor William O'Connor 59.6-6.1
Liberal Frederick Mann40.4+6.1
Labor hold Swing -6.1

Mitchell

This section is an excerpt from Electoral results for the Division of Mitchell § 1949
1949 Australian federal election: Mitchell [2]
PartyCandidateVotes%±%
Liberal Roy Wheeler 23,27456.9+17.0
Labor Joseph White17,64343.1-8.7
Total formal votes40,91797.7
Informal votes9632.3
Turnout 41,88096.4
Liberal notional  gain from Labor Swing +12.8

New England

This section is an excerpt from Electoral results for the Division of New England § 1949
1949 Australian federal election: New England
PartyCandidateVotes%±%
Country David Drummond 16,15944.3-16.0
Labor William Wilson13,51537.0-4.7
Country Donald Shand 6,83018.7+18.7
Total formal votes36,50498.8
Informal votes4271.2
Turnout 36,93196.2
Two-party-preferred result
Country David Drummond 22,41761.4+2.9
Labor William Wilson14,08738.6-2.9
Country hold Swing +2.9

Newcastle

This section is an excerpt from Electoral results for the Division of Newcastle § 1949
1949 Australian federal election: Newcastle [2]
PartyCandidateVotes%±%
Labor David Watkins 21,70555.7-1.4
Liberal Harry Quinlan15,52939.9+14.6
Communist Laurie Aarons 1,2573.2-3.7
Independent Grahame Bland4451.1-1.2
Total formal votes38,93698.2
Informal votes7111.8
Turnout 39,64797.8
Two-party-preferred result
Labor David Watkins 58.3-10.8
Liberal Harry Quinlan41.7+10.8
Labor hold Swing -10.8

North Sydney

This section is an excerpt from Electoral results for the Division of North Sydney § 1949
1949 Australian federal election: North Sydney
PartyCandidateVotes%±%
Liberal William Jack 19,65050.9+3.3
Labor Leo Haylen16,09441.7-10.7
Independent Patrick Williams1,6424.3+4.3
Lang Labor Norman Ferguson1,6423.1+3.1
Total formal votes38,59197.9
Informal votes8312.1
Turnout 39,42297.6
Two-party-preferred result
Liberal William Jack 53.3+5.7
Labor Leo Haylen46.7-5.7
Liberal gain from Labor Swing +5.7

Parkes

This section is an excerpt from Electoral results for the Division of Parkes (1901–1969) § 1949
1949 Australian federal election: Parkes
PartyCandidateVotes%±%
Labor Les Haylen 19,96651.8-8.2
Liberal Dick Dein 18,57948.2+8.5
Total formal votes38,54597.9
Informal votes8262.1
Turnout 39,37197.0
Labor hold Swing -7.8

Parramatta

This section is an excerpt from Electoral results for the Division of Parramatta § 1949
1949 Australian federal election: Parramatta [2]
PartyCandidateVotes%±%
Liberal Howard Beale 25,41162.6+7.2
Labor Clement Jackson15,21137.4-7.2
Total formal votes40,62298.2
Informal votes7561.8
Turnout 41,37896.7
Liberal hold Swing +7.2

Paterson

This section is an excerpt from Electoral results for the Division of Paterson § 1949
1949 Australian federal election: Paterson [2]
PartyCandidateVotes%±%
Labor Cecil Robinson14,08937.9-7.8
Liberal Allen Fairhall 11,18930.1+12.2
Country Arsie Dorsman5,29314.2+0.6
Country John McGirr3,84210.3+10.3
Country Robert Clendinning2,1015.7+5.7
Country Ernest Slater6561.8+1.8
Total formal votes37,17096.7
Informal votes1,2673.3
Turnout 38,43797.4
Two-party-preferred result
Liberal Allen Fairhall 21,74158.5+58.5
Labor Cecil Robinson15,42941.5-8.6
Liberal notional  gain from Labor Swing +8.6

Phillip

This section is an excerpt from Electoral results for the Division of Phillip § 1949
1949 Australian federal election: Phillip [2]
PartyCandidateVotes%±%
Labor Joe Fitzgerald 19,45551.2-7.8
Liberal William Latimer16,30242.9+3.4
Independent Jessie Street 2,2726.0+6.0
Total formal votes38,02998.0
Informal votes7622.0
Turnout 38,79196.3
Two-party-preferred result
Labor Joe Fitzgerald 55.7-4.0
Liberal William Latimer44.3+4.0
Labor notional  hold Swing -4.0

Reid

This section is an excerpt from Electoral results for the Division of Reid § 1949
1949 Australian federal election: Reid
PartyCandidateVotes%±%
Labor Charles Morgan 24,60758.1+9.8
Liberal Jim Clough 12,30429.0+6.6
Lang Labor Rupert Sheldon5,46712.9-13.4
Total formal votes42,37897.8
Informal votes9422.2
Turnout 43.32096.4
Two-party-preferred result
Labor Charles Morgan 67.8
Liberal Jim Clough 32.2
Labor hold Swing

Richmond

This section is an excerpt from Electoral results for the Division of Richmond § 1949
1949 Australian federal election: Richmond
PartyCandidateVotes%±%
Country Larry Anthony 27,50475.1+6.0
Labor Alexander Bryen9,13924.9-6.0
Total formal votes36,64398.8
Informal votes4411.2
Turnout 37,08496.2
Country hold Swing +6.0

Riverina

This section is an excerpt from Electoral results for the Division of Riverina § 1949
1949 Australian federal election: Riverina
PartyCandidateVotes%±%
Country Hugh Roberton 19,90453.3+18.0
Labor Joe Langtry 16,88045.2-0.5
Communist William Mitchell5601.5+1.5
Total formal votes37,34498.8
Informal votes4581.2
Turnout 37,80296.0
Two-party-preferred result
Country Hugh Roberton 53.5+3.8
Labor Joe Langtry 46.5-3.8
Country gain from Labor Swing +3.8

Robertson

This section is an excerpt from Electoral results for the Division of Robertson § 1949
1949 Australian federal election: Robertson
PartyCandidateVotes%±%
Liberal Roger Dean 21,61754.2+16.2
Labor Thomas Williams 18,23645.8-6.9
Total formal votes39,85397.9
Informal votes8582.1
Turnout 40,71196.4
Liberal gain from Labor Swing +11.5

Shortland

This section is an excerpt from Electoral results for the Division of Shortland § 1949
1949 Australian federal election: Shortland [2]
PartyCandidateVotes%±%
Labor Charles Griffiths 21,92154.4-12.8
Liberal Harold Daisley10,51326.1+7.1
Independent Alfred Boa6,42315.9+15.9
Communist Eugene Marshall8822.2+2.2
Independent Isabel Longworth 5701.4+1.4
Total formal votes40,30997.6
Informal votes9962.4
Turnout 41,30597.3
Two-party-preferred result
Labor Charles Griffiths 64.1-12.0
Liberal Harold Daisley35.9+12.0
Labor notional  hold Swing -12.0

St George

This section is an excerpt from Electoral results for the Division of St George § 1949
1949 Australian federal election: St George [2]
PartyCandidateVotes%±%
Liberal Bill Graham 19,98752.0+17.2
Labor Joseph Nicholson18,47548.0-12.1
Total formal votes38,46297.8
Informal votes8472.2
Turnout 39,30997.3
Liberal notional  gain from Labor Swing +16.2

Warringah

This section is an excerpt from Electoral results for the Division of Warringah § 1949
1949 Australian federal election: Warringah
PartyCandidateVotes%±%
Liberal Percy Spender 27,56370.1+1.6
Independent Labor Bill Fisher 8,35621.3+21.3
Independent Labor Norman Chadwick3,3158.4+8.4
Total formal votes39,23498.4
Informal votes6321.6
Turnout 39,86695.8
Two-party-preferred result
Liberal Percy Spender 71.1+2.4
Independent Labor Bill Fisher 28.9+28.9
Liberal hold Swing +2.4

Watson

This section is an excerpt from Electoral results for the Division of Watson (1934–1969) § 1949
1949 Australian federal election: Watson
PartyCandidateVotes%±%
Labor Dan Curtin 19,51549.4-5.9
Liberal Stanley Card15,14738.3+12.5
Independent Labor Max Falstein 3,6569.2+9.2
Lang Labor Harold O'Reilly1,2103.1-3.1
Total formal votes39,52897.3
Informal votes1,0792.7
Turnout 40,60796.5
Two-party-preferred result
Labor Dan Curtin 59.0-3.5
Liberal Stanley Card41.0+3.5
Labor hold Swing -3.5

Wentworth

This section is an excerpt from Electoral results for the Division of Wentworth § 1949
1949 Australian federal election: Wentworth
PartyCandidateVotes%±%
Liberal Eric Harrison 28,82175.1+7.9
Labor William McKell9,53324.9-5.5
Total formal votes38,35498.2
Informal votes7031.8
Turnout 39,05796.1
Liberal hold Swing +6.8

Werriwa

This section is an excerpt from Electoral results for the Division of Werriwa § 1949
1949 Australian federal election: Werriwa
PartyCandidateVotes%±%
Labor Bert Lazzarini 24,14256.2+1.6
Liberal Ray Watson 18,78743.8+6.5
Total formal votes42,92997.8
Informal votes9612.2
Turnout 43,89095.2
Labor hold Swing −6.0

West Sydney

This section is an excerpt from Electoral results for the Division of West Sydney § 1949
1949 Australian federal election: West Sydney
PartyCandidateVotes%±%
Labor Dan Minogue 17,73249.8-18.2
Lang Labor Horace Foley 8,87224.9+16.6
Liberal Basil Mottershead7,23520.3+1.2
Communist Stan Moran1,7865.0+0.4
Total formal votes35,62596.8
Informal votes1,1683.2
Turnout 36,79391.3
Two-party-preferred result
Labor Dan Minogue 55.7-21.7
Lang Labor Horace Foley 44.3+21.7
Labor hold Swing -21.7

Victoria

1949 Australian federal election (Victoria)
Flag of Victoria (Australia).svg
  1946 10 December 1949 1951  

All 33 Victorian seats in the House of Representatives
17 seats needed for a majority
 First partySecond party
  Robert Menzies headshot (cropped).jpg Benchifley.jpg
Leader Robert Menzies Ben Chifley
Party Coalition Labor
Seats before118
Seats won2013
Seat changeIncrease2.svg 9Increase2.svg 5
Popular vote641,404592,000
Percentage49.3%46.7%
SwingIncrease2.svg 2.3ppDecrease2.svg 1.2pp
TPP 50.3%49.7%

Balaclava

This section is an excerpt from Electoral results for the Division of Balaclava § 1949
1949 Australian federal election: Balaclava
PartyCandidateVotes%±%
Liberal Thomas White 26,15763.9+4.8
Labor Martin Dunne14,79636.1−4.8
Total formal votes40,95398.8
Informal votes5121.2
Turnout 41,46596.3
Liberal hold Swing +4.8

Ballaarat

This section is an excerpt from Electoral results for the Division of Ballarat § 1949
1949 Australian federal election: Ballaarat
PartyCandidateVotes%±%
Liberal Alan Pittard 19,85150.4+3.1
Labor Raymond Hyatt 19,52249.6−3.1
Total formal votes39,37399.0
Informal votes3801.0
Turnout 39,75397.3
Liberal gain from Labor Swing +3.1

Batman

This section is an excerpt from Electoral results for the Division of Batman § 1949
1949 Australian federal election: Batman
PartyCandidateVotes%±%
Labor Alan Bird 22,66258.4+4.3
Liberal Neil McKay16,13941.6+3.3
Total formal votes38,80198.6
Informal votes5441.4
Turnout 39,34595.9
Labor hold Swing −1.1

Bendigo

This section is an excerpt from Electoral results for the Division of Bendigo § 1949
1949 Australian federal election: Bendigo
PartyCandidateVotes%±%
Liberal Thomas Grigg 19,26847.7+24.2
Labor Percy Clarey 18,96247.0−5.0
Independent Allan Goodman2,1345.3+5.3
Total formal votes40,36498.6
Informal votes5541.4
Turnout 40,91896.5
Two-party-preferred result
Labor Percy Clarey 20,25850.2−4.1
Liberal Thomas Grigg 20,10649.8+4.1
Labor gain from Country Swing 14.1

Burke

This section is an excerpt from Electoral results for the Division of Burke (1949–1955) § 1949
1949 Australian federal election: Burke [3]
PartyCandidateVotes%±%
Labor Ted Peters 24,36262.1+11.1
Liberal Alfred Wall9,86525.2+2.4
Independent Henry Hodges4,72012.0+12.0
Independent James Whitworth2710.7+0.7
Total formal votes39,21897.5
Informal votes9992.5
Turnout 40,21795.8
Two-party-preferred result
Labor Ted Peters 69.4−0.7
Liberal Alfred Wall30.6+0.7
Labor notional  hold Swing −0.7

Chisholm

This section is an excerpt from Electoral results for the Division of Chisholm § 1949
1949 Australian federal election: Chisholm
PartyCandidateVotes%±%
Liberal Wilfrid Kent Hughes 26,62864.7+4.1
Labor Leo Fennessy 13,61533.1+0.1
Communist Bill Tregear9372.3+2.3
Total formal votes41,18098.5
Informal votes6481.5
Turnout 41,82896.7
Two-party-preferred result
Liberal Wilfrid Kent Hughes 64.9+3.8
Labor Leo Fennessy 35.1−3.8
Liberal notional  hold Swing +3.8

Corangamite

This section is an excerpt from Electoral results for the Division of Corangamite § 1949
1949 Australian federal election: Corangamite
PartyCandidateVotes%±%
Liberal Allan McDonald 21,67057.5+1.1
Labor Henry Stacpoole14,93639.6−3.9
Independent Elsie Brushfield1,0802.9+2.9
Total formal votes37,68699.2
Informal votes2860.8
Turnout 37,97297.0
Two-party-preferred result
Liberal Allan McDonald 60.0+3.6
Labor Henry Stacpoole40.0−3.6
Liberal hold Swing +3.6

Corio

This section is an excerpt from Electoral results for the Division of Corio § 1949
1949 Australian federal election: Corio [3]
PartyCandidateVotes%±%
Liberal Hubert Opperman 20,01850.3+7.4
Labor John Dedman 19,78349.7−6.2
Total formal votes39,80199.2
Informal votes3160.8
Turnout 40,11796.2
Liberal gain from Labor Swing +6.7

Darebin

This section is an excerpt from Electoral results for the Division of Darebin § 1949
1949 Australian federal election: Darebin
PartyCandidateVotes%±%
Labor Tom Andrews 24,71962.7+4.1
Liberal Jack McColl14,68837.3+5.9
Total formal votes39,40798.4
Informal votes6551.6
Turnout 40,06297.1
Labor notional  hold Swing −2.7

Deakin

This section is an excerpt from Electoral results for the Division of Deakin § 1949
1949 Australian federal election: Deakin
PartyCandidateVotes%±%
Liberal Frank Davis 23,51755.6+0.5
Labor Rod Leeson18,78444.4-0.5
Total formal votes42,30198.7
Informal votes5751.3
Turnout 42,87694.7
Liberal hold Swing +0.5

Fawkner

This section is an excerpt from Electoral results for the Division of Fawkner § 1949
1949 Australian federal election: Fawkner
PartyCandidateVotes%±%
Labor Bill Bourke 20,22850.0+2.3
Liberal Magnus Cormack 20,20150.0+1.8
Total formal votes40,42998.1
Informal votes7821.9
Turnout 41,21195.2
Labor hold Swing -0.8

Flinders

This section is an excerpt from Electoral results for the Division of Flinders § 1949
1949 Australian federal election: Flinders
PartyCandidateVotes%±%
Liberal Rupert Ryan 21,09654.8+3.3
Labor Robert Wilson11,41029.6-18.9
Independent Labor Andrew Hughes 6,01815.6+15.6
Total formal votes38,52498.7
Informal votes4901.3
Turnout 39,01494.3
Two-party-preferred result
Liberal Rupert Ryan 63.6+12.1
Labor Robert Wilson36.4-12.1
Liberal hold Swing +12.1

Gellibrand

This section is an excerpt from Electoral results for the Division of Gellibrand § 1949
1949 Australian federal election: Gellibrand
PartyCandidateVotes%±%
Labor John Mullens 20,51951.3−22.5
Liberal William Massey8,90422.2−4.0
Independent Labor Angus Macdonald6,32315.8+15.8
Independent William Anderson2,8657.2+7.2
Communist John Arrowsmith1,4183.5+3.5
Total formal votes40,02997.5
Informal votes1,0112.5
Turnout 41,04097.1
Two-party-preferred result
Labor John Mullens 69.7−4.1
Liberal William Massey30.3+4.1
Labor notional  hold Swing −4.1

Gippsland

This section is an excerpt from Electoral results for the Division of Gippsland § 1949
1949 Australian federal election: Gippsland
PartyCandidateVotes%±%
Country George Bowden 22,82466.7+6.6
Labor Horace Hawkins11,37333.3-2.4
Total formal votes34,19798.6
Informal votes4721.4
Turnout 34,66996.2
Country hold Swing +4.6

Henty

This section is an excerpt from Electoral results for the Division of Henty § 1949
1949 Australian federal election: Henty
PartyCandidateVotes%±%
Liberal Jo Gullett 22,65055.2+4.1
Labor Val Doube 17,54842.7-6.2
Lang Labor Charles Dicker8582.1+2.1
Total formal votes41,05698.8
Informal votes5101.2
Turnout 41,56696.7
Two-party-preferred result
Liberal Jo Gullett 55.4+4.3
Labor Val Doube 44.6-4.3
Liberal hold Swing +4.3

Higgins

This section is an excerpt from Electoral results for the Division of Higgins § 1949
1949 Australian federal election: Higgins
PartyCandidateVotes%±%
Liberal Harold Holt 26,01866.8+6.8
Labor Jules Meltzer12,90933.2−3.7
Total formal votes38,92798.4
Informal votes6211.6
Turnout 39,54894.7
Liberal notional  hold Swing +5.4

Higinbotham

This section is an excerpt from Electoral results for the Division of Higinbotham § 1949
1949 Australian federal election: Higinbotham [3]
PartyCandidateVotes%±%
Liberal Frank Timson 22,83253.6+1.2
Labor Frank Field 19,76046.4-1.2
Total formal votes42,59298.8
Informal votes5121.2
Turnout 43,10496.4
Liberal notional  hold Swing +1.2

Hoddle

This section is an excerpt from Electoral results for the Division of Hoddle § 1949
1949 Australian federal election: Hoddle
PartyCandidateVotes%±%
Labor Jack Cremean 28,35177.1+1.3
Liberal Terence Kirby6,59317.9-3.3
Communist Leslie Loye1,1373.1+0.0
Independent Albert Wallace6891.9+1.9
Total formal votes36,77096.4
Informal votes1,3823.6
Turnout 38,15294.4
Two-party-preferred result
Labor Jack Cremean 80.8-2.3
Liberal Terence Kirby19.2+2.3
Labor notional  hold Swing -2.3

Indi

This section is an excerpt from Electoral results for the Division of Indi § 1949
1949 Australian federal election: Indi
PartyCandidateVotes%±%
Labor Charles Edmondson13,62636.7+1.9
Liberal William Bostock 12,37733.3+33.3
Country Clive Nason11,15730.0−35.2
Total formal votes37,16098.9
Informal votes4121.1
Turnout 37,57296.7
Two-party-preferred result
Liberal William Bostock 22,18259.7+59.7
Labor Charles Edmondson14,97840.3+40.3
Liberal gain from Country Swing +59.7

Isaacs

This section is an excerpt from Electoral results for the Division of Isaacs (1949–1969) § 1949
1949 Australian federal election: Isaacs
PartyCandidateVotes%±%
Liberal William Haworth 21,26054.0+1.7
Labor John Bourke 18,10046.0-1.4
Total formal votes39,36098.1
Informal votes7471.9
Turnout 40,10794.4
Liberal notional  hold Swing +1.6

Kooyong

This section is an excerpt from Electoral results for the Division of Kooyong § 1949
1949 Australian federal election: Kooyong
PartyCandidateVotes%±%
Liberal Robert Menzies 27,91267.1+4.8
Labor Keith Ewert 13,69132.9+1.3
Total formal votes41,60398.9
Informal votes4631.1
Turnout 42,06697.2
Liberal hold Swing +4.2

La Trobe

This section is an excerpt from Electoral results for the Division of La Trobe § 1949
1949 Australian federal election: La Trobe
PartyCandidateVotes%±%
Liberal Richard Casey 23,64558.6+4.1
Labor Robert Balcombe16,71441.4−4.1
Total formal votes40,35998.3
Informal votes6981.7
Turnout 41,05794.6
Liberal notional  hold Swing +4.1

Lalor

This section is an excerpt from Electoral results for the Division of Lalor § 1949
1949 Australian federal election: Lalor
PartyCandidateVotes%±%
Labor Reg Pollard 20,26451.6−5.4
Liberal John Bellair18,97048.4+5.4
Total formal votes39,23498.4
Informal votes6191.6
Turnout 39,85394.5
Labor notional  hold Swing −5.4

Mallee

This section is an excerpt from Electoral results for the Division of Mallee § 1949
1949 Australian federal election: Mallee
PartyCandidateVotes%±%
Country Winton Turnbull 22,65864.6+4.9
Labor Alfred O'Connor12,41035.4−4.9
Total formal votes35,06898.5
Informal votes5331.5
Turnout 35,60196.2
Country notional  hold Swing +4.9

Maribyrnong

This section is an excerpt from Electoral results for the Division of Maribyrnong § 1949
1949 Australian federal election: Maribyrnong
PartyCandidateVotes%±%
Labor Arthur Drakeford 26,63961.9-1.1
Liberal George Hannan 14,67534.1-2.9
Prot. Christian Dem.Colin Neyland1,7514.1+4.1
Total formal votes43,06598.6
Informal votes6031.4
Turnout 43,66897.1
Two-party-preferred result
Labor Arthur Drakeford 64.0+1.0
Liberal George Hannan 36.0-1.0
Labor hold Swing +1.0

McMillan

This section is an excerpt from Electoral results for the Division of McMillan § 1949
1949 Australian federal election: McMillan [3]
PartyCandidateVotes%±%
Labor Adam Keltie14,26338.7-3.6
Liberal Geoffrey Brown 11,93832.4+6.5
Country Bob May 9,71426.4-0.6
Communist Bob Hamilton9122.5-2.2
Total formal votes36,82798.0
Informal votes7582.0
Turnout 37,58595.6
Two-party-preferred result
Liberal Geoffrey Brown 20,96056.9+6.1
Labor Adam Keltie15,86743.1-6.1
Liberal notional  gain from Country Swing +6.1

Melbourne

This section is an excerpt from Electoral results for the Division of Melbourne § 1949
1949 Australian federal election: Melbourne
PartyCandidateVotes%±%
Labor Arthur Calwell 24,18764.5-6.2
Liberal Desmond McGinnes9,36625.0-4.3
Independent Charles McLaren 1,3503.6+3.6
Communist Gerry O'Day1,2443.3+3.3
Protestant ChristianNiven Neyland7942.1+2.1
Lang Labor Philip Wilson5761.5+1.5
Total formal votes37,51796.0
Informal votes1,5444.0
Turnout 39,06193.6
Two-party-preferred result
Labor Arthur Calwell 70.9+0.2
Liberal Desmond McGinnes29.1-0.2
Labor hold Swing +0.2

Melbourne Ports

This section is an excerpt from Electoral results for the Division of Melbourne Ports § 1949
1949 Australian federal election: Melbourne Ports
PartyCandidateVotes%±%
Labor Jack Holloway 26,79267.9-2.5
Liberal Frank Block 12,69032.1+2.5
Total formal votes39,48297.2
Informal votes1,1372.8
Turnout 40,61994.6
Labor hold Swing -2.5

Murray

This section is an excerpt from Electoral results for the Division of Murray § 1949
1949 Australian federal election: Murray
PartyCandidateVotes%±%
Country John McEwen 23,77863.5+5.7
Labor Desmond Devlin13,65036.5+1.4
Total formal votes37,42898.4
Informal votes6161.6
Turnout 38,04495.9
Country notional  hold Swing -1.4

Wannon

This section is an excerpt from Electoral results for the Division of Wannon § 1949
1949 Australian federal election: Wannon
PartyCandidateVotes%±%
Labor Don McLeod 16,90547.1-4.6
Liberal Dan Mackinnon 13,23536.9+9.1
Country Helena Marfell 5,71615.9-1.5
Total formal votes35,85699.1
Informal votes3120.9
Turnout 36,16897.8
Two-party-preferred result
Liberal Dan Mackinnon 18,20350.8+3.8
Labor Don McLeod 17,65349.2-3.8
Liberal gain from Labor Swing +3.8

Wills

This section is an excerpt from Electoral results for the Division of Wills § 1949
1949 Australian federal election: Wills
PartyCandidateVotes%±%
Labor Bill Bryson 18,91844.2+0.7
Liberal Allan Tyrer15,10135.3+3.3
Independent Doris Blackburn 8,80120.6-2.7
Total formal votes42,82098.6
Informal votes6131.4
Turnout 43,43396.4
Two-party-preferred result
Labor Bill Bryson 25,16258.8-2.7
Liberal Allan Tyrer17,65841.2+2.7
Labor notional  hold Swing -2.7

Wimmera

This section is an excerpt from Electoral results for the Division of Wimmera § 1949
1949 Australian federal election: Wimmera
PartyCandidateVotes%±%
Liberal William Lawrence 13,76139.0+17.5
Labor Cyril Sudholz11,18431.7-6.8
Country Harrie Wade 10,34329.3-10.7
Total formal votes35,28899.1
Informal votes3080.9
Turnout 35,59697.0
Two-party-preferred result
Liberal William Lawrence 22,89464.9+64.9
Labor Cyril Sudholz12,39435.1-5.6
Liberal gain from Country Swing +5.6

Yarra

This section is an excerpt from Electoral results for the Division of Yarra § 1949
1949 Australian federal election: Yarra
PartyCandidateVotes%±%
Labor Stan Keon 23,21158.8-1.8
Liberal Charles Barrington14,18935.9+2.9
Communist John Prescott1,0982.8-3.1
Independent Wenham Vines9912.5+2.5
Total formal votes39,48997.5
Informal votes1,0182.5
Turnout 40,50795.4
Two-party-preferred result
Labor Stan Keon 62.7-3.7
Liberal Charles Barrington37.3+3.7
Labor hold Swing -3.7

Queensland

1949 Australian federal election (Queensland)
Flag of Queensland.svg
  1946 10 December 1949 1951  

All 18 Queensland seats in the House of Representatives
9 seats needed for a majority
 First partySecond party
  Robert Menzies headshot (cropped).jpg Benchifley.jpg
Leader Robert Menzies Ben Chifley
Party Coalition Labor
Seats before55
Seats won153
Seat changeIncrease2.svg 10Decrease2.svg 2
Popular vote263,336254,949
Percentage56.3%39.5%
SwingIncrease2.svg 8.9ppDecrease2.svg 3.6pp
TPP 57.3%42.7%

Bowman

This section is an excerpt from Electoral results for the Division of Bowman § 1949
1949 Australian federal election: Bowman [4]
PartyCandidateVotes%±%
Liberal Malcolm McColm 20,09053.4+6.1
Labor Wilfred Coutts 16,88644.9−7.8
Communist Mabel Hanson6561.7+1.7
Total formal votes37,63297.7
Informal votes8772.3
Turnout 38,50995.4
Two-party-preferred result
Liberal Malcolm McColm 53.8+6.5
Labor Wilfred Coutts 46.2−6.5
Liberal notional  gain from Labor Swing −1.4

Brisbane

This section is an excerpt from Electoral results for the Division of Brisbane § 1949
1949 Australian federal election: Brisbane
PartyCandidateVotes%±%
Labor George Lawson 18,89052.3−7.4
Liberal James Long15,26942.3+6.0
Communist Alby Graham1,9545.4+5.4
Total formal votes36,11397.3
Informal votes1,0212.7
Turnout 37,13493.6
Two-party-preferred result
Labor George Lawson 57.3−6.4
Liberal James Long42.7+6.4
Labor hold Swing −6.4

Capricornia

This section is an excerpt from Electoral results for the Division of Capricornia § 1949
1949 Australian federal election: Capricornia
PartyCandidateVotes%±%
Liberal Henry Pearce 16,94952.2−0.1
Labor Mick Gardner 15,12146.6+2.1
Communist Ted Robertson4131.3+1.3
Total formal votes32,48398.5
Informal votes5081.5
Turnout 32,99196.6
Two-party-preferred result
Liberal Henry Pearce 52.3−2.3
Labor Mick Gardner 47.7+2.3
Liberal hold Swing −2.3

Darling Downs

This section is an excerpt from Electoral results for the Division of Darling Downs § 1949
1949 Australian federal election: Darling Downs
PartyCandidateVotes%±%
Liberal Reginald Swartz 21,26158.9+58.9
Labor James Kane 11,28131.2-5.0
Independent Charles Farquharson3,0418.4+8.4
Communist Raymond Mullaly2810.8+0.8
Independent Charles Lacaze2600.7+0.7
Total formal votes36,12498.4
Informal votes5871.6
Turnout 36,71197.2
Two-party-preferred result
Liberal Reginald Swartz 62.5+62.5
Labor James Kane 37.5-1.9
Liberal gain from Country Swing +1.9

Dawson

This section is an excerpt from Electoral results for the Division of Dawson § 1949
1949 Australian federal election: Dawson
PartyCandidateVotes%±%
Country Charles Davidson 19,30258.4+12.3
Labor George Burns12,38937.5-5.3
Communist Richard Andrew1,3794.2-3.5
Total formal votes33,07098.0
Informal votes6592.0
Turnout 33,72993.5
Two-party-preferred result
Country Charles Davidson 58.6+9.8
Labor George Burns41.4-9.8
Country notional  gain from Labor Swing +9.8

Fisher

This section is an excerpt from Electoral results for the Division of Fisher § 1949
1949 Australian federal election: Fisher
PartyCandidateVotes%±%
Country Charles Adermann 26,63066.5+5.3
Labor Edmund Roberts9,98024.9-2.2
Independent Norman Logan3,4198.5+8.5
Total formal votes40,02998.9
Informal votes4531.1
Turnout 40,48294.9
Two-party-preferred result
Country Charles Adermann 70.7+4.1
Labor Edmund Roberts29.3-4.1
Country notional  hold Swing +4.1

Griffith

This section is an excerpt from Electoral results for the Division of Griffith § 1949
1949 Australian federal election: Griffith
PartyCandidateVotes%±%
Liberal Doug Berry 18,38151.7+1.3
Labor William Conelan 16,46446.3-3.3
Communist Anna Slater7272.0+2.0
Total formal votes35,57296.8
Informal votes1,1793.2
Turnout 36,75195.2
Two-party-preferred result
Liberal Doug Berry 51.9+1.5
Labor William Conelan 48.1-1.5
Liberal hold Swing +1.5

Herbert

This section is an excerpt from Electoral results for the Division of Herbert § 1949
1949 Australian federal election: Herbert
PartyCandidateVotes%±%
Labor Bill Edmonds 17,39549.4+1.0
Country Doug Jeffrey15,97345.4+13.0
Communist Jim Henderson1,8475.2-10.6
Total formal votes35,21596.8
Informal votes1,1603.2
Turnout 36,37593.1
Two-party-preferred result
Labor Bill Edmonds 18,89853.7-10.4
Country Doug Jeffrey16,31746.3+10.4
Labor hold Swing -10.4

Kennedy

This section is an excerpt from Electoral results for the Division of Kennedy § 1949
1949 Australian federal election: Kennedy
PartyCandidateVotes%±%
Labor Bill Riordan 15,12755.1-3.2
Country Ulick Browne11,39741.5+4.6
Communist Eric Wyper9473.4-0.4
Total formal votes27,47198.1
Informal votes5331.9
Turnout 28,00489.3
Two-party-preferred result
Labor Bill Riordan 58.4-3.7
Country Ulick Browne41.6+3.7
Labor hold Swing -3.7

Leichhardt

This section is an excerpt from Electoral results for the Division of Leichhardt § 1949
1949 Australian federal election: Leichhardt
PartyCandidateVotes%±%
Country Tom Gilmore 16,29149.6+8.0
Labor Cecil Holdcroft13,89442.3-11.2
Communist Ralph Leinster1,1413.5-0.7
Independent Thomas Mackey1,1063.4+3.4
Independent Leslie Keough4241.3+1.3
Total formal votes32,85695.8
Informal votes1,4274.2
Turnout 34,28391.5
Two-party-preferred result
Country Tom Gilmore 51.7+9.2
Labor Cecil Holdcroft48.3-9.2
Country notional  gain from Labor Swing +9.2

Lilley

This section is an excerpt from Electoral results for the Division of Lilley § 1949
1949 Australian federal election: Lilley
PartyCandidateVotes%±%
Liberal Bruce Wight 22,48859.4+15.2
Labor Jim Hadley 15,36840.6-4.2
Total formal votes37,85698.1
Informal votes7271.9
Turnout 38,58394.1
Liberal hold Swing +9.2

Maranoa

This section is an excerpt from Electoral results for the Division of Maranoa § 1949
1949 Australian federal election: Maranoa
PartyCandidateVotes%±%
Country Charles Russell 18,65259.6+6.3
Labor Martin Laracy12,65740.4-1.6
Total formal votes31,30998.9
Informal votes3351.1
Turnout 31,64493.8
Country hold Swing +3.8

McPherson

This section is an excerpt from Electoral results for the Division of McPherson § 1949
1949 Australian federal election: McPherson
PartyCandidateVotes%±%
Country Arthur Fadden 24,26374.2+46.6
Labor John Hilton8,43625.8-5.1
Total formal votes32,69998.4
Informal votes5211.6
Turnout 33,22094.0
Country notional  gain from Liberal Swing +5.1

Moreton

This section is an excerpt from Electoral results for the Division of Moreton § 1949
1949 Australian federal election: Moreton
PartyCandidateVotes%±%
Liberal Josiah Francis 25,12561.4+8.1
Labor William Thieme14,91536.4-5.6
Communist Bill Yarrow9042.2+2.2
Total formal votes40,94497.9
Informal votes8672.1
Turnout 41,81195.2
Two-party-preferred result
Liberal Josiah Francis 61.6+0.8
Labor William Thieme38.4-0.8
Liberal hold Swing +0.8

Oxley

This section is an excerpt from Electoral results for the Division of Oxley § 1949
1949 Australian federal election: Oxley
PartyCandidateVotes%±%
Liberal Donald Cameron 14,89542.1+8.9
Labor Evan Marginson 14,26840.3+0.2
Country John Martin5,65816.0-11.0
Communist Wallace Dawson5761.6+1.6
Total formal votes35,39798.0
Informal votes7262.0
Turnout 36,12396.7
Two-party-preferred result
Liberal Donald Cameron 20,09756.8-3.0
Labor Evan Marginson 15,30043.2+3.0
Liberal notional  hold Swing -3.0

Petrie

This section is an excerpt from Electoral results for the Division of Petrie § 1949
1949 Australian federal election: Petrie
PartyCandidateVotes%±%
Liberal Alan Hulme 23,80359.7+14.6
Labor Samuel Martin14,59336.6-7.4
Independent James Ryan1,4883.7+3.7
Total formal votes39,88498.3
Informal votes6831.7
Turnout 40,56794.5
Two-party-preferred result
Liberal Alan Hulme 61.6+10.8
Labor Samuel Martin38.4-10.8
Liberal notional  hold Swing +10.8

Ryan

This section is an excerpt from Electoral results for the Division of Ryan § 1949
1949 Australian federal election: Ryan
PartyCandidateVotes%±%
Liberal Nigel Drury 24,91760.3+17.3
Labor Leonard Eastment 16,43139.7-6.6
Total formal votes41,34898.2
Informal votes7551.8
Turnout 42,10394.3
Liberal notional  hold Swing +9.2

Wide Bay

This section is an excerpt from Electoral results for the Division of Wide Bay § 1949
1949 Australian federal election: Wide Bay
PartyCandidateVotes%±%
Country Bernard Corser 22,03756.5+9.0
Labor Samuel Round10,94128.0-7.9
Independent Robert McDowell6,03715.5+15.5
Total formal votes39,01598.6
Informal votes5721.4
Turnout 39,58796.7
Two-party-preferred result
Country Bernard Corser 64.3+8.9
Labor Samuel Round35.7-8.9
Country hold Swing +8.9

South Australia

1949 Australian federal election (South Australia)
Flag of South Australia.svg
  1946 10 December 1949 1951  

All 10 SA seats in the House of Representatives
5 seats needed for a majority
 First partySecond party
  Benchifley.jpg Robert Menzies headshot (cropped).jpg
Leader Ben Chifley Robert Menzies
Party Labor Coalition
Seats before42
Seats won46
Seat changeSteady2.svgIncrease2.svg 4
Popular vote204,277200,215
Percentage49.7%48.7%
SwingDecrease2.svg 4.8ppIncrease2.svg 7.0pp
TPP 50.6%49.4%

Adelaide

This section is an excerpt from Electoral results for the Division of Adelaide § 1949
1949 Australian federal election: Adelaide [5]
PartyCandidateVotes%±%
Labor Cyril Chambers 23,82359.8−2.1
Liberal Basil Harford14,82037.2+3.8
Communist Elsie Watt6831.7−3.0
Independent Christopher Doherty5041.3+1.3
Total formal votes39,83096.9
Informal votes1,2603.1
Turnout 41,09096.8
Two-party-preferred result
Labor Cyril Chambers 62.1−4.0
Liberal Basil Harford37.9+4.0
Labor hold Swing −4.0

Angas

This section is an excerpt from Electoral results for the Division of Angas (1949–1977) § 1949
1949 Australian federal election: Angas [5]
PartyCandidateVotes%±%
Liberal Alick Downer 23,98760.8+8.9
Labor Albert Strachan13,61534.5−10.3
Independent Ralph Whittle1,8574.7+4.7
Total formal votes39,45997.6
Informal votes9652.4
Turnout 40,42497.2
Two-party-preferred result
Liberal Alick Downer 63.1+8.1
Labor Albert Strachan36.9−8.1
Liberal notional  hold Swing +8.1

Barker

This section is an excerpt from Electoral results for the Division of Barker § 1949
1949 Australian federal election: Barker
PartyCandidateVotes%±%
Liberal Archie Cameron 26,03464.5+11.6
Labor John Klar13,35433.1−9.6
Independent John Gartner1,0042.5+2.5
Total formal votes40,39298.3
Informal votes7061.7
Turnout 41,09897.6
Two-party-preferred result
Liberal Archie Cameron 65.8+10.8
Labor John Klar34.2−10.8
Liberal hold Swing +10.8

Boothby

This section is an excerpt from Electoral results for the Division of Boothby § 1949
1949 Australian federal election: Boothby
PartyCandidateVotes%±%
Liberal John McLeay 24,89761.3+9.3
Labor Ralph Wells15,71438.7−9.3
Total formal votes40,61197.9
Informal votes8862.1
Turnout 41,49796.6
Liberal hold Swing +9.3

Grey

This section is an excerpt from Electoral results for the Division of Grey § 1949
1949 Australian federal election: Grey
PartyCandidateVotes%±%
Labor Edgar Russell 20,46554.4-6.1
Liberal Edward Andrews17,14545.6+6.1
Total formal votes37,61098.3
Informal votes6561.7
Turnout 38,26695.5
Labor hold Swing -6.1

Hindmarsh

This section is an excerpt from Electoral results for the Division of Hindmarsh § 1949
1949 Australian federal election: Hindmarsh
PartyCandidateVotes%±%
Labor Clyde Cameron 29,26069.7+2.8
Liberal Albert Turnbull12,73630.3+6.4
Total formal votes41,99697.5
Informal votes1,0962.5
Turnout 43,09297.1
Labor hold Swing -5.4

Kingston

This section is an excerpt from Electoral results for the Division of Kingston § 1949
1949 Australian federal election: Kingston
PartyCandidateVotes%±%
Liberal Jim Handby 23,71351.6+9.3
Labor Thomas Sheehy 22,23348.4-7.6
Total formal votes45,94697.8
Informal votes1,0572.2
Turnout 47,00397.1
Liberal notional  gain from Labor Swing +8.4

Port Adelaide

This section is an excerpt from Electoral results for the Division of Port Adelaide § 1949
1949 Australian federal election: Port Adelaide
PartyCandidateVotes%±%
Labor Albert Thompson 31,97771.5+0.0
Liberal Frederick Boscombe11,87926.5+8.1
Communist Peter Symon 8892.0-8.1
Total formal votes44,74597.9
Informal votes9502.1
Turnout 45,69596.2
Two-party-preferred result
Labor Albert Thompson 73.3-7.3
Liberal Frederick Boscombe26.7+7.3
Labor notional  hold Swing -7.3

Sturt

This section is an excerpt from Electoral results for the Division of Sturt § 1949
1949 Australian federal election: Sturt
PartyCandidateVotes%±%
Liberal Keith Wilson 21,15750.8+7.2
Labor Leslie McMullin18,82845.2-8.8
Independent Leonard Smith1,6283.9+3.9
Total formal votes41,61397.4
Informal votes1,1232.6
Turnout 42,73696.6
Two-party-preferred result
Liberal Keith Wilson 52.8+8.9
Labor Leslie McMullin47.2-8.9
Liberal notional  gain from Labor Swing +8.9

Wakefield

This section is an excerpt from Electoral results for the Division of Wakefield § 1949
1949 Australian federal election: Wakefield
PartyCandidateVotes%±%
Liberal Philip McBride 23,84761.4+8.3
Labor Cyril Hasse15,00838.6-7.2
Total formal votes38,85598.3
Informal votes6811.7
Turnout 39,53697.4
Liberal hold Swing +7.8

Western Australia

1949 Australian federal election (Western Australia)
Flag of Western Australia.svg
  1946 10 December 1949 1951  

All 8 WA seats in the House of Representatives
4 seats needed for a majority
 First partySecond party
  Robert Menzies headshot (cropped).jpg Benchifley.jpg
Leader Robert Menzies Ben Chifley
Party Coalition Labor
Seats before14
Seats won53
Seat changeIncrease2.svg 4Decrease2.svg 1
Popular vote156,670133,701
Percentage52.3%45.4%
SwingIncrease2.svg 14.7ppDecrease2.svg 0.94pp
TPP 53.0%47.0%

Canning

This section is an excerpt from Electoral results for the Division of Canning § 1949
1949 Australian federal election: Canning [6]
PartyCandidateVotes%±%
Country Len Hamilton 12,15936.8-20.1
Liberal William Gillespie10,24431.0+31.0
Labor Thomas Scaddan10,00230.3-12.8
Independent Country Arthur Neville5941.8+1.8
Total formal votes32,99997.5
Informal votes8422.5
Turnout 33,84195.6
Two-party-preferred result
Country Len Hamilton 17,64053.5-3.4
Liberal William Gillespie15,35946.5+46.5
Country notional  hold Swing -3.4

Curtin

This section is an excerpt from Electoral results for the Division of Curtin § 1949
1949 Australian federal election: Curtin
PartyCandidateVotes%±%
Liberal Paul Hasluck 24,85761.2+15.7
Labor William Lonnie15,78138.8−12.6
Total formal votes40,63898.1
Informal votes8031.9
Turnout 41,44195.1
Liberal notional  gain from Labor Swing +13.8

Forrest

This section is an excerpt from Electoral results for the Division of Forrest § 1949
1949 Australian federal election: Forrest
PartyCandidateVotes%±%
Labor Nelson Lemmon 15,93543.8-7.8
Country Arnold Potts 10,00327.5+6.3
Liberal Gordon Freeth 9,82827.0-0.2
Independent James Bolitho6421.8+1.8
Total formal votes36,40898.0
Informal votes7492.0
Turnout 37,15797.5
Two-party-preferred result
Liberal Gordon Freeth 19,21752.8+4.4
Labor Nelson Lemmon 17,19147.2-4.4
Liberal gain from Labor Swing +4.4

Fremantle

This section is an excerpt from Electoral results for the Division of Fremantle § 1949
1949 Australian federal election: Fremantle
PartyCandidateVotes%±%
Labor Kim Beazley Sr. 22,46354.7-9.8
Liberal Billy Snedden 17,91843.6+8.1
Communist Paddy Troy 6751.6+1.6
Total formal votes41,05697.9
Informal votes8622.1
Turnout 41,91896.4
Two-party-preferred result
Labor Kim Beazley Sr. 56.2-8.3
Liberal Billy Snedden 43.8+8.3
Labor hold Swing -8.3

Kalgoorlie

This section is an excerpt from Electoral results for the Division of Kalgoorlie § 1949
1949 Australian federal election: Kalgoorlie
PartyCandidateVotes%±%
Labor Herbert Johnson 18,12762.4-9.3
Liberal John Porteus10,90237.6+9.3
Total formal votes29,02997.8
Informal votes6532.2
Turnout 29,68293.9
Labor hold Swing -9.3

Moore

This section is an excerpt from Electoral results for the Division of Moore § 1949
1949 Australian federal election: Moore
PartyCandidateVotes%±%
Labor Kevin Byrne12,28238.0-7.0
Country Hugh Leslie 12,24437.8-17.2
Liberal Ken Jones7,83624.2+24.2
Total formal votes32,36297.3
Informal votes8942.7
Turnout 33,25694.5
Two-party-preferred result
Country Hugh Leslie 19,09859.0+4.0
Labor Kevin Byrne13,26441.0-4.0
Country notional  hold Swing +4.0

Perth

This section is an excerpt from Electoral results for the Division of Perth § 1949
1949 Australian federal election: Perth
PartyCandidateVotes%±%
Labor Tom Burke 18,41247.8-7.7
Liberal Gordon Hack17,85846.4+10.9
Independent James Collins1,7564.6+4.6
Communist James Kelly4861.3-2.3
Total formal votes38,51297.5
Informal votes9922.5
Turnout 39,50494.9
Two-party-preferred result
Labor Tom Burke 19,29450.1-11.3
Liberal Gordon Hack19,21849.9+11.3
Labor hold Swing -11.3

Swan

This section is an excerpt from Electoral results for the Division of Swan § 1949
1949 Australian federal election: Swan
PartyCandidateVotes%±%
Liberal Bill Grayden 22,82152.4+11.1
Labor Harry Webb 20,69947.6-9.1
Total formal votes43,52097.7
Informal votes1,0102.3
Turnout 44,53095.2
Liberal gain from Labor Swing +10.2

Tasmania

1949 Australian federal election (Tasmania)
Flag of Tasmania.svg
  1946 10 December 1949 1951  

All 5 Tasmanian seats in the House of Representatives
3 seats needed for a majority
 First partySecond party
  Robert Menzies headshot (cropped).jpg Benchifley.jpg
Leader Robert Menzies Ben Chifley
Party Coalition Labor
Seats before23
Seats won41
Seat changeIncrease2.svg 2Decrease2.svg 2
Popular vote80,74870,248
Percentage53.5%46.5%
SwingIncrease2.svg 8.1ppDecrease2.svg 4.3pp
TPP 53.5%46.5%

Bass

This section is an excerpt from Electoral results for the Division of Bass § 1949
1949 Australian federal election: Bass [7]
PartyCandidateVotes%±%
Liberal Bruce Kekwick 15,68650.6+6.8
Labor Claude Barnard 15,31249.4−6.8
Total formal votes30,99897.3
Informal votes8652.7
Turnout 31,86396.9
Liberal gain from Labor Swing +6.8

Darwin

This section is an excerpt from Electoral results for the Division of Darwin § 1949
1949 Australian federal election: Darwin [7]
PartyCandidateVotes%±%
Liberal Dame Enid Lyons 16,45556.6+3.3
Labor Harold Kirkpatrick12,60243.4-3.3
Total formal votes29,05797.6
Informal votes7282.4
Turnout 29,78596.8
Liberal hold Swing +3.3

Denison

This section is an excerpt from Electoral results for the Division of Denison § 1949
1949 Australian federal election: Denison [7]
PartyCandidateVotes%±%
Liberal Athol Townley 16,43155.1+10.9
Labor Henry Cosgrove 13,39444.9-10.9
Total formal votes29,82598.0
Informal votes6142.0
Turnout 30,43994.3
Liberal gain from Labor Swing +10.9

Franklin

This section is an excerpt from Electoral results for the Division of Franklin § 1949
1949 Australian federal election: Franklin [7]
PartyCandidateVotes%±%
Liberal Bill Falkinder 17,64458.0+6.9
Labor Jack Frost 12,79042.0-6.9
Total formal votes30,43497.4
Informal votes8222.6
Turnout 31,25696.7
Liberal hold Swing +6.9

Wilmot

This section is an excerpt from Electoral results for the Division of Wilmot § 1949
1949 Australian federal election: Wilmot [7]
PartyCandidateVotes%±%
Labor Gil Duthie 16,15052.6+0.9
Liberal Rickman Furmage14,53247.4-0.9
Total formal votes30,68296.7
Informal votes1,0363.3
Turnout 31,71895.3
Labor hold Swing +0.9

Territories

Australian Capital Territory

1949 Australian federal election (Australian Capital Territory)
Flag of the Australian Capital Territory.svg
10 December 1949 1951  

Division of Australian Capital Territory
 First partySecond party
  Benchifley.jpg Robert Menzies headshot (cropped).jpg
Leader Ben Chifley Robert Menzies
Party Labor Coalition
Seats won00
Popular vote4,8232,510
Percentage43.2%22.5%
TPP 46.2%
This section is an excerpt from Electoral results for the Division of Australian Capital Territory § 1949
1949 Australian federal election: Australian Capital Territory [8]
PartyCandidateVotes%±%
Labor Sidney Rhodes4,82343.2+43.2
Independent Lewis Nott 3,47531.1+31.1
Liberal Malcolm Moir2,51022.5+22.5
Independent Jessie Ashton3663.3+3.3
Total formal votes11,17499.4
Informal votes680.6
Turnout 11,24294.9
Two-party-preferred result
Independent Lewis Nott 6,01353.8+53.8
Labor Sidney Rhodes5,16146.2+46.2
Independent win(new seat)

Northern Territory

This section is an excerpt from Electoral results for the Division of Northern Territory § 1949
1949 Australian federal election: Northern Territory [9]
PartyCandidateVotes%±%
Labor Jock Nelson 2,30344.3+21.9
Independent Adair Blain 1,93237.2-5.2
Independent (Non-Socialist) Labor Victor Webster 96118.5+18.5
Total formal votes5,19697.7
Informal votes1222.3
Turnout 5,31880.7
Two-party-preferred result
Labor Jock Nelson 2,73752.7+52.7
Independent Adair Blain 2,45947.3-8.6
Labor gain from Independent Swing +8.6

See also

Notes

Related Research Articles

This is a list of electoral results for the Division of Mackellar in Australian federal elections from the division's creation in 1949 until the present.

This is a list of electoral results for the Division of Mitchell in Australian federal elections from the division's creation in 1949 until the present.

This is a list of electoral results for the Division of Paterson in Australian federal elections from the division's creation in 1949 until its abolition in 1984, and then from its recreation in 1993 until the present.

This is a list of electoral results for the Division of Lawson in Australian federal elections from the division's creation in 1949 until its abolition in 1969.

This is a list of electoral results for the Division of Australian Capital Territory in Australian federal elections from the division's creation in 1949 until its abolition in 1974.

This is a list of electoral division results for the Australian 1954 federal election.

This is a list of electoral division results for the Australian 1946 federal election.

This is a list of electoral division results for the Australian 1951 federal election.

This is a list of electoral division results for the Australian 1955 federal election.

This is a list of electoral division results for the Australian 1958 federal election.

This is a list of electoral division results for the Australian 1961 federal election.

This is a list of electoral division results for the Australian 1966 federal election.

This is a list of electoral division results for the Australian 1969 federal election.

This is a list of electoral division results for the Australian 1972 federal election.

This is a list of electoral division results for the Australian 1974 federal election.

This is a list of electoral division results for the Australian 1975 federal election.

This is a list of electoral division results for the Australian 1977 federal election.

This is a list of electoral division results for the Australian 1980 federal election.

This is a list of electoral division results for the Australian 1983 federal election.

<span class="mw-page-title-main">Results of the 1984 Australian federal election in New South Wales</span>

This is a list of electoral division results for the Australian 1984 federal election in the state of New South Wales.
References

  1. "1949 House of Representatives". Psephos Adam Carr's Election Archive. Retrieved 29 May 2022.
  2. 1 2 3 4 5 6 7 8 9 10 11 12 13 14 15 16 17 18 19 20 21 "1949 House of Representatives: NSW". Psephos Adam Carr's Election Archive. Retrieved 29 May 2022.
  3. 1 2 3 4 "1949 House of Representatives: Victoria". Psephos Adam Carr's Election Archive. Retrieved 29 May 2022.
  4. "1949 House of Representatives: Queensland". Psephos Adam Carr's Election Archive. Retrieved 29 May 2022.
  5. 1 2 "1949 House of Representatives: South Australia". Psephos Adam Carr's Election Archive. Retrieved 29 May 2022.
  6. "1949 House of Representatives: Western Australia". Psephos Adam Carr's Election Archive. Retrieved 29 May 2022.
  7. 1 2 3 4 5 "1949 House of Representatives: Tasmania". Psephos Adam Carr's Election Archive. Retrieved 29 May 2022.
  8. "1949 House of Representatives: Australian Capital Territory". Psephos Adam Carr's Election Archive. Retrieved 29 May 2022.
  9. "1949 House of Representatives: Northern Territory". Psephos Adam Carr's Election Archive. Retrieved 29 May 2022.