Results of the 2004 Australian federal election (Senate)

Last updated

2004 Australian Senate elections
Flag of Australia (converted).svg
  2001 9 October 2004 2007  

40 of the 76 seats in the Australian Senate
39 seats needed for a majority
 First partySecond party
  Robert Hill (1).jpg John Faulkner.jpg
Leader Robert Hill John Faulkner
Party Liberal/National Coalition Labor
Leader's seat South Australia New South Wales
Seats before3428
Seats after3928
Seat changeIncrease2.svg 5Steady2.svg
Popular vote5,390,0844,186,715
Percentage45.09%35.02%
SwingIncrease2.svg 3.26%Increase2.svg 0.70%

 Third partyFourth party
  Bob Brown profile.png Andrew Bartlett Portrait 2007.jpg
Leader Bob Brown Andrew Bartlett
Party Greens Democrats
Leader's seat Tasmania Queensland
Seats before28
Seats after44
Seat changeIncrease2.svg 2Decrease2.svg 4
Popular vote916,431250,373
Percentage7.67%2.09%
SwingIncrease2.svg 2.73%Decrease2.svg 5.16%

Australian Senate elected members, 2004.svg
Senators elected in the 2004 federal election

Leader of the Senate before election

Robert Hill
Liberal/National coalition

Elected Leader of the Senate

Robert Hill
Liberal/National coalition

The following tables show state-by-state results in the Australian Senate at the 2004 federal election. Senators total 37 coalition (33 Liberal, three coalition National, one CLP), 28 Labor, four Green, one Family First, two non-coalition National and four Democrats. [1] [2] Senator terms are six years (three for territories), and took their seats from 1 July 2005, except the territories who took their seats immediately.

Contents

Preference deals

The Greens directed preferences to the Democrats and Labor ahead of the Coalition, Family First and the Christian Democrats. In exchange, the Democrats preferenced the Greens ahead of both major parties and Labor preferenced the Greens and Democrats first in every state and territory except for Tasmania, where Labor preferenced Family First ahead of the Greens and Democrats, and Victoria, where Labor preferenced Family First, Democratic Labor and the Christian Democrats ahead of the Greens and the Democrats.

The Family First Party preferenced the Democrats and the Christian Democrats ahead of both major parties. In exchange, the Democrats preferenced Family First ahead of both the Greens and both major parties, while the Christian Democrats also preferenced Family First highly. The Family First Party and the Coalition also preferenced each other ahead of Labor and the Greens.

One Nation was preferenced last by Labor, the Democrats, the Coalition and the Greens in every state, while the Greens was preferenced last by Family First, One Nation and the Christian Democrats in every state.

A full listing of preferences can be found here.

Australia

Senate (STV GV) — Turnout 94.82% (CV) — Informal 3.75% [3] [4]
2004 Australian Senate.svg
PartyVotes %±Seats
Seats
won
Not
up
New
total
Seat
change
  Liberal/National Coalition
  Liberal/National joint ticket3,074,95225.72+1.856612Increase2.svg 1
  Liberal 2,109,94817.65+1.96131124Increase2.svg 2
  National 163,2611.37−0.55112Increase2.svg 1
  Country Liberal (NT)41,9230.35+0.00101Steady2.svg
Coalition total 5,390,08445.09+3.26211839Increase2.svg 4
  Labor 4,186,71535.02+0.70161228Steady2.svg
  Greens 916,4317.67+2.73224Increase2.svg 2
  Democrats 250,3732.09-5.16044Decrease2.svg 4
  Family First 210,5671.76+1.76101Increase2.svg 1
  One Nation 206,4551.73-3.81000Decrease2.svg 1
Total11,953,649100.00403676
Invalid/blank votes466,3703.75−0.14
Registered voters/turnout12,420,01994.82-0.38
Source: Upper house results: AEC

New South Wales

Elected#SenatorParty
20041 Bill Heffernan  Liberal
20042 Steve Hutchins  Labor
20043 Concertta Fierravanti-Wells  Liberal
20044 John Faulkner  Labor
20045 Fiona Nash  National
20046 Michael Forshaw  Labor
2001
20011 Helen Coonan  Liberal
20012 Ursula Stephens  Labor
20013 Sandy Macdonald  National
20014 George Campbell  Labor
20015 Marise Payne  Liberal
20016 Kerry Nettle  Greens
2004 Australian federal election: Senate, New South Wales
PartyCandidateVotes%±%
Quota 567,796
Liberal/National Coalition 1. Bill Heffernan (Lib) (elected 1)
2. Concetta Fierravanti-Wells (Lib) (elected 3)
3. Fiona Nash (Nat) (elected 5)
4. John Tierney (Lib)
5. Michael Darby (Lib)
6. Robyn Bain (Nat)
1,753,50744.12+2.36
Labor 1. Steve Hutchins (elected 2)
2. John Faulkner (elected 4)
3. Michael Forshaw (elected 6)
4. Joanna Woods
1,445,60236.37+2.87
Greens 1. John Kaye
2. Carol Berry
3. Ben Oquist
4. Susie Russell
5. Trish Mullins
6. Jeremy Buckingham
291,8457.34+2.98
Christian Democrats 1. Fred Nile
2. Patricia Giles
3. Peter Walker
4. Kevin Hume
5. George Capsis
103,8312.61+0.74
Democrats 1. Aden Ridgeway
2. Nina Burridge
3. Greg Butler
87,3772.20-4.01
One Nation 1. Judith Newson
2. Lynn Stanfield
3. Peter Bussa
75,2841.89-3.69
HEMP 1. Michael Balderstone
2. Graham Askey
24,0160.60-0.32
Family First 1. Joan Woods
2. Ivan Herald
22,2100.56+0.56
Fishing Party 1. Bob Smith
2. David Hitchcock
21,3220.54-0.17
Liberals for Forests 1. Glenn Druery
2. Ruth Green
21,1970.53+0.53
Lower Excise Fuel 1. Dave O'Loughlin
2. Derek Ridgley
19,1560.48-0.13
Outdoor Recreation 1. Leon Belgrave
2. Janos Beregszaszi
13,8220.35+0.35
Group A1. David Ettridge
2. Ashley Ettridge
13,6350.34+0.34
Progressive Labour 1. Klaas Woldring
2. Kate Ferguson
13,1750.33-1.44
Veterans1. Bruce Howlett
2. Bonnie Fraser
3. Trevor Hesse
12,9050.32+0.32
Against Further Immigration 1. David Kitson
2. Edwin Woodger
11,5080.29-0.25
No GST 1. Mick Gallagher
2. Warwick Mead
9,7130.24-0.42
New Country 1. Greg Graham
2. Lisa de Meur
6,2180.16+0.16
Great Australians 1. Brett McHolme
2. Dennis Robinson
4,6910.12+0.12
Socialist Alliance 1. Kylie Moon
2. Ray Jackson
4,2410.11+0.11
Save the ADI Site 1. Geoff Brown
2. Bernie Laughlan
3,2810.08+0.08
Non-Custodial Parents 1. Grahame Marks
2. Andrew Thompson
2,9300.07-0.03
Group K1. Martin Zitek
2. Robert Zitek
2,7500.07+0.07
Citizens Electoral Council 1. Robert Butler
2. Richard Witten
2,4710.06+0.00
Progressive Alliance 1. Reese Malcolm
2. Lee Raper
2,3420.06+0.06
Nuclear Disarmament 1. Michael Denborough
2. Yvonne Francis
2,1630.05-0.07
Group D1. James Harker-Mortlock
2. Kelly Ferguson
1,6370.04+0.04
Independent John Thompson5490.01+0.01
Group W1. Tom Vogelgesang
2. Don Nguyen
5380.01+0.01
Independent Paul Simpson2510.01+0.01
Independent Carole Carpenter2080.01+0.01
Group U1. Nick Beams
2. Terry Cook
1160.00+0.00
Independent Jack Lord740.00+0.01
Total formal votes3,974,56596.53+0.07
Informal votes143,0213.47-0.07
Turnout 4,117,58695.11-0.38

The primary vote saw the Coalition winning three seats and Labor winning two, leaving the Greens and Labor leading the Christian Democrats for the final seat. Preferences from liberals for forests, Family First, the Democrats and One Nation meant that the Christian Democrats ended up overtaking both Labor and the Greens for the final vacancy, but Labor managed to stay ahead of the Greens, meaning that Labor ending up taking the final seat using Green preferences. The result was three seats coalition and three seats Labor. [5]

Victoria

Elected#SenatorParty
20041 Michael Ronaldson  Liberal
20042 Kim Carr  Labor
20043 Julian McGauran  National
20044 Stephen Conroy  Labor
20045 Judith Troeth  Liberal
20046 Steve Fielding   Family First
2001
20011 Mitch Fifield  Liberal
20012 Robert Ray  Labor
20013 Rod Kemp  Liberal
20014 Gavin Marshall  Labor
20015 Kay Patterson  Liberal
20016 Lyn Allison  Democrats
2004 Australian federal election: Senate, Victoria
PartyCandidateVotes%±%
Quota 428,085
Liberal/National Coalition 1. Michael Ronaldson (Lib) (elected 1)
2. Julian McGauran (Nat) (elected 3)
3. Judith Troeth (Lib) (elected 5)
4. Dino De Marchi (Lib)
5. Jim Forbes (Lib)
6. Eugene Notermans (Lib)
1,321,44544.10+4.49
Labor 1. Kim Carr (elected 2)
2. Stephen Conroy (elected 4)
3. Jacinta Collins
4. Marg Lewis
1,082,27136.12-0.67
Greens 1. David Risstrom
2. Richard Di Natale
3. Pamela Curr
4. Liz Conor
5. Sue Pennicuik
6. Berhan Ahmed
263,5518.80+2.81
Democratic Labor 1. John Mulholland
2. Pat Crea
3. Gail King
4. Rosemary Maurus
5. Ken Wells
58,0421.94-0.34
Family First 1. Steve Fielding (elected 6)
2. Danny Nalliah
3. Annette Blaze
4. Allan Meyer
5. Ann Bown
56,3761.88+1.88
Democrats 1. Jess Healy
2. Greg Chipp
3. Tony Inglese
4. Jo McCubbin
55,8671.86-5.96
Liberals for Forests 1. Steve Clancy
2. Rad Wintle
55,1701.84-0.56
One Nation 1. Tim Foster
2. James Neary
21,5320.72-1.73
Pensioners 1. Graeme Cleaves
2. Ian Kleeman
17,4010.58+0.58
Citizens Electoral Council 1. Craig Isherwood
2. Kelly-Ann Paull
16,2270.54+0.45
Christian Democrats 1. Alan Barron
2. Phil Seymour
10,2390.34-0.25
Veterans1. Roger Tozer
2. Pam Brown
8,6010.29+0.29
Group S1. Richard Frankland
2. Peter Phelps
3. John Harding
7,2660.24+0.24
Socialist Alliance 1. Lalitha Chelliah
2. Sue Bolton
4,9060.16+0.16
Republican 1. Peter Consandine
2. Sheila Newman
4,1680.14+0.14
Independent 1. Joseph Toscano
2. Steven Reghenzani
3,4180.11+0.11
Non-Custodial Parents 1. Kevin Boers
2. Brendan Hall
3,3100.11+0.11
Hope 1. Tim Petherbridge
2. Lee-Anne Poynton
2,9380.10+0.01
Progressive Alliance 1. Chris Grigsby
2. Charles Williams
2,4530.08+0.08
Independent Phillip Mason4780.02+0.02
Independent Che Endra Che-Kahn2120.01+0.01
Independent Harald Dreger1920.01+0.01
Independent Judi-ann Leggetts1680.01+0.01
Independent Barry Walters1610.01+0.01
Independent David Buck800.00+0.00
Independent Glenn Floyd710.00+0.00
Independent John Tibble510.00+0.00
Total formal votes2,996,59494.87+0.47
Informal votes162,0475.13-0.47
Turnout 3,158,64195.43-0.61

Primary votes ensured that the Coalition secured three senate seats and Labor secured two. This left the Greens leading with Labor not far behind as preferences began counting. In an attempt to protect their third candidate, Jacinta Collins, Labor made a deal with several groups including the Democratic Labor Party, Family First Party and the Christian Democrats where they would preference her ahead of the Coalition in exchange for Labor preferences, expecting them to be eliminated before these preferences could be distributed. However, it backfired badly as the Family First Party, despite starting with less than two percent of the primary vote, received many preferences from the Christian Democrats, the Aged and Disability Pensioners Party, One Nation, the Coalition, liberals for forests, the Australian Democrats and the Democratic Labor Party that easily put Family First ahead of Labor. And, as per the Jacinta Collins deal, the majority of the Labor preferences went to Family First too, meaning that Steve Fielding was comfortably elected ahead of Greens candidate David Risstrom. The result was three seats Coalition, two seats Labor and one seat Family First. [6]

Queensland

Elected#SenatorParty
20041 Brett Mason  Liberal
20042 Jan McLucas  Labor
20043 George Brandis  Liberal
20044 Joe Ludwig  Labor
20045 Barnaby Joyce  National
20043 Russell Trood  Liberal
2001
20011 Ian Macdonald  Liberal
20012 John Hogg  Labor
20013 Santo Santoro  Liberal
20014 Claire Moore  Labor
20015 Andrew Bartlett  Democrats
20016 Ron Boswell  National
2004 Australian federal election: Senate, Queensland
PartyCandidateVotes%±%
Quota 323,611
Liberal 1. Brett Mason (elected 1)
2. George Brandis (elected 3)
3. Russell Trood (elected 6)
4. Sue Boyce
867,27638.29+3.39
Labor 1. Jan McLucas (elected 2)
2. Joe Ludwig (elected 4)
3. Frank Gilbert
717,00536.12-0.08
National 1. Barnaby Joyce (elected 5)
2. James Baker
3. Stewart Gillies
149,7196.61-2.55
Greens 1. Drew Hutton
2. Sarah Moles
3. Theresa Millard
122,3935.40+2.09
Group K1. Pauline Hanson
2. Judy Smith
102,8244.54+4.54
Family First 1. John Lewis
2. Tracy Skellern-Smith
76,3093.37+3.37
One Nation 1. Len Harris
2. Ian Nelson
3. James Savage
71,0433.14-6.88
Democrats 1. John Cherry
2. Bonny Bauer
49,8982.20-4.49
Fishing Party 1. Kevin Collins
2. Darryl Whitford
29,0341.28+1.28
Liberals for Forests 1. Joseph Clark
2. Archie Chapman
22,2830.98+0.98
HEMP 1. Guy Freemarijuana
2. Tony Kneipp
17,4850.77-0.54
Group O1. Hetty Johnston
2. Diana Scott
15,5960.69+0.69
Group A1. Terry Rushton
2. Eamon Coll
5,1520.23+0.23
Non-Custodial Parents 1. Geoff Webster
2. Doug Thompson
4,2260.19+0.19
Citizens Electoral Council 1. Maurice Hetherington
2. Ray Gillham
3,3590.15+0.05
New Country 1. Lorraine Wheeldon
2. Rowell Walton
2,8410.13+0.13
Socialist Alliance 1. Sam Watson
2. Nicole Clevens
2,3340.10+0.10
Great Australians 1. John Rivett
2. Mal McKenzie
2,2930.10+0.10
Group D1. Selwyn Johnston
2. Susan Harvey
1,4080.06+0.06
Group G1. Gail Duncan
2. Kim McIntosh
1,0150.04+0.04
Progressive Alliance 1. Tony Newman
2. Darrell Morris
9210.04+0.04
Independent Darryl McArthur5680.03+0.03
Independent Hassan Ghulam2950.01+0.01
Total formal votes2,265,27497.21+0.16
Informal votes65,0372.79-0.16
Turnout 2,330,31194.13-1.10

Primary votes saw two Labor and two Liberal senators get elected, leaving the Liberal Party well ahead of the National Party, the Greens and former One Nation leader Pauline Hanson, who this election ran as an independent. Pauline Hanson attracted a lot of preferential votes, which meant that her former party was surprisingly excluded before she was. This meant that her preferences could not go to One Nation and threaten the Liberal and National parties. As such, the National Party, using Fishing Party preferences, won the fifth seat and the Liberals won the sixth seat. The result was three seats Liberal, two seats Labor and one seat National. [7]

Western Australia

Elected#SenatorParty
20041 Chris Ellison  Liberal
20042 Chris Evans  Labor
20043 Ian Campbell  Liberal
20044 Glenn Sterle  Labor
20045 Judith Adams  Liberal
20046 Rachel Siewert  Greens
2001
20011 Alan Eggleston  Liberal
20012 Mark Bishop  Labor
20013 David Johnston  Liberal
20014 Ruth Webber  Labor
20015 Ross Lightfoot  Liberal
20016 Andrew Murray  Democrats
2004 Australian federal election: Senate, Western Australia
PartyCandidateVotes%±%
Quota 161,166
Liberal 1. Chris Ellison (elected 1)
2. Ian Campbell (elected 3)
3. Judith Adams (elected 5)
4. Michelle Steck
556,55849.34+9.21
Labor 1. Chris Evans (elected 2)
2. Glenn Sterle (elected 4)
3. Emiliano Barzotto
366,82532.52-1.63
Greens 1. Rachel Siewert (elected 6)
2. Colin Hughes
3. Christopher Newall
4. Felicity Peterson
90,9568.06+2.21
One Nation 1. James Hopkinson
2. Ron McLean
27,6012.45-4.58
Democrats 1. Brian Greig
2. Dominika Lisowski
3. Jason Meotti
22,6032.00-3.86
Christian Democrats 1. Lachlan Dunjey
2. Peter Watt
3. Norman Gage
21,2341.88+0.63
National 1. Geoff Gill
2. Norm Henning
9,6990.86-1.49
Family First 1. Nigel Irvine
2. Don Hatch
9,5530.85+0.85
Liberals for Forests 1. Lesley McKay
2. Vicki Taylor
5,6800.50-0.92
Progressive Labour 1. Mary Lupi
2. Lyn Kearsley
5,2490.47-0.22
Group A1. Alicia Curtis
2. Steven Ogle
4,1220.37+0.37
Citizens Electoral Council 1. Jean Robertson
2. Stuart Smith
2,0980.19+0.08
New Country 1. Mal Harrington
2. Brendan Mansell
1,9810.18+0.18
Non-Custodial Parents 1. Brian Taylor
2. Geoff Dixon
1,7410.15+0.15
Progressive Alliance 1. Geoff Gibson
2. Stephen Crabbe
9320.08+0.08
Independent Julie Easton1,0150.09+0.09
Independent Jim Jardine1460.01+0.01
Independent Alexander Marsden1320.01+0.01
Total formal votes1,128,15596.46+0.35
Informal votes41,4523.54-0.04
Turnout 1,169,60793.66-1.38

Primary votes saw three Liberal and two Labor senators get elected, leaving the Greens with a sizeable lead against the Liberals. Preferences from the Democrats and Labor saw that lead extended even further, and Greens candidate Rachel Siewert comfortably took the final vacancy. The result was three seats Liberal, two seats Labor and one seat Greens. [8]

South Australia

Elected#SenatorParty
20041 Nick Minchin  Liberal
20042 Anne McEwen  Labor
20043 Amanda Vanstone  Liberal
20044 Annette Hurley  Labor
20045 Alan Ferguson  Liberal
20046 Dana Wortley  Labor
2001
20011 Robert Hill  Liberal
20012 Penny Wong  Labor
20013 Jeannie Ferris  Liberal
20014 Linda Kirk  Labor
20015 Grant Chapman  Liberal
20016 Natasha Stott Despoja  Democrats
2004 Australian federal election: Senate, South Australia
PartyCandidateVotes%±%
Quota 138,249
Liberal 1. Nick Minchin (elected 1)
2. Amanda Vanstone (elected 3)
3. Alan Ferguson (elected 5)
4. Sue Lawrie
459,56047.49+1.94
Labor 1. Anne McEwen (elected 2)
2. Annette Hurley (elected 4)
3. Dana Wortley (elected 6)
343,42235.49+2.25
Greens 1. Brian Noone
2. Clare McCarty
3. Mij Tanith
4. Sandy Montgomery
63,8816.60+3.15
Family First 1. Andrea Mason
2. Tony Bates
3. Toni Turnbull
38,5593.98+3.98
Democrats 1. John McLaren
2. Ruth Russell
3. Tammy Franks
4. Jenny Scott
23,1182.39-10.23
Progressive Alliance 1. Meg Lees
2. Kirk Jones
3. Jenny Macintosh
11,0611.14+1.14
One Nation 1. Andrew Phillips
2. Basil Hille
10,9951.14-3.42
National 1. John Venus
2. Julie Sippo
3. Ian Willcourt
3,8430.40+0.40
Veterans1. Nicholas McShane
2. Jarrad Kay
3,7710.39+0.39
Liberals for Forests 1. Rita Hunt
2. Rachael Barons
2,8000.29+0.29
Group A1. Rolf Klotz
2. Mark Smith
3. Robyn Munro
4. Ivan May
1,9570.20+0.20
Socialist Alliance 1. Tom Burtuleit
2. Amy McDonald
1,2550.13+0.13
Group M1. Ben Yengi
2. Alan Hutton
8900.09+0.09
Group P1. Ralph Hahnheuser
2. Benno Lang
8890.09+0.09
Group C1. Andrew Stanko
2. Damian Woodards
6570.07+0.07
Independent Richard Armour4370.05+0.05
Group B1. Kane Winther
2. Claire Winther
4020.04+0.04
Independent John Lawrie1260.01+0.01
Independent Richard Lutz1150.01+0.01
Total formal votes967,73896.47-0.47
Informal votes35,4243.53+0.47
Turnout 1,003,16295.36-0.86

Primary votes saw three Liberal seats and two Labor seats secured. With South Australia being the former constituent of former Democrats leader now Progressive Alliance leader Meg Lees, the state saw the largest swing against the Democrats and the largest total for the Progressive Alliance. ABC Election Analyst Antony Green suggested that had the Democrats done better in the primary vote in South Australia, they may have won the final senate seat on Family First preferences. Instead, the Democrat preferences saw Family First go ahead of the Greens, leading to Labor winning the seat on Green preferences. The result was three seats Liberal and three seats Labor. [9]

Tasmania

Elected#SenatorParty
20041 Eric Abetz  Liberal
20042 Kerry O'Brien  Labor
20043 Guy Barnett  Liberal
20044 Helen Polley  Labor
20045 Stephen Parry  Liberal
20046 Christine Milne  Greens
2001
20011 Paul Calvert  Liberal
20012 Sue Mackay  Labor
20043 John Watson  Liberal
20014 Nick Sherry  Labor
20015 Bob Brown  Greens
20016 Richard Colbeck  Liberal
2004 Australian federal election: Senate, Tasmania
PartyCandidateVotes%±%
Quota 45,382
Liberal 1. Eric Abetz (elected 1)
2. Guy Barnett (elected 3)
3. Stephen Parry (elected 5)
146,53246.13+7.34
Labor 1. Kerry O'Brien (elected 2)
2. Helen Polley (elected 4)
3. David Price
4. Nicole Wells
106,53133.54-3.30
Greens 1. Christine Milne (elected 6)
2. Karen Cassidy
3. Tom Millen
42,21413.29-0.50
Family First 1. Jacquie Petrusma
2. Lance Bergman
3. Lindsay Smith
7,5632.38+2.38
Group F1. Shayne Murphy 6,8882.17+2.17
Democrats 1. Yulia Onsman
2. Suzanne Cass
2,6140.82-3.80
Christian Democrats 1. David Mitchell
2. Michael Fracalossi
2,0760.65+0.65
Independent Dino Ottavi1,2830.40+0.40
Group G
(Harradine candidates)
1. Steve Martin
2. John Newman
1,1390.36+0.36
Citizens Electoral Council 1. Rob Larner
2. Adrian Watts
5080.16+0.16
Independent Rob Newitt1880.06+0.06
Independent John McDonald990.03+0.03
Independent Ellen Gargan320.01+0.01
Total formal votes317,66796.63-0.08
Informal votes11,0913.37+0.08
Turnout 328,75895.90-0.93

Primary votes saw the Liberal Party winning three senate seats and Labor winning two, leaving the Greens leading for the sixth seat against the Family First Party with a sizable majority. However, Tasmania was one of two states where Labor preferenced the Family First Party ahead the Greens, meaning that the Family First candidate Jacquie Petrusma was expected to receive large amounts of preferences and win the final seat. However, Greens candidate Christine Milne ended up winning the seat, mainly due to the high amount of "below the line" voting in Tasmania. The result was three seats Liberal, two seats Labor and one seat Green. [10]

Territories

Australian Capital Territory

Elected#SenatorParty
20041 Kate Lundy  Labor
20042 Gary Humphries  Liberal
2004 Australian federal election: Senate, Australian Capital Territory
PartyCandidateVotes%±%
Quota 70,436
Labor 1. Kate Lundy (elected 1)
2. David Smith
86,85541.10-0.92
Liberal 1. Gary Humphries (elected 2)
2. Ian Morison
80,02237.87+3.57
Greens 1. Kerrie Tucker
2. Roland Manderson
34,57516.36+9.14
Democrats 1. Rachael Jacobs
2. Peter Bourne
4,5282.14-8.60
Christian Democrats 1. Tim Janes
2. John Miller
3,2941.56-0.19
Progressive Alliance 1. Jeannette Jolley
2. Ryan Deebank
1,1470.54+0.54
Independent Dave Edwards8850.42+0.42
Total formal votes211,30697.54-0.12
Informal votes5,3252.46+0.12
Turnout 216,63195.16-0.53

Northern Territory

Elected#SenatorParty
20041 Nigel Scullion  CLP
20042 Trish Crossin  Labor
2004 Australian federal election: Senate, Northern Territory
PartyCandidateVotes%±%
Quota 30,785
Country Liberal 1. Nigel Scullion (elected 1)
2. Bernadette Greg
41,92345.40+1.69
Labor 1. Trish Crossin (elected 2)
2. Wayne Connop
38,20441.37+2.15
Greens 1. Mark Wakeham
2. Shan McKenzie
7,0167.60+3.33
Democrats 1. Janeen Bulsey
2. Fay Lawrence
4,3684.73-2.57
Socialist Alliance 1. Ray Hayes
2. Kathy Newnam
5690.62+0.62
Independent Wayne Wright2700.29+0.29
Total formal votes92,35096.88-0.36
Informal votes2,9733.12+0.36
Turnout 95,32384.73-1.47

See also

Notes

  1. Both independent senators were from Tasmania. Brian Harradine did not contest the election while Labor turned independent Shayne Murphy was not re-elected.

Related Research Articles

<span class="mw-page-title-main">Australian Greens</span> Australian political party

The Australian Greens, commonly known as The Greens, are a confederation of Green state and territory political parties in Australia. As of the 2022 federal election, the Greens are the third largest political party in Australia by vote and the fourth largest by elected representation. The leader of the party is Adam Bandt, with Mehreen Faruqi serving as deputy leader. Larissa Waters currently holds the role of Senate leader.

<span class="mw-page-title-main">2001 Australian federal election</span> Election for the 40th Parliament of Australia

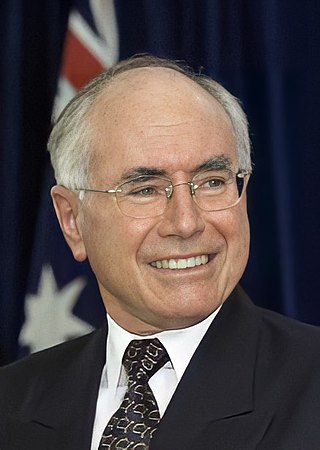
The 2001 Australian federal election was held in Australia on 10 November 2001. All 150 seats in the House of Representatives and 40 seats in the 76-member Senate were up for election. The incumbent Liberal Party of Australia led by Prime Minister of Australia John Howard and coalition partner the National Party of Australia led by John Anderson defeated the opposition Australian Labor Party led by Kim Beazley.

<span class="mw-page-title-main">1998 Australian federal election</span> Election for the 39th Parliament of Australia

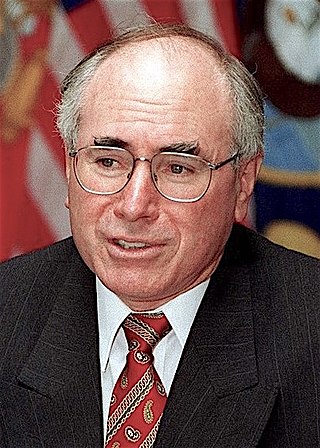
The 1998 Australian federal election was held to determine the members of the 39th Parliament of Australia. It was held on 3 October 1998. All 148 seats of the House of Representatives and 40 seats of the 76-seat Senate were up for election. The incumbent centre-right Liberal/National Coalition government led by Prime Minister John Howard of the Liberal Party and coalition partner Tim Fischer of the National Party defeated the centre-left Australian Labor Party opposition led by Opposition Leader Kim Beazley, despite losing the nationwide popular and two-party preferred vote.

<span class="mw-page-title-main">2004 Australian federal election</span> Election for the 41st Parliament of Australia

The 2004 Australian federal election was held in Australia on 9 October 2004. All 150 seats in the House of Representatives and 40 seats in the 76-member Senate were up for election. The incumbent Liberal Party of Australia led by Prime Minister of Australia John Howard and coalition partner the National Party of Australia led by John Anderson defeated the opposition Australian Labor Party led by Mark Latham.

<span class="mw-page-title-main">1996 Australian federal election</span> Election

The 1996 Australian federal election was held to determine the members of the 38th Parliament of Australia. It was held on 2 March 1996. All 148 seats of the House of Representatives and 40 seats of the 76-seat Senate were up for election. The centre-right Liberal/National Coalition led by Opposition Leader John Howard of the Liberal Party and coalition partner Tim Fischer of the National Party defeated the incumbent centre-left Australian Labor Party government led by Prime Minister Paul Keating in a landslide victory.

<span class="mw-page-title-main">Family First Party</span> Political party in Australia

The Family First Party was a conservative political party in Australia which existed from 2002 to 2017. It was founded in South Australia where it enjoyed its greatest electoral support. Since the demise of the Australian Conservatives into which it merged, it has been refounded in that state as the Family First Party (2021), where it contested the state election in 2022, but failed to win a seat.

The 2004 Australian Federal Election was held on Saturday 9 October 2004 and it was the Howard Government’s opportunity to secure its fourth term of government. The Government consisting of the conservative coalition Liberal Party and National Party headed by John Howard and John Anderson respectively were opposed by Mark Latham and the Labor Party.

<span class="mw-page-title-main">Greens South Australia</span> Political party in Australia

Australian Greens SA is a green political party located in the Australian state of South Australia. It is a member of the federation of the Australian Greens party.

<span class="mw-page-title-main">Queensland Greens</span> Political party in Australia

The Queensland Greens is a Green party in Queensland, Australia, and a state member of the Australian Greens. The party is currently represented in all three levels of government, by Larissa Waters and Penny Allman-Payne in the federal Senate; Stephen Bates, Max Chandler-Mather, and Elizabeth Watson-Brown in the House of Representatives; Michael Berkman and Amy MacMahon in the state Legislative Assembly; and Jonathan Sriranganathan in Brisbane City Council.

<span class="mw-page-title-main">1990 Australian federal election</span> Election

The 1990 Australian federal election was held in Australia on 24 March 1990. All 148 seats in the House of Representatives and 40 seats in the 76-member Senate were up for election. The incumbent Australian Labor Party led by Bob Hawke defeated the opposition Liberal Party of Australia led by Andrew Peacock with coalition partner the National Party of Australia led by Charles Blunt despite losing the nationwide popular and two-party-preferred vote. The election saw the reelection of a Hawke government, the fourth successive term.

<span class="mw-page-title-main">Australian Greens Victoria</span> Political party in Australia

The Australian Greens Victoria, commonly known as the Victorian Greens or just as The Greens, is the Victorian state member party of the Australian Greens, a green political party in Australia.

<span class="mw-page-title-main">Two-party-preferred vote</span> Result of election after distribution of preferences

In Australian politics, the two-party-preferred vote is the result of an election or opinion poll after preferences have been distributed to the highest two candidates, who in some cases can be independents. For the purposes of TPP, the Liberal/National Coalition is usually considered a single party, with Labor being the other major party. Typically the TPP is expressed as the percentages of votes attracted by each of the two major parties, e.g. "Coalition 50%, Labor 50%", where the values include both primary votes and preferences. The TPP is an indicator of how much swing has been attained/is required to change the result, taking into consideration preferences, which may have a significant effect on the result.

<span class="mw-page-title-main">2010 Australian federal election</span> Election for the 43rd Parliament of Australia

The 2010 Australian federal election was held on Saturday, 21 August 2010 to elect members of the 43rd Parliament of Australia. The incumbent centre-left Australian Labor Party led by Prime Minister Julia Gillard won a second term against the opposition centre-right Liberal Party of Australia led by Opposition Leader Tony Abbott and Coalition partner the National Party of Australia, led by Warren Truss, after Labor formed a minority government with the support of three independent MPs and one Australian Greens MP.

<span class="mw-page-title-main">Results of the 2007 Australian federal election (Senate)</span> Australian federal election results

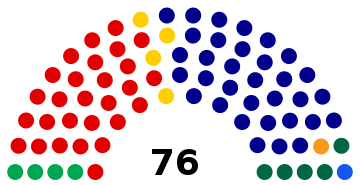
The following tables show state-by-state results in the Australian Senate at the 2007 federal election, 37 Coalition, 32 Labor, five Green, one Family First, and one independent, Nick Xenophon. Senators are elected for six-year terms, and took their seats from 1 July 2008, but senators representing the territories have three-year terms and take their seats immediately.

<span class="mw-page-title-main">2013 Australian federal election</span> Election for the 44th Parliament of Australia

The 2013 Australian federal election to elect the members of the 44th Parliament of Australia took place on 7 September 2013. The centre-right Liberal/National Coalition opposition led by Opposition leader Tony Abbott of the Liberal Party of Australia and Coalition partner the National Party of Australia, led by Warren Truss, defeated the incumbent centre-left Labor Party government of Prime Minister Kevin Rudd in a landslide. Labor had been in government for six years since being elected in the 2007 election. This election marked the end of the Rudd-Gillard-Rudd Labor government and the start of the 9 year long Abbott-Turnbull-Morrison Liberal-National Coalition government. Abbott was sworn in by the Governor-General, Quentin Bryce, as Australia's new Prime Minister on 18 September 2013, along with the Abbott Ministry. The 44th Parliament of Australia opened on 12 November 2013, with the members of the House of Representatives and territory senators sworn in. The state senators were sworn in by the next Governor-General Peter Cosgrove on 7 July 2014, with their six-year terms commencing on 1 July.

<span class="mw-page-title-main">Results of the 2010 Australian federal election (Senate)</span> Australian federal election results

The following tables show state-by-state results in the Australian Senate at the 2010 federal election. Senators total 34 Coalition, 31 Labor, nine Green, one Democratic Labor Party, and one independent, Nick Xenophon. New Senators took their places from 1 July 2011.

A by-election was held for the Victorian Legislative Assembly seat of Melbourne on Saturday 21 July 2012. This was triggered by the resignation of former minister and state Labor MLA Bronwyn Pike which she announced on 7 May 2012.

<span class="mw-page-title-main">Results of the 2013 Australian federal election (Senate)</span> Australian federal election results

The following tables show state-by-state results in the Australian Senate at the 2013 Australian federal election.

<span class="mw-page-title-main">Results of the 2016 Australian federal election (Senate)</span> Australian federal election results

The 2016 Australian federal election in the Senate was part of a double dissolution election held on Saturday 2 July to elect all 226 members of the 45th Parliament of Australia, after an extended eight-week official campaign period. It was the first double dissolution election since the 1987 election and the first under a new voting system for the Senate that replaced group voting tickets with optional preferential voting.

The history of the Australian Greens has its origins in the Green parties founded in the 1980s in the each of the states of Australia.

References

  1. 2004 Senators elected - AEC
  2. 2001 Senators elected - AEC
  3. "Commonwealth Parliament, Senate election - Election of 9 October 2004". Australian Politics and Elections Archive 1856-2018. The University of Western Australia. Retrieved 16 October 2021.
  4. Upper house results: AEC
  5. Senate Results: New South Wales - Federal Election 2004 - ABC (Australian Broadcasting Corporation)
  6. Senate Results: Victoria - Federal Election 2004 - ABC (Australian Broadcasting Corporation)
  7. Senate Results: Queensland - Federal Election 2004 - ABC (Australian Broadcasting Corporation)
  8. Senate Results: Western Australia - Federal Election 2004 - ABC (Australian Broadcasting Corporation)
  9. Senate Results: South Australia - Federal Election 2004 - ABC (Australian Broadcasting Corporation)
  10. Senate Results: Tasmania - Federal Election 2004 - ABC (Australian Broadcasting Corporation)