Results of the 1996 Australian federal election (Senate)

Last updated

1996 Australian Senate elections
Flag of Australia (converted).svg
  1993 2 March 1996 1998  

40 of the 76 seats in the Australian Senate
39 seats needed for a majority
 First partySecond partyThird party
  Robert Hill (1).jpg GarethEvans-crop.JPG No image.png
Leader Robert Hill Gareth Evans Cheryl Kernot
Party Liberal/National Coalition Labor Democrats
Leader's seat South Australia Victoria Queensland
Seats before36307
Seats after37297
Seat changeIncrease2.svg 1Decrease2.svg 1Steady2.svg 0
Popular vote4,792,6823,940,1501,179,357
Percentage43.97%36.15%10.82%
SwingIncrease2.svg 0.92%Decrease2.svg 7.35%Increase2.svg 5.51%

Australian Senate elected members, 1996.svg
Senators elected in the 1996 federal election

Leader of the Senate before election

Gareth Evans
Labor

Elected Leader of the Senate

Robert Hill
Liberal/National coalition

The following tables show state-by-state results in the Australian Senate at the 1996 federal election. Senators total 35 coalition (31 Liberal, three coalition National, one CLP), 29 Labor, two Green, two non-coalition National, seven Democrats, and one Independent. [1] [2] [3] Senator terms are six years (three for territories), and took their seats from 1 July 1996, except the territories who took their seats immediately.

Contents

Australia

Senate (STV GV) — 1996–99 – Turnout 95.20% (CV) — Informal 3.89%
1996 Australian Senate.svg
PartyVotes %SwingSeats wonSeats heldChange
  Liberal–National joint ticket2,669,37724.49+0.096N/A
  Liberal 1,770,48616.24+0.651231Increase2.svg2
  National 312,7692.87+0.1515Decrease2.svg 1
  Country Liberal 40,0500.37+0.0411Steady2.svg
Liberal–National coalition 4,792,68243.97+0.922037Increase2.svg 1
  Labor 3,940,15036.15−7.351429Decrease2.svg 1
  Democrats 1,179,35710.82+5.5157Steady2.svg
  Greens [lower-alpha 1] 345,5133.17+0.6712Steady2.svg
Total10,899,037  4076
Invalid/blank votes395,4423.5
Turnout11,294,47996.2
Registered voters11,740,568
Source: Federal Elections 1996

New South Wales

Elected#SenatorParty
1996
19961 Bob Woods  Liberal
19962 Sue West  Labor
19963 David Brownhill  National
19964 Bruce Childs  Labor
19965 Helen Coonan  Liberal
19966 Vicki Bourne  Democrats
1993
19931 Michael Forshaw  Labor
19932 Michael Baume  Liberal
19933 John Faulkner  Labor
19934 John Tierney  Liberal
19935 Belinda Neal  Labor
19936 Sandy Macdonald  National
1996 Australian federal election: Senate: New South Wales
PartyCandidateVotes%±%
Quota 526,041
Coalition 1. Bob Woods (Lib) (elected 1)
2. David Brownhill (Nat) (elected 3)
3. Helen Coonan (Lib) (elected 5)
4. Abraham Constantin (Lib)
1,522,72241.3+2.4
Labor 1. Sue West (elected 2)
2. Bruce Childs (elected 4)
3. Tom Wheelwright
4. Rima Barghout
1,370,91837.2-9.2
Democrats 1. Vicki Bourne (elected 6)
2. Arthur Chesterfield-Evans
3. Andrew Larcos
4. Troy Anderson
351,4919.5+4.6
Greens 1. Karla Sperling
2. Peter Denton
3. Jane Elix
4. Murray Matson
85,0042.3+0.2
Shooters 1. Richard Sims
2. Robyn Bourke
3. Daniel Redfern
4. Rodney Franich
74,0322.0+0.2
Call to Australia 1. Alasdair Webster
2. Elaine Webster
3. Graeme McLennan
4. Bill Bird
5. Bruce Coleman
72,9692.0+0.5
Against Further Immigration 1. John Phillips
2. Bevan O'Regan
61,8111.7+1.0
Reclaim Australia 1. David Kitson
2. Carolyn O'Callaghan
44,5451.2+1.2
ABFFOC 1. Teresa Findlay-Barnes
2. David Tribe
18,9600.5+0.5
Women's Party 1. Darelle Duncan
2. Sarah Thew
17,4170.5+0.5
No Aircraft Noise 1. Chris Nash
2. Sylvia Hale
17,0430.5+0.5
Seniors United 1. Beryl Evans
2. Lorraine Welsh
8,2680.2+0.2
Grey Power 1. John Verheyen
2. Theo Hetterscheid
3. Bob Segerstrom
4. Olga Pickering
5,1730.1+0.1
Independent Jade Hurley4,7650.1+0.1
Natural Law 1. Catherine Knoles
2. Ines Judd
3,7020.1-0.2
Group I1. Robert Schollbach
2. Amanda Stirling
3,6320.1+0.1
Republican 1. Peter Breen
2. Kerry McNally
3. Valerie Housego
4. Assefa Bekele
5. Antoinette Fahey
2,8460.1+0.1
Group K1. Tony Galati
2. Sam Galati
1,1280.00.0
Group M1. Robert Butler
2. Lindsay Cosgrove
6570.00.0
Independent Morris Jones4850.00.0
Independent Dian Underwood4330.00.0
Independent Bill Bradley3830.00.0
Independent Gretel Pinniger3820.00.0
Independent Ray Patterson2950.00.0
Independent Ivor F2100.00.0
Independent John Barbara570.00.0
Independent David Piggin310.00.0
Total formal votes3,682,28396.2-1.1
Informal votes143,3883.8+1.1
Turnout 3,825,67196.7+0.2

Victoria

Elected#SenatorParty
1996
19961 Richard Alston  Liberal
19962 Robert Ray  Labor
19963 Rod Kemp  Liberal
19964 Barney Cooney  Labor
19965 Kay Patterson  Liberal
19966 Lyn Allison  Democrats
1993
19931 Stephen Conroy  Labor
19932 Jim Short  Liberal
19933 Kim Carr  Labor
19934 Julian McGauran  National
19935 Jacinta Collins  Labor
19936 Judith Troeth  Liberal
1996 Australian federal election: Senate, Victoria
PartyCandidateVotes%±%
Quota 395,356
Coalition 1. Richard Alston (Lib) (elected 1)
2. Rod Kemp (Lib) (elected 3)
3. Kay Patterson (Lib) (elected 5)
4. Robert Ettery (Nat)
5. Robyne Head (Lib)
6. Anthony Fernandez (Lib)
1,146,65541.4-2.7
Labor 1. Robert Ray (elected 2)
2. Barney Cooney (elected 4)
3. Julia Gillard
4. Melanie Raymond
1,100,79939.8-5.2
Democrats 1. Lyn Allison (elected 6)
2. John McLaren
3. Laurie Levy
4. Marj White
300,84810.9+6.9
Greens 1. Peter Singer
2. Karen Alexander
3. Helen Lucas
81,2732.9+1.7
Against Further Immigration 1. Dennis McCormack
2. Robyn Spencer
40,6071.4+1.4
Democratic Labour 1. John Mulholland
2. Paul Cahill
3. Michael Rowe
4. Pat Crea
5. Matthew Cody
6. Christine Dodd
36,1561.3-0.1
Shooters 1. Colin Wood
2. Neville Sayers
3. Gary Fliegner
19,5730.7+0.7
Call to Australia 1. Ken Cook
2. Christine Chapman
16,4970.6-0.1
Pensioner and CIR 1. Will Borzatti
2. Neil McKay
9,0400.3-0.5
Natural Law 1. Stephen Griffith
2. Ngaire Mason
6,6810.2-0.2
Independent David Armstrong3,3210.1+0.1
Republican 1. Paul Dahan
2. Des Bergen
2,2490.1-0.1
Group J1. Joe Toscano
2. Steve Roper
2,0380.1+0.1
Independent Stephen Raskovy6190.00.0
Independent Maurice Smith1500.00.0
Independent Michael Good1100.00.0
Independent John Abbotto960.00.0
Independent Neil Green750.00.0
Total formal votes2,767,48596.4-0.5
Informal votes101,7893.6+0.5
Turnout 2,869,27496.5-0.1

Queensland

Elected#SenatorParty
1996
19961 Ian Macdonald  Liberal
19962 John Hogg  Labor
19963 Ron Boswell  National
19964 John Herron  Liberal
19965 Brenda Gibbs  Labor
19966 Cheryl Kernot  Democrats
1993
19931 Margaret Reynolds  Labor
19932 David MacGibbon  Liberal
19933 Bill O'Chee  National
19934 Mal Colston  Labor
19935 John Herron  Liberal
19936 John Woodley  Democrats
1996 Australian federal election: Senate, Queensland
PartyCandidateVotes%±%
Quota 274,924
Liberal 1. Ian Macdonald (elected 1)
2. John Herron (elected 4)
3. Debbie Kember
680,55335.4+3.9
Labor 1. John Hogg (elected 2)
2. Brenda Gibbs (elected 5)
3. Bernadette Callaghan
583,85030.3-9.1
National 1. Ron Boswell (elected 3)
2. Teresa Cobb
3. Terry Cranwell
288,19915.0+0.5
Democrats 1. Cheryl Kernot (elected 6)
2. Tony Walters
3. Peter Collins
4. Annette Reed
254,21913.2+6.2
Greens 1. Angela Jones
2. Desiree Mahoney
3. Libby Connors
46,2852.4-0.8
Against Further Immigration 1. Cynthia Mayne
2. John Minogue
13,1170.7+0.7
Women's Party 1. Mary Kelly
2. Lizbeth Yuille
3. Jenny Hughey
13,0060.7+0.7
Shooters 1. Peter Salisbury
2. Bill Ison
12,1460.6+0.6
Call to Australia 1. Harry Cook
2. Nan Cook
9,5430.5-0.1
Group G1. J Freemarijuana
2. Tony Kneipp
3,8360.2+0.2
Natural Law 1. Kris Ayyar
2. John Price
3,6560.20.0
One Australia 1. Perry Jewell
2. Michael Grayson
3,6380.2+0.2
Group F1. Phillip Young
2. Harvie Ladlow
2,7930.1+0.1
Indigenous Peoples 1. Sam Watson
2. Netta Tyson
2,7720.1+0.1
Republican 1. Brian Buckley
2. David Bailey
2,6830.1+0.1
Group H1. Ian McNiven
2. Ray Smyth
3. Robert Marks
1,9090.1+0.1
Group M1. Maurice Hetherington
2. Ross Russell
7380.00.0
Group E1. John Jones
2. Lee Jones
6130.00.0
Independent Michelle Mac Nevin5940.00.0
Independent Ross McKay1540.00.0
Independent David Howse910.00.0
Independent Chris Leth670.00.0
Total formal votes1,924,46296.7-1.3
Informal votes64,9793.3+1.3
Turnout 1,989,44195.1-0.7

Western Australia

Elected#SenatorParty
1996
19961 Winston Crane  Liberal
19962 Jim McKiernan  Labor
19963 John Panizza  Liberal
19964 Mark Bishop  Labor
19965 Alan Eggleston  Liberal
19966 Andrew Murray  Democrats
1993
19931 Sue Knowles  Liberal
19932 Peter Cook  Labor
19933 Ian Campbell  Liberal
19934 Chris Evans  Labor
19935 Chris Ellison  Liberal
19936 Dee Margetts  Greens
1996 Australian federal election: Senate, Western Australia
PartyCandidateVotes%±%
Quota 143,472
Liberal 1. Winston Crane (elected 1)
2. John Panizza (elected 3)
3. Alan Eggleston (elected 5)
4. Michael Huston
5. Enzo Sirna
6. Clare Thompson
460,37945.8-2.6
Labor 1. Jim McKiernan elected 2)
2. Mark Bishop (elected 4)
3. Michael Beahan
4. Catherine Crawford
341,58034.1-4.1
Democrats 1. Andrew Murray (elected 6)
2. Don Millar
3. Shirley de la Hunty
93,9379.4+5.3
Greens 1. Christabel Chamarette
2. Robin Chapple
57,0065.7+0.1
National 1. Kevin McAnuff
2. Lynley Anderson
20,8772.0+0.3
Against Further Immigration 1. Richard Haye
2. Robert Hammond
12,6421.2+1.2
Women's Party 1. Mattie Turnbull
2. Kate Mudford
11,1691.1+1.1
Call to Australia 1. Don Jackson
2. Marj Laurie
7,0280.7-0.5
Group C1. Tony Drake
2. Jean Robinson
1,5180.1+0.1
Independent Craig Bradshaw1,0230.1+0.1
Natural Law Ros White4140.0-0.3
Independent Vin Cooper3760.00.0
Independent Craig Mackintosh3460.00.0
Total formal votes1,004,29996.5-1.4
Informal votes36,3693.5+1.4
Turnout 1,040,66895.6-0.3

South Australia

Elected#SenatorParty
1996
19961 Robert Hill  Liberal
19962 Rosemary Crowley  Labor
19963 Natasha Stott Despoja  Democrats
19964 Grant Chapman  Liberal
19965 Chris Schacht  Labor
19966 Jeannie Ferris  Liberal
1993
19931 Amanda Vanstone  Liberal
19932 Nick Bolkus  Labor
19933 Nick Minchin  Liberal
19934 Dominic Foreman  Labor
19935 Alan Ferguson  Liberal
19936 Meg Lees  Democrats
1996 Australian federal election: Senate, South Australia
PartyCandidateVotes%±%
Quota 133,397
Liberal 1. Robert Hill (elected 1)
2. Grant Chapman (elected 4)
3. Jeannie Ferris (elected 6)
4. Maria Kortesis
428,05345.8+0.1
Labor 1. Rosemary Crowley (elected 2)
2. Chris Schacht (elected 5)
3. Deirdre Tedmanson
301,09432.2-5.8
Democrats 1. Natasha Stott Despoja (elected 3)
2. Ian Gilfillan
3. Judy Smith
4. Desea Tsagatos
135,73014.5+4.7
Greens 1. Stephen Spence
2. Meryl McDougall
19,4412.0+0.4
Against Further Immigration 1. Bert Joy
2. Stephen Wikblom
9,4241.0+1.0
Shooters 1. Haydon Aldersey
2. Robert Low
8,9731.0+1.0
Grey Power 1. Emily Gilbey-Riley
2. Gratton Darbyshire
8,2280.9+0.9
Call to Australia 1. David Rodway
2. Brett Rodway
6,8170.7-0.4
Group J1. Kenneth Nicholson
2. Colin Shearing
6,2860.7+0.7
Women's Party 1. Deborah McCulloch
2. Marg McHugh
3. Denise Tzumli
5,6780.6+0.6
Independent EFF 1. David Dwyer
2. Alfred Walker
2,4300.3+0.3
Group F1. Michael Wohltmann
2. Jeanette Wohltmann
1,0810.1+0.1
Independent Geoffrey Wells5610.1+0.1
Total formal votes933,77696.7-1.0
Informal votes31,5523.3+1.0
Turnout 965,32896.4-0.9

Tasmania

Elected#SenatorParty
1996
19961 Jocelyn Newman  Liberal
19962 Sue Mackay  Labor
19963 Paul Calvert  Liberal
19964 Nick Sherry  Labor
19965 John Watson  Liberal
19966 Bob Brown  Greens
1993
19931 Kay Denman  Labor
19932 Eric Abetz  Liberal
19933 John Coates  Labor
19934 Brian Gibson  Liberal
19935 Brian Harradine  Independent
19936 Shayne Murphy  Labor
1996 Australian federal election: Senate, Tasmania
PartyCandidateVotes%±%
Quota 44,139
Liberal 1. Jocelyn Newman (elected 1)
2. Paul Calvert (elected 3)
3. John Watson (elected 5)
130,55242.2+5.5
Labor 1. Sue Mackay (elected 2)
2. Nick Sherry (elected 4)
3. Charles Touber
120,67839.1-3.6
Greens 1. Bob Brown (elected 6)
2. Janet Dale
26,8308.9+2.0
Democrats 1. Robert Bell
2. Julia Onsman
3. Philip Tattersall
22,0067.1+5.5
National 1. Mary Jackson
2. Jeff Clayton
3,5541.2+1.2
Women's Party 1. Claire Andersen
2. Lin MacQueen
1,8810.6+0.6
Natural Law 1. Gregory Broszczyk
2. James James Harlow
1,8110.6+0.6
Call to Australia 1. Don Rogers
2. Beryl Rogers
1,5190.5+0.5
Total formal votes308,97096.8-0.6
Informal votes10,0833.2+0.6
Turnout 319,05396.9+0.3

Australian Capital Territory

Elected#SenatorParty
1996
19961 Kate Lundy  Labor
19962 Margaret Reid  Liberal
1996 Australian federal election: Senate, Australian Capital Territory
PartyCandidateVotes%±%
Quota 64,020
Labor 1. Kate Lundy (elected 1)
2. Peter Conway
81,86642.6-6.0
Liberal 1. Margaret Reid (elected 2)
2. Stephe Jitts
74,94939.0+4.0
Democrats 1. Peter Main
2. Brent Blackburn
19,59010.2+3.3
Greens 1. Deb Foskey
2. Jonathan Millar
11,2975.8-0.2
Call to Australia 1. John Miller
2. James Liaw
2,9011.5+1.5
Independent Fred Skerbic1,4540.8+0.8
Independent Bill Monaghan5970.3+0.3
Independent Joanne Clarke4540.2+0.2
Independent David Seaton1460.1+0.1
Total formal votes192,05797.5-0.9
Informal votes4,8602.5+0.9
Turnout 196,91796.2-0.9

Northern Territory

Elected#SenatorParty
1996
19961 Grant Tambling  Liberal
19962 Bob Collins  Labor
1996 Australian federal election: Senate, Northern Territory
PartyCandidateVotes%±%
Quota 28,569
Country Liberal 1. Grant Tambling (elected 1)
2. Kym Cook
40,05046.7+2.0
Labor 1. Bob Collins (elected 2)
2. Susan Bradley
38,66745.1-10.2
Greens 1. Margie Friel
2. Ilana Eldridge
5,4536.4+6.4
Democrats Geoff Carr1,5351.8+1.8
Total formal votes85,70597.20.0
Informal votes2,4222.80.0
Turnout 88,12789.2+0.2

See also

Notes

  1. Includes votes for the federal Australian Greens (261,677) as well as Greens Western Australia (57,006) and the Tasmanian Greens (26,830), which had not yet aligned with the federal party.
  2. The independent senator was Brian Harradine (Tasmania).

Related Research Articles

<span class="mw-page-title-main">Australian Senate</span> Upper house of the Parliament of Australia

The Senate is the upper house of the bicameral Parliament of Australia, the lower house being the House of Representatives. The composition and powers of the Senate are established in Chapter I of the Constitution of Australia. There are a total of 76 senators: 12 are elected from each of the six Australian states regardless of population and 2 from each of the two autonomous internal Australian territories. Senators are popularly elected under the single transferable vote system of proportional representation.

<span class="mw-page-title-main">Australian Greens</span> Australian political party

The Australian Greens, commonly known as The Greens, are a confederation of Green state and territory political parties in Australia. As of the 2022 federal election, the Greens are the third largest political party in Australia by vote and the fourth largest by elected representation. The leader of the party is Adam Bandt, with Mehreen Faruqi serving as deputy leader. Larissa Waters currently holds the role of Senate leader.

<span class="mw-page-title-main">1998 Australian federal election</span> Election for the 39th Parliament of Australia

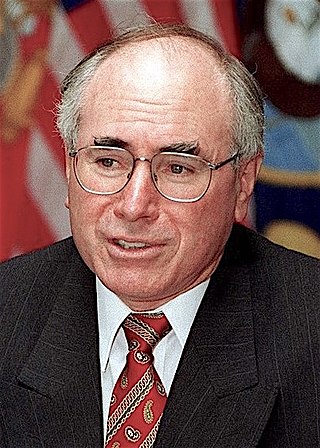
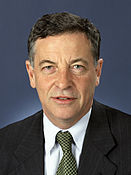
The 1998 Australian federal election was held to determine the members of the 39th Parliament of Australia. It was held on 3 October 1998. All 148 seats of the House of Representatives and 40 seats of the 76-seat Senate were up for election. The incumbent centre-right Liberal/National Coalition government led by Prime Minister John Howard of the Liberal Party and coalition partner Tim Fischer of the National Party defeated the centre-left Australian Labor Party opposition led by Opposition Leader Kim Beazley, despite losing the nationwide popular and two-party preferred vote.

<span class="mw-page-title-main">2010 Australian federal election</span> Election for the 43rd Parliament of Australia

The 2010 Australian federal election was held on Saturday, 21 August 2010 to elect members of the 43rd Parliament of Australia. The incumbent centre-left Australian Labor Party led by Prime Minister Julia Gillard won a second term against the opposition centre-right Liberal Party of Australia led by Opposition Leader Tony Abbott and Coalition partner the National Party of Australia, led by Warren Truss, after Labor formed a minority government with the support of three independent MPs and one Australian Greens MP.

<span class="mw-page-title-main">Results of the 2007 Australian federal election (Senate)</span> Australian federal election results

The following tables show state-by-state results in the Australian Senate at the 2007 federal election, 37 Coalition, 32 Labor, five Green, one Family First, and one independent, Nick Xenophon. Senators are elected for six-year terms, and took their seats from 1 July 2008, but senators representing the territories have three-year terms and take their seats immediately.

<span class="mw-page-title-main">2013 Australian federal election</span> Election for the 44th Parliament of Australia

The 2013 Australian federal election to elect the members of the 44th Parliament of Australia took place on 7 September 2013. The centre-right Liberal/National Coalition opposition led by Opposition leader Tony Abbott of the Liberal Party of Australia and Coalition partner the National Party of Australia, led by Warren Truss, defeated the incumbent centre-left Labor Party government of Prime Minister Kevin Rudd in a landslide. Labor had been in government for six years since being elected in the 2007 election. This election marked the end of the Rudd-Gillard-Rudd Labor government and the start of the 9 year long Abbott-Turnbull-Morrison Liberal-National Coalition government. Abbott was sworn in by the Governor-General, Quentin Bryce, as Australia's new Prime Minister on 18 September 2013, along with the Abbott Ministry. The 44th Parliament of Australia opened on 12 November 2013, with the members of the House of Representatives and territory senators sworn in. The state senators were sworn in by the next Governor-General Peter Cosgrove on 7 July 2014, with their six-year terms commencing on 1 July.

<span class="mw-page-title-main">Results of the 2010 Australian federal election (Senate)</span> Australian federal election results

The following tables show state-by-state results in the Australian Senate at the 2010 federal election. Senators total 34 Coalition, 31 Labor, nine Green, one Democratic Labor Party, and one independent, Nick Xenophon. New Senators took their places from 1 July 2011.

<span class="mw-page-title-main">Results of the 2004 Australian federal election (Senate)</span> Australian federal election results

The following tables show state-by-state results in the Australian Senate at the 2004 federal election. Senators total 37 coalition, 28 Labor, four Green, one Family First, two non-coalition National and four Democrats. Senator terms are six years, and took their seats from 1 July 2005, except the territories who took their seats immediately.

<span class="mw-page-title-main">Results of the 2001 Australian federal election (Senate)</span> Australian federal election results

The following tables show state-by-state results in the Australian Senate at the 2001 federal election. Senators total 35 coalition, 28 Labor, two Green, eight Democrats, two Independents  and one One Nation. Senator terms are six years, and took their seats from 1 July 2002, except the territories who took their seats immediately.

<span class="mw-page-title-main">Members of the Australian Senate, 2016–2019</span>

This is a list of members of the Australian Senate following the 2016 Australian federal election held on 2 July 2016. The election was held as a consequence of a double dissolution in which both houses of parliament were dissolved. Ordinarily, only half of the senators terms end at each election. In this case, all 76 senators were elected. At the first sitting following the election, half of the senators representing each of the six states of Australia were allocated six-year terms to end on 30 June 2022, with the remainder allocated three-year terms to end on 30 June 2019. The terms of senators from the Australian Capital Territory and the Northern Territory end on the day of the next federal election.</ref>

<span class="mw-page-title-main">Results of the 1998 Australian federal election (Senate)</span> Australian federal election results

The following tables show state-by-state results in the Australian Senate at the 1998 federal election. Senators total 34 coalition, 29 Labor, one Green, one non-coalition National, nine Democrats, one Independent and one One Nation. Senator terms are six years, and took their seats from 1 July 1999, except the territories who took their seats immediately.

<span class="mw-page-title-main">Results of the 1993 Australian federal election (Senate)</span> Australian federal election results

The following tables show state-by-state results in the Australian Senate at the 1993 federal election. Senators total 34 coalition, 30 Labor, two Green, two non-coalition National, seven Democrats, and one Independent. Senator terms are six years, and took their seats from 1 July 1993, except the territories who took their seats immediately.

<span class="mw-page-title-main">Results of the 1990 Australian federal election (Senate)</span> Australian federal election results

The following tables show state-by-state results in the Australian Senate at the 1990 federal election. Senators total 31 coalition, 32 Labor, one WA Green, three non-coalition National, eight Democrats, and one independent. Senator terms are six years, and took their seats from 1 July 1990, except the territories who took their seats immediately.

<span class="mw-page-title-main">Results of the 1987 Australian federal election (Senate)</span> Australian federal election results

The following tables show state-by-state results in the Australian Senate at the 1987 federal election. This election was a Double dissolution, which means that all 12 senators from each state were up for election. Senators total 29 coalition, 32 Labor, one Jo Vallentine Peace Group, four non-coalition National, seven Democrats, one Nuclear Disarmament and one Independent. Territory Senators served until the next federal election. State Senator terms were nominally three or six years, backdated from 1 July 1987. The Senate used the order-elected method to allocate three- and six-year seats, despite provisions for the AEC to conduct a special recount.

<span class="mw-page-title-main">Results of the 1984 Australian federal election (Senate)</span> Australian federal election results

The following tables show state-by-state results in the Australian Senate at the 1984 federal election. Senators total 29 coalition, 34 Labor, one Nuclear Disarmament Party, four non-coalition National, seven Democrats, and one Independent. Senator terms are six years, and all took their seats immediately due to the expansion of the senate from 64 to 76 members.

<span class="mw-page-title-main">Results of the 1983 Australian federal election (Senate)</span> Australian federal election results

The following tables show state-by-state results in the Australian Senate at the 1983 Australian federal election. Senators total 25 coalition, 30 Labor, three non-coalition National, five Democrats, and one Independent. Senate terms are six years. As the election was the result of a double dissolution, all 64 senate seats were vacant. All elected senators took their seats immediately with a backdated starting date of 1 July 1982, except for the territorial senators who took their seats at the election. Half of the senators elected in each state were allocated 3-year terms to restore the rotation.

<span class="mw-page-title-main">Results of the 1980 Australian federal election (Senate)</span> Australian federal election results

The following tables show state-by-state results in the Australian Senate at the 1980 federal election. Senators total 31 coalition, 27 Labor, two non-coalition National, five Democrats, and one Independent. Senator terms are six years. Senators elected at this election began their terms on 1 July 1981, except for the territorial senators who took their seats at the election.

<span class="mw-page-title-main">2022 Australian federal election</span> Election for the 47th Parliament of Australia

The 2022 Australian federal election was held on Saturday 21 May 2022 to elect members of the 47th Parliament of Australia. The incumbent Liberal/National Coalition government, led by Prime Minister Scott Morrison, sought to win a fourth consecutive term in office but was defeated by the opposition, the Labor Party, led by Anthony Albanese. Up for election were all 151 seats in the lower house, the House of Representatives, and 40 of the 76 seats in the upper house, the Senate.

<span class="mw-page-title-main">Next Australian federal election</span> Election for the 48th Parliament of Australia

The next Australian federal election will be held some time in or before 2025 to elect members of the 48th Parliament of Australia. All 151 seats in the House of Representatives and likely 40 of the 76 seats in the Senate will be contested. It is expected that at this election, the Labor government of Prime Minister Anthony Albanese will be seeking re-election to a second term in office, opposed by the Liberal/National Coalition under Leader of the Opposition Peter Dutton.

<span class="mw-page-title-main">Results of the 2022 Australian federal election (Senate)</span> Australian federal election results

The 2022 Australian federal election in the Senate was held on 21 May 2022 to elect 40 of the 76 senators in the Australian Senate, after a six-week campaign. Senators elected at this election are scheduled to take office on 1 July 2022, with the exception of the Senators elected from two territories whose terms commence from election day. The elected senators sit alongside continuing senators elected in 2019 as part of the 47th Parliament of Australia.

References

  1. Newman, G; Kopras, A (4 November 1996). "Federal Elections 1996" (PDF). Background Paper 6 1996-97. Parliamentary Research Service. ISSN   1037-2938 . Retrieved 27 June 2022.
  2. "1996 Senate". Psephos Adam Carr's Election Archive. Retrieved 27 June 2022.
  3. "Senators of the 38th Parliament".