Results of the 1996 Australian federal election in New South Wales

Last updated

1996 Australian federal election
(New South Wales)
Flag of New South Wales.svg
  1993 2 March 1996 1998  

All 50 New South Wales seats in the Australian House of Representatives
and 6 seats in the Australian Senate
 First partySecond party
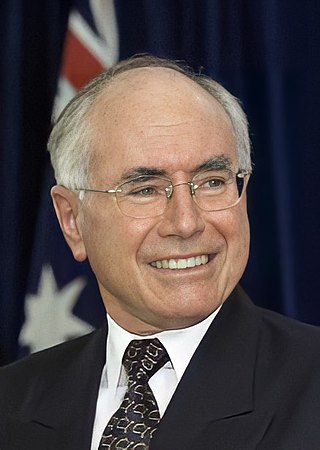
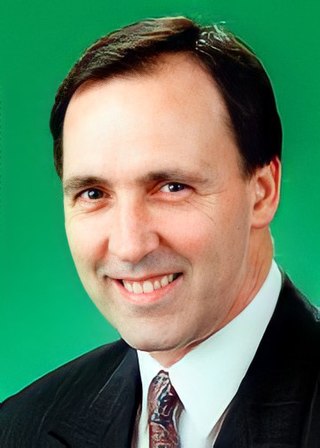
  John howard.jpg Keating Paul BANNER.jpg
Leader John Howard Paul Keating
Party Liberal/National coalition Labor
Last election16 seats33 seats
Seats won29 seats20 seats
Seat changeIncrease2.svg 13Decrease2.svg 13
Popular vote1,742,9651,453,542
Percentage45.6%39.6%
SwingIncrease2.svg 4.0Decrease2.svg 8.7
TPP 52.56%47.44%
TPP swingIncrease2.svg 6.95Decrease2.svg 6.95

This is a list of electoral division results for the Australian 1996 federal election in the state of New South Wales. [1] [2]

Contents

Overall results

Turnout 96.4% (CV) — Informal 3.6% [3]
PartyVotes%SwingSeatsChange
   Liberal 1,229,42333.46+1.6919Increase2.svg 11
  National 443,54212.07+2.3210Increase2.svg 2
Liberal/National Coalition 1,672,96545.53+4.0129Increase2.svg 13
  Labor 1,453,54239.56-8.7620Decrease2.svg 13
  Democrats 240,2556.54+3.73
  Greens 92,5492.52+1.44
  Independents 88,5092.411Steady2.svg
  Against Further Immigration 52,1281.42+1.37
  Christian Democrats 34,1080.93+0.31
  No Aircraft Noise 18,6260.51
  Natural Law 11,2520.31–0.35
  Reclaim Australia 5,4870.15
  Women's Party 1,7080.05
Total3,674,20950
Two-party-preferred vote
  Liberal/National Coalition 1,922,16552.566.9529Increase2.svg 13
  Labor 1,734,77747.44-6.9520Decrease2.svg 13
Invalid/blank votes138,1573.62
Turnout3,812,36696.37
Registered voters3,955,782
Source: Federal Elections 1996

Results by division

Banks

This section is an excerpt from Electoral results for the Division of Banks § 1996
1996 Australian federal election: Banks [1]
PartyCandidateVotes%±%
Labor Daryl Melham 31,87843.56−11.25
Liberal David Sparkes28,90339.49+4.77
Democrats Alison Bailey5,5667.60+4.03
Against Further Immigration Gregg West3,7975.19+5.19
Independent Don Thompson2,0762.84+2.84
Independent John Kayes9701.33+1.33
Total formal votes73,19095.75−0.85
Informal votes3,2464.25+0.85
Turnout 76.43696.85+0.40
Two-party-preferred result
Labor Daryl Melham 37,44251.41−9.13
Liberal David Sparkes35,39148.59+9.13
Labor hold Swing −9.13

Barton

This section is an excerpt from Electoral results for the Division of Barton § 1996
1996 Australian federal election: Barton
PartyCandidateVotes%±%
Labor Robert McClelland 35,94348.38−7.54
Liberal Arthur Santorinios30,58241.17+3.29
Democrats Craig Chung4,0265.42+2.91
Call to Australia Chris D McLean2,3813.20+1.70
Independent Safwan Nasser1,3591.83+1.83
Total formal votes74,29195.71−0.25
Informal votes3,3284.29+0.25
Turnout 77,61996.81+0.50
Two-party-preferred result
Labor Robert McClelland 40,25054.34−5.05
Liberal Arthur Santorinios33,81745.66+5.05
Labor hold Swing −5.05

Bennelong

This section is an excerpt from Electoral results for the Division of Bennelong § 1996
1996 Australian federal election: Bennelong [1]
PartyCandidateVotes%±%
Liberal John Howard 40,58953.83+3.71
Labor Wendy Mahon24,24832.16−9.49
Democrats Suzanne Reddy4,7006.23+0.95
Against Further Immigration Paul Kemp1,9682.61+2.61
Greens Jamie Parker 1,8612.47+2.47
No Aircraft Noise Robert Shaw1,3051.73+1.73
Natural Law Tim Carr2270.30−0.23
Independent John Dawson2080.28−1.38
Independent Julien Paul Droulers1870.25+0.25
Independent James Bernard1110.15+0.15
Total formal votes75,40496.18−1.04
Informal votes2,9943.82+1.04
Turnout 78,39896.75+0.42
Two-party-preferred result
Liberal John Howard 45,12860.13+6.95
Labor Wendy Mahon29,91839.87−6.95
Liberal hold Swing +6.95

Berowra

This section is an excerpt from Electoral results for the Division of Berowra § 1996
1996 Australian federal election: Berowra
PartyCandidateVotes%±%
Liberal Philip Ruddock 45,31058.60+3.38
Labor Nola McCarroll16,66621.55−7.23
Democrats Simon Disney5,7517.44+7.44
Independent Mick Gallagher5,0346.51−7.99
Greens Christopher Connolly2,4533.17+3.17
Against Further Immigration Steve Martin van Wyk1,9642.54+2.54
Natural Law Bill Scally1430.18−1.31
Total formal votes77,32197.19−0.26
Informal votes2,2332.81+0.26
Turnout 79,55496.59+0.26
Two-party-preferred result
Liberal Philip Ruddock 52,52668.40+6.20
Labor Nola McCarroll24,26831.60−6.20
Liberal hold Swing +6.20

Blaxland

This section is an excerpt from Electoral results for the Division of Blaxland § 1996
1996 Australian federal election: Blaxland [1]
PartyCandidateVotes%±%
Labor Paul Keating 41,44458.71−10.69
Liberal Nick Korovin21,91631.05+6.80
Democrats Jeffrey Meikle2,4423.46+1.47
Against Further Immigration Michael Lavis1,9442.75+2.75
Call to Australia Melodie Rahme9361.33+0.17
Independent Peter Sayegh6950.98+0.98
Independent Eric Lawrence5260.75+0.75
Independent Marc Aussie-Stone2670.38+0.09
Nick Beams2440.35+0.35
Natural Law Peter Smith1760.25−0.29
Total formal votes70,59093.38−1.59
Informal votes5,0056.62+1.59
Turnout 75,59596.06+0.55
Two-party-preferred result
Labor Paul Keating 44,32862.98−9.12
Liberal Nick Korovin26,05637.02+9.12
Labor hold Swing −9.12

Bradfield

This section is an excerpt from Electoral results for the Division of Bradfield § 1996
1996 Australian federal election: Bradfield [1]
PartyCandidateVotes%±%
Liberal Brendan Nelson 48,26064.75−5.02
Labor Alex Kemeny11,77915.80−6.56
Democrats Ann Barry6,9089.27+2.99
Greens Richard Wright2,5773.46+3.46
Against Further Immigration Len Watkins2,5713.45+3.45
Call to Australia Margaret Ratcliffe1,3071.75+1.75
Independent Patrick Gallagher9181.23+1.23
Natural Law Mark Toomey2160.29−1.30
Total formal votes74,53697.07−0.38
Informal votes2,2522.93+0.38
Turnout 76,78896.45+0.20
Two-party-preferred result
Liberal Brendan Nelson 55,98675.77+2.72
Labor Alex Kemeny17,90824.23−2.72
Liberal hold Swing −2.72

Calare

This section is an excerpt from Electoral results for the Division of Calare § 1996
1996 Australian federal election: Calare [1] [4]
PartyCandidateVotes%±%
Independent Peter Andren 21,70829.37+29.37
Labor Rob Allen21,40728.96−22.04
National Trevor Toole15,37120.79−5.22
Liberal Ray Fardell11,63115.73−2.79
Call to Australia Bruce McLean1,4591.97+1.97
Greens Sharon Mullin1,3121.77+1.77
Democrats Peter Baker8591.16+1.16
Natural Law Richard Nolan1720.23+0.23
Total formal votes73,91997.77−0.40
Informal votes1,6872.23+0.40
Turnout 75,60696.82−0.11
Notional two-party-preferred count
National Trevor Toole38,80052.91+6.97
Labor Rob Allen34,53847.09−6.97
Two-candidate-preferred result
Independent Peter Andren 46,66663.32+63.32
National Trevor Toole27,03736.68−9.22
Independent gain from Labor Swing N/A

Charlton

This section is an excerpt from Electoral results for the Division of Charlton § 1996
1996 Australian federal election: Charlton
PartyCandidateVotes%±%
Labor Bob Brown 38,66550.00−10.91
Liberal Peter Craig25,88433.47+6.64
Democrats Lyn Godfrey6,4948.40+2.98
Greens Bernadette Brugman3,8635.00+5.00
Against Further Immigration Ron Franks2,4283.14+3.14
Total formal votes77,33496.55−0.22
Informal votes2,7673.45+0.22
Turnout 80,10197.34+0.11
Two-party-preferred result
Labor Bob Brown 45,64659.32−7.78
Liberal Peter Craig31,29840.68+7.78
Labor hold Swing −7.78

Chifley

This section is an excerpt from Electoral results for the Division of Chifley § 1996
1996 Australian federal election: Chifley
PartyCandidateVotes%±%
Labor Roger Price 42,80457.95−10.11
Liberal Jenny Green19,82826.85+6.14
Democrats Alec Fisher6,6829.05+9.05
Call to Australia Shirley Grigg2,0332.75+2.75
Independent Andrew Owen1,8582.52+2.52
Natural Law Louise Hargreaves6530.88+0.88
Total formal votes73,85894.74−0.50
Informal votes4,0985.26+0.50
Turnout 77,95696.04+0.63
Two-party-preferred result
Labor Roger Price 47,51364.54−8.04
Liberal Jenny Green26,10935.46+8.04
Labor hold Swing −8.04

Cook

This section is an excerpt from Electoral results for the Division of Cook § 1996
1996 Australian federal election: Cook
PartyCandidateVotes%±%
Liberal Stephen Mutch 41,60155.10+5.52
Labor Mark McGrath23,70431.40−9.07
Democrats Terri Richardson6,1308.12+5.12
Reclaim Australia Janey Woodger2,9883.96+3.96
Independent James Ian McDonald1,0781.43+1.43
Total formal votes75,50197.52+0.01
Informal votes1,9222.48−0.01
Turnout 77,42396.77−0.02
Two-party-preferred result
Liberal Stephen Mutch 46,79162.28+8.81
Labor Mark McGrath28,34337.72−8.81
Liberal hold Swing +8.81

Cowper

This section is an excerpt from Electoral results for the Division of Cowper § 1996
1996 Australian federal election: Cowper
PartyCandidateVotes%±%
National Garry Nehl 40,82556.30+8.24
Labor Paul Sekfy23,19531.98−7.12
Greens Jillian Cranny4,5256.24+1.56
Democrats Allan Quartly3,9745.48+1.89
Total formal votes72,51997.70−0.13
Informal votes1,7092.30+0.13
Turnout 74,22896.19+0.37
Two-party-preferred result
National Garry Nehl 44,46561.56+7.50
Labor Paul Sekfy27,76638.44−7.50
National hold Swing +7.50

Cunningham

This section is an excerpt from Electoral results for the Division of Cunningham § 1996
1996 Australian federal election: Cunningham [1]
PartyCandidateVotes%±%
Labor Stephen Martin 37,26752.59−6.00
Liberal Philip Williams21,12429.81+3.45
Greens Will Douglas4,1395.84+1.13
Democrats Mark Chilton3,5354.99+0.86
Call to Australia Robert O'Neill1,8632.63+0.98
Margaret Perrott1,6752.36+2.36
Independent Paul Wilcock9391.33+1.33
Natural Law Fred Misdom3170.45−0.28
Total formal votes70,85996.39−0.27
Informal votes2,6513.61+0.27
Turnout 73,51096.53+0.16
Two-party-preferred result
Labor Stephen Martin 44,30262.91−5.00
Liberal Philip Williams26,12237.09+5.00
Labor hold Swing −5.00

Dobell

This section is an excerpt from Electoral results for the Division of Dobell § 1996
1996 Australian federal election: Dobell
PartyCandidateVotes%±%
Labor Michael Lee 32,22143.86−9.55
Liberal Doug Eaton31,81743.31+3.17
Democrats True Martin5,2237.11+3.76
Against Further Immigration Jeremy Pritchard2,1462.92+2.92
Call to Australia Graham Freemantle1,3041.78+1.78
Independent Aldo Katalinic7511.02+1.02
Total formal votes73,46297.06−0.87
Informal votes2,2242.94+0.87
Turnout 75,68696.74−0.27
Two-party-preferred result
Labor Michael Lee 36,67550.08−6.74
Liberal Doug Eaton36,55849.92+6.74
Labor hold Swing -6.74

Eden-Monaro

This section is an excerpt from Electoral results for the Division of Eden-Monaro § 1996
1996 Australian federal election: Eden-Monaro
PartyCandidateVotes%±%
Liberal Gary Nairn 33,15145.95+7.97
Labor Jim Snow 27,34737.90−9.30
Independent Robyn Loydell4,3205.99+5.99
Democrats Nora Endean2,5923.59+3.59
Greens Robin Tennant-Wood2,5483.53+3.53
Against Further Immigration Irene Brown1,3741.90+1.90
Call to Australia David Howes6150.85+0.85
Natural Law Peter Fraser2000.28−0.39
Total formal votes72,14797.01−0.53
Informal votes2,2232.99+0.53
Turnout 74,37095.97+0.33
Two-party-preferred result
Liberal Gary Nairn 39,31854.76+9.03
Labor Jim Snow 32,48745.24−9.03
Liberal gain from Labor Swing +9.03

Farrer

This section is an excerpt from Electoral results for the Division of Farrer § 1996
1996 Australian federal election: Farrer [1]
PartyCandidateVotes%±%
National Tim Fischer 47,23166.34+0.90
Labor Lynda Summers17,56324.67−5.06
Democrats John Clancy3,0434.27−0.56
Independent Peter Whitfield1,3371.88+1.88
Call to Australia John Everingham1,0471.47+1.47
Independent Luke Downing9791.38+1.38
Total formal votes71,20096.59−0.63
Informal votes2,5173.41+0.63
Turnout 73,71796.02−0.19
Two-party-preferred result
National Tim Fischer 50,61171.23+3.80
Labor Lynda Summers20,43928.77−3.80
National hold Swing +3.80

Fowler

This section is an excerpt from Electoral results for the Division of Fowler § 1996
1996 Australian federal election: Fowler
PartyCandidateVotes%±%
Labor Ted Grace 45,40861.06−7.75
Liberal Stephen Cenatiempo19,63026.40+5.48
Democrats Mark Stevens5,4767.36+7.36
Against Further Immigration Ken Malone3,1174.19+4.19
Natural Law Lucia van Oostveen7380.99−0.21
Total formal votes74,36991.93−2.87
Informal votes6,5318.07+2.87
Turnout 80,90095.86+0.90
Two-party-preferred result
Labor Ted Grace 50,64868.27−3.73
Liberal Stephen Cenatiempo23,54431.73+3.73
Labor hold Swing -3.73

Gilmore

This section is an excerpt from Electoral results for the Division of Gilmore § 1996
1996 Australian federal election: Gilmore
PartyCandidateVotes%±%
Liberal Joanna Gash 36,26150.51+8.76
Labor Peter Knott 27,50338.31−4.38
Democrats Joanne McGrath3,4494.80+1.35
Greens David Rothschild2,0392.84−1.88
Independent Tom Dell1,1951.66+1.66
Call to Australia Charles Chappell1,1171.56+1.56
Natural Law Rosemary Keighley2200.31+0.08
Total formal votes71,78497.65−0.18
Informal votes1,7302.35+0.18
Turnout 73,51497.07+0.05
Two-party-preferred result
Liberal Joanna Gash 40,24356.24+6.69
Labor Peter Knott 31,31743.76−6.69
Liberal gain from Labor Swing +6.69

Grayndler

This section is an excerpt from Electoral results for the Division of Grayndler § 1996
1996 Australian federal election: Grayndler [1]
PartyCandidateVotes%±%
Labor Anthony Albanese 37,62350.48−12.57
Liberal Morris Mansour17,58423.59+0.42
No Aircraft Noise Kevin Butler10,14213.61+13.61
Democrats David Mendelssohn3,7154.98+2.20
Greens Jenny Ryde3,4194.59−1.45
Call to Australia Alex Sharah7661.03+0.16
Independent Kate Butler7511.01+1.01
Natural Law Tom Haynes3210.43−0.24
Ron Poulsen2080.28+0.28
Total formal votes74,52995.24−0.86
Informal votes4,2865.44+0.86
Turnout 78,81595.24+1.54
Two-party-preferred result
Labor Anthony Albanese 48,91066.38−6.43
Liberal Morris Mansour24,77633.62+6.43
Labor hold Swing -6.43

Greenway

This section is an excerpt from Electoral results for the Division of Greenway § 1996
1996 Australian federal election: Greenway
PartyCandidateVotes%±%
Labor Frank Mossfield 32,29743.69−15.14
Liberal Vicki Burakowski28,12238.04+5.89
Democrats Bill Clancy6,1288.29+3.69
Against Further Immigration John Bates3,3694.56+4.56
Call to Australia Bob Bawden2,4083.26+0.27
Natural Law J.S. Ryder1,6022.17+0.73
Total formal votes73,92694.70−1.55
Informal votes4,1385.30+1.55
Turnout 78,06496.20−0.08
Two-party-preferred result
Labor Frank Mossfield 39,29953.39−10.03
Liberal Vicki Burakowski34,30546.61+10.03
Labor hold Swing -10.03

Gwydir

This section is an excerpt from Electoral results for the Division of Gwydir § 1996
1996 Australian federal election: Gwydir
PartyCandidateVotes%±%
National John Anderson 43,38562.32+5.19
Labor John Curley19,68028.27−9.28
Democrats Anne Graham3,6345.22+5.22
Independent Jim Perrett2,9144.19+4.19
Total formal votes69,61397.46+0.17
Informal votes1,8172.54−0.17
Turnout 71,43096.72+0.67
Two-party-preferred result
National John Anderson 47,55268.51+8.24
Labor John Curley21,85631.49−8.24
National hold Swing +8.24

Hughes

This section is an excerpt from Electoral results for the Division of Hughes § 1996
1996 Australian federal election: Hughes
PartyCandidateVotes%±%
Liberal Danna Vale 38,21148.98+10.74
Labor Robert Tickner 29,69038.05−13.79
Democrats Robert Koppelhuber4,5345.81+1.86
Greens Steve Allen2,5173.23+3.23
Call to Australia Christopher Derrick1,5712.01−0.37
Independent Martha Halliday1,4981.92+1.92
Total formal votes78,02197.27−0.12
Informal votes2,1922.73+0.12
Turnout 80,21397.47+0.29
Two-party-preferred result
Liberal Danna Vale 42,66954.89+11.31
Labor Robert Tickner 35,07245.11−11.31
Liberal gain from Labor Swing +11.31

Hume

This section is an excerpt from Electoral results for the Division of Hume § 1996
1996 Australian federal election: Hume
PartyCandidateVotes%±%
National John Sharp 40,92157.04+23.44
Labor Tony Hewson24,94334.77−7.02
Democrats Dave Cox4,0015.58+3.02
Greens Kevin Watchirs1,8762.61+2.61
Total formal votes71,74197.40−0.48
Informal votes1,9122.60+0.48
Turnout 73,65396.94+0.00
Two-party-preferred result
National John Sharp 44,17461.77+8.07
Labor Tony Hewson27,34538.23−8.07
National hold Swing +8.07

Hunter

This section is an excerpt from Electoral results for the Division of Hunter § 1996
1996 Australian federal election: Hunter
PartyCandidateVotes%±%
Labor Joel Fitzgibbon 36,67450.74−9.85
National Michael Johnsen 26,76737.04+19.64
Democrats Rod Bennison3,6725.08+5.08
Greens Jenny Vaughan3,0004.15+4.15
Independent Bernard Burke2,1602.99+2.99
Total formal votes72,27397.34−0.30
Informal votes1,9762.66+0.30
Turnout 74,24997.05+0.52
Two-party-preferred result
Labor Joel Fitzgibbon 41,00356.97−6.95
National Michael Johnsen 30,97643.03+6.95
Labor hold Swing -6.95

Kingsford Smith

This section is an excerpt from Electoral results for the Division of Kingsford Smith § 1996
1996 Australian federal election: Kingsford-Smith [1]
PartyCandidateVotes%±%
Labor Laurie Brereton 37,09851.58−7.58
Liberal John Xenos25,19035.02+3.25
Democrats Christopher Brieger5,5237.68+4.09
Greens Jeremy Oxley3,1034.31+0.21
Natural Law Suzi Haynes4840.67+0.10
Ted Marshall2780.39+0.39
Yabu Bilyana2540.35+0.35
Total formal votes71,93094.95−0.70
Informal votes3,8255.05+0.70
Turnout 75,75595.00+0.07
Two-party-preferred result
Labor Laurie Brereton 43,02860.15−5.09
Liberal John Xenos28,51139.85+5.09
Labor hold Swing -5.09

Lindsay

This section is an excerpt from Electoral results for the Division of Lindsay § 1996
1996 Australian federal election: Lindsay
PartyCandidateVotes%±%
Liberal Jackie Kelly 31,81142.52+5.91
Labor Ross Free 30,16840.32−18.23
Democrats John Wilson4,9296.59+6.59
Greens Lesley Edwards3,2994.41+4.41
Against Further Immigration Terry Cooksley2,0412.73+2.73
Call to Australia Brian Grigg1,6142.16−2.68
Independent Stephen Davidson9561.28+1.28
Total formal votes74,81896.42−0.45
Informal votes2,7783.58+0.45
Turnout 77,59696.12−0.52
Two-party-preferred result
Liberal Jackie Kelly 38,44251.58+11.80
Labor Ross Free 36,08848.42−11.80
Liberal gain from Labor Swing +11.80

Lowe

This section is an excerpt from Electoral results for the Division of Lowe § 1996
1996 Australian federal election: Lowe [1]
PartyCandidateVotes%±%
Liberal Paul Zammit 33,96646.68+5.12
Labor Mary Easson 28,44739.10−8.41
Democrats Noel Plumb3,1434.32+2.81
Independent Peter Woods2,2793.13+0.72
No Aircraft Noise Michelle Calvert2,1372.94+2.94
Greens Doug Hine1,3671.88+1.88
Call to Australia Katie Wood7821.07+0.40
Independent Dave Allen2710.37+0.37
Natural Law Bob Hughes2040.28+0.07
Max Lane1670.23+0.23
Total formal votes72,76394.77−0.85
Informal votes4,0165.23+0.85
Turnout 76,77996.46+0.64
Two-party-preferred result
Liberal Paul Zammit 37,97852.47+7.48
Labor Mary Easson 34,40547.53−7.48
Liberal gain from Labor Swing +7.48

Lyne

This section is an excerpt from Electoral results for the Division of Lyne § 1996
1996 Australian federal election: Lyne [1]
PartyCandidateVotes%±%
National Mark Vaile 44,05658.85+32.16
Labor John Weate21,71729.01−11.62
Democrats Rodger Riach3,3794.51+1.73
Against Further Immigration Marje Roswell3,2374.32+4.32
Greens Susie Russell2,4783.31+3.31
Total formal votes74,86797.49−0.44
Informal votes1,9272.51+0.44
Turnout 76,79496.82+0.33
Two-party-preferred result
National Mark Vaile 48,80165.44+11.20
Labor John Weate25,77634.56−11.20
National hold Swing +11.20

Macarthur

This section is an excerpt from Electoral results for the Division of Macarthur § 1996
1996 Australian federal election: Macarthur [1]
PartyCandidateVotes%±%
Liberal John Fahey 40,96353.38+8.82
Labor Noel Lowry24,57032.02−14.50
Democrats Peter Fraser3,7144.84+4.84
Independent Herb Bethune2,5633.34−1.98
Greens Vicki Kearney2,1322.78+2.78
Against Further Immigration Janet Watkins2,0902.72+2.72
Independent Colleen Street4350.57+0.57
Independent Stephen Agius2750.36+0.36
Total formal votes76,74296.48−0.64
Informal votes2,7993.52+0.64
Turnout 79,54196.73+0.60
Two-party-preferred result
Liberal John Fahey 46,37260.69+11.97
Labor Noel Lowry30,03439.31−11.97
Liberal gain from Labor Swing +11.97

Mackellar

This section is an excerpt from Electoral results for the Division of Mackellar § 1996
1996 Australian federal election: Mackellar [1]
PartyCandidateVotes%±%
Liberal Bronwyn Bishop 40,88654.66−1.95
Labor Ross McLoughlin14,59019.51−13.73
Democrats Vicki Dimond8,18810.95+3.87
Greens Chris Cairns3,2364.33+4.33
Against Further Immigration John Bridge2,9093.89+3.89
Independent Anne Ellis2,8483.81+3.81
Call to Australia Rick Bristow1,3691.83+0.10
Reclaim Australia Rodney Smith6310.84+0.84
Natural Law Stephen Doric1440.19−1.16
Total formal votes74,80196.71−0.29
Informal votes2,5473.29+0.29
Turnout 77,34896.47+0.69
Two-party-preferred result
Liberal Bronwyn Bishop 49,34166.53+5.37
Labor Ross McLoughlin24,82733.47−5.37
Liberal hold Swing +5.37

Macquarie

This section is an excerpt from Electoral results for the Division of Macquarie § 1996
1996 Australian federal election: Macquarie
PartyCandidateVotes%±%
Liberal Kerry Bartlett 35,19948.09+3.73
Labor Maggie Deahm 24,61433.63−8.85
Democrats Jon Rickard6,1278.37+1.72
Greens Carol Gaul2,7823.80+0.01
Against Further Immigration Warwick Tyler1,8062.47+2.47
Call to Australia Heather Kraus1,7532.40+2.40
Independent John McCall9061.24+1.24
Total formal votes73,18796.06−1.44
Informal votes3,0043.94+1.44
Turnout 76,19196.58+0.53
Two-party-preferred result
Liberal Kerry Bartlett 41,04556.36+6.48
Labor Maggie Deahm 31,78043.64−6.48
Liberal gain from Labor Swing +6.48

Mitchell

This section is an excerpt from Electoral results for the Division of Mitchell § 1996
1996 Australian federal election: Mitchell [1]
PartyCandidateVotes%±%
Liberal Alan Cadman 48,54167.43+2.54
Labor Erica Lewis13,79019.16−9.03
Democrats Colleen Krason5,9308.24+2.81
Against Further Immigration Tony Pettitt2,6883.73+3.73
Reclaim Australia John Hutchinson6990.97+0.97
Natural Law Penny Price3380.47+0.47
Total formal votes71,98697.02−0.67
Informal votes2,2142.98+0.67
Turnout 74,20097.13+0.29
Two-party-preferred result
Liberal Alan Cadman 53,29374.32+5.66
Labor Erica Lewis18,41025.68−5.66
Liberal hold Swing +5.66

New England

This section is an excerpt from Electoral results for the Division of New England § 1996
1996 Australian federal election: New England
PartyCandidateVotes%±%
National Ian Sinclair 42,53960.50+7.80
Labor Herman Beyersdorf17,47724.86−9.35
Democrats Allan Caswell6,2218.85+8.85
Independent Terry Larsen3,3334.74+4.74
Natural Law Frances Letters7431.06+1.06
Total formal votes70,31397.71−0.17
Informal votes1,6492.29+0.17
Turnout 71,96296.08−0.54
Two-party-preferred result
National Ian Sinclair 48,38169.18+8.98
Labor Herman Beyersdorf21,55130.82−8.98
National hold Swing +8.98

Newcastle

This section is an excerpt from Electoral results for the Division of Newcastle § 1996
1996 Australian federal election: Newcastle [1]
PartyCandidateVotes%±%
Labor Allan Morris 36,14650.14−6.53
Liberal Ivan Welsh 21,93830.43+2.93
Democrats Barry Boettcher7,1269.89+6.99
Greens Cathy Burgess6,2888.72+1.38
Kamala Emanuel5910.82+0.82
Total formal votes72,08997.16+0.11
Informal votes2,1052.84−0.11
Turnout 74,19496.77+0.31
Two-party-preferred result
Labor Allan Morris 43,80761.19−5.69
Liberal Ivan Welsh 27,78038.81+5.69
Labor hold Swing -5.69

North Sydney

This section is an excerpt from Electoral results for the Division of North Sydney § 1996
1996 Australian federal election: North Sydney [1]
PartyCandidateVotes%±%
Liberal Joe Hockey 45,63457.29+11.35
Labor Julie Owens 20,13225.27+8.28
Democrats Linda Wade7,9479.98+9.98
Greens George Carter3,0393.81+3.81
Independent Richard Tanner2,9083.65+3.65
Total formal votes79,66097.45−0.51
Informal votes2,0812.55+0.51
Turnout 81,74195.14+0.57
Two-party-preferred result
Liberal Joe Hockey 51,85165.56+6.6
Labor Julie Owens 27,24434.44−6.6
Liberal gain from Independent Swing +6.6

The sitting member Ted Mack (Independent) did not contest the election. [1]

Page

This section is an excerpt from Electoral results for the Division of Page § 1996
1996 Australian federal election: Page
PartyCandidateVotes%±%
Labor Harry Woods 28,97238.04−3.79
National Ian Causley 27,92736.66+7.84
Liberal Anne Hunter12,13215.93−1.38
Greens Sue Higginson 2,9713.90+3.90
Democrats James Page2,5143.30+1.96
Call to Australia Trevor Arthur1,1191.47+1.47
Greens Al Oshlack5350.70−1.70
Total formal votes76,17098.05+0.11
Informal votes1,5131.95−0.11
Turnout 77,68396.59+0.31
Two-party-preferred result
National Ian Causley 41,19054.31+4.44
Labor Harry Woods 34,65745.69−4.44
National gain from Labor Swing +4.44

Parkes

This section is an excerpt from Electoral results for the Division of Parkes § 1996
1996 Australian federal election: Parkes
PartyCandidateVotes%±%
National Michael Cobb 38,26451.21+3.71
Labor Barry Brebner28,53038.18−7.33
Democrats Ken Graham1,9652.63−0.48
Independent Edna Cook1,7582.35+2.35
Women's Party Dianne Decker1,7082.29+2.29
Against Further Immigration Vivian Desmond1,5282.08+2.05
Natural Law David McLennan9641.29+0.33
Total formal votes74,71797.12−0.41
Informal votes2,2182.88+0.41
Turnout 76,93595.86+0.30
Two-party-preferred result
National Michael Cobb 42,10056.50+5.96
Labor Barry Brebner32,41843.50−5.96
National hold Swing +5.96

Parramatta

This section is an excerpt from Electoral results for the Division of Parramatta § 1996
1996 Australian federal election: Parramatta [1]
PartyCandidateVotes%±%
Liberal Ross Cameron 34,31047.65+5.45
Labor Paul Elliott 28,39039.43−9.81
Democrats Eduardo Avila3,9125.43+2.13
Against Further Immigration Peter Krumins2,0052.78+2.78
Independent Heidi Scott1,1031.53+1.53
Call to Australia Dee Jonsson1,0661.48+0.04
Natural Law John Cogger7551.08+0.48
Independent Joseph Chidiac4400.61+0.61
Total formal votes72,00196.14−0.95
Informal votes2,8873.86+0.95
Turnout 74,88896.39+0.32
Two-party-preferred result
Liberal Ross Cameron 38,67153.87+7.11
Labor Paul Elliott 33,11546.13−7.11
Liberal gain from Labor Swing +7.11

Paterson

This section is an excerpt from Electoral results for the Division of Paterson § 1996
1996 Australian federal election: Paterson [1]
PartyCandidateVotes%±%
Liberal Bob Baldwin 34,11345.67+10.40
Labor Bob Horne 32,37843.35−4.16
Democrats Bob Symington3,7274.99+2.98
Greens Jan Davis2,6473.54+0.69
Call to Australia Trevor Carrick1,8292.45+2.45
Total formal votes74,69497.74+0.11
Informal votes1,7302.26−0.11
Turnout 76,42497.36+0.36
Two-party-preferred result
Liberal Bob Baldwin 37,51950.43+3.73
Labor Bob Horne 36,88549.57−3.73
Liberal gain from Labor Swing +3.73

Prospect

This section is an excerpt from Electoral results for the Division of Prospect § 1996
1996 Australian federal election: Prospect
PartyCandidateVotes%±%
Labor Janice Crosio 39,31856.68−8.69
Liberal Ron Cameron22,18231.97+5.86
Democrats Manny Poularas6,95110.02+5.50
Natural Law Linda Cogger9221.33+0.74
Total formal votes69,37394.23−0.15
Informal votes4,2485.77+0.15
Turnout 73,62196.28+0.14
Two-party-preferred result
Labor Janice Crosio 44,23663.91−5.13
Liberal Ron Cameron24,98436.09+5.13
Labor hold Swing -5.13

Reid

This section is an excerpt from Electoral results for the Division of Reid § 1996
1996 Australian federal election: Reid
PartyCandidateVotes%±%
Labor Laurie Ferguson 40,91057.15−7.55
Liberal Lynne McDowell24,72034.53+6.63
Democrats Alfie Giuliano4,9776.95+6.95
Natural Law Catherine Doric9751.36+0.43
Total formal votes71,58294.65−0.48
Informal votes4,0475.35+0.48
Turnout 75,62996.31+0.77
Two-party-preferred result
Labor Laurie Ferguson 43,83761.38−7.42
Liberal Lynne McDowell27,58038.62+7.42
Labor hold Swing -7.42

Richmond

This section is an excerpt from Electoral results for the Division of Richmond § 1996
1996 Australian federal election: Richmond
PartyCandidateVotes%±%
National Larry Anthony 27,26235.43+9.70
Labor Neville Newell 26,65334.64−9.57
Liberal Keith Johnson14,18018.43−2.68
Democrats Mindy Thorpe4,1715.42+3.19
Greens Annette Coyle4,0435.25+0.65
Greens Robert Corowa6380.83+0.83
Total formal votes76,94797.91+0.98
Informal votes1,6402.09−0.98
Turnout 78,58796.01+0.37
Two-party-preferred result
National Larry Anthony 43,44856.75+8.53
Labor Neville Newell 33,10843.25−8.53
National gain from Labor Swing +8.53

Riverina

This section is an excerpt from Electoral results for the Division of Riverina § 1996
1996 Australian federal election: Riverina
PartyCandidateVotes%±%
National Noel Hicks 48,99465.97+27.51
Labor Rob Colligan19,45426.20−7.40
Democrats John Collins2,9774.01+4.01
Independent Alistair Jones2,8373.82+3.82
Total formal votes74,26296.77−0.89
Informal votes2,4763.23+0.89
Turnout 76,73897.02+0.89
Two-party-preferred result
National Noel Hicks 52,61471.01+8.08
Labor Rob Colligan21,48428.99−8.08
National hold Swing +8.08

Robertson

This section is an excerpt from Electoral results for the Division of Robertson § 1996
1996 Australian federal election: Robertson
PartyCandidateVotes%±%
Liberal Jim Lloyd 33,82546.79+5.49
Labor Frank Walker 28,41239.30−10.85
Democrats Andrew Penfold5,2717.29+2.45
Against Further Immigration Roy Whaite2,4723.42+3.42
Greens Bryan Ellis1,8872.61−0.64
Independent Valiant Leung4220.58+0.58
Total formal votes72,28997.18−0.58
Informal votes2,0952.82+0.58
Turnout 74,38497.08+0.82
Two-party-preferred result
Liberal Jim Lloyd 38,56353.56+9.12
Labor Frank Walker 33,43046.44−9.12
Liberal gain from Labor Swing +9.12

Shortland

This section is an excerpt from Electoral results for the Division of Shortland § 1996
1996 Australian federal election: Shortland [1]
PartyCandidateVotes%±%
Labor Peter Morris 36,60350.88−10.96
Liberal David Parker24,81234.49+5.62
Democrats Kaye Westbury4,9776.92+1.36
Greens Ian McKenzie3,1024.31+4.31
Independent Richard Hill1,8982.64+2.65
Terry Cook5470.76−0.30
Total formal votes71,93997.20−0.25
Informal votes2,0752.80+0.25
Turnout 74,01497.27+0.66
Two-party-preferred result
Labor Peter Morris 41,66058.15−9.18
Liberal David Parker29,98241.85+9.18
Labor hold Swing -9.18

Sydney

This section is an excerpt from Electoral results for the Division of Sydney § 1996
1996 Australian federal election: Sydney
PartyCandidateVotes%±%
Labor Peter Baldwin 35,78848.38−10.10
Liberal Peter Fussell20,43027.62+1.63
Democrats Paul Nederlof6,4718.75+4.81
No Aircraft Noise Wendy Bacon 5,0426.82+6.82
Greens Sue Stock4,2855.79−1.95
Karen Fletcher5840.79+0.79
Independent Peter Bushby5370.73+0.73
Call to Australia Janne Peterson4830.65+0.65
Natural Law Michael Lippmann2420.33−0.57
Donald O'Halloran1120.15−0.11
Total formal votes73,97495.48−1.28
Informal votes3,5024.52+1.28
Turnout 77,47692.85+0.40
Two-party-preferred result
Labor Peter Baldwin 46,70363.80−5.67
Liberal Peter Fussell26,49536.20+5.67
Labor hold Swing -5.67

Throsby

This section is an excerpt from Electoral results for the Division of Throsby § 1996
1996 Australian federal election: Throsby
PartyCandidateVotes%±%
Labor Colin Hollis 42,96360.83+2.40
Liberal Albert Galea15,32621.70+4.83
Democrats Elizabeth Fisher5,9908.48+5.16
Greens Les Robinson3,6295.14+0.94
Call to Australia Brian Hughes2,7163.85+1.69
Total formal votes70,62496.12+0.34
Informal votes2,8483.88−0.34
Turnout 73,47297.10+0.58
Two-party-preferred result
Labor Colin Hollis 48,96669.62−4.41
Liberal Albert Galea21,36930.38+4.41
Labor hold Swing -4.41

Warringah

This section is an excerpt from Electoral results for the Division of Warringah § 1996
1996 Australian federal election: Warringah
PartyCandidateVotes%±%
Liberal Tony Abbott 42,21757.72+1.61
Labor Julie Heraghty19,48826.64−7.16
Democrats Wallace Logue4,9196.72+2.46
Greens Karen Picken3,5514.85+4.85
Against Further Immigration Ian Weatherlake2,7013.69+3.69
Natural Law Beth Eager2710.37−1.69
Total formal votes73,14797.11−0.51
Informal votes2,1782.89+0.51
Turnout 75,32596.11+0.64
Two-party-preferred result
Liberal Tony Abbott 47,47665.32+5.06
Labor Julie Heraghty25,20834.68−5.06
Liberal hold Swing +5.06

Watson

This section is an excerpt from Electoral results for the Division of Watson § 1996
1996 Australian federal election: Watson
PartyCandidateVotes%±%
Labor Leo McLeay 39,32955.11−4.45
Liberal Bruce Larter23,84033.41+2.94
Democrats Amelia Newman5,6257.88+4.37
Call to Australia Todd Rahme2,5703.60+3.60
Total formal votes71,36494.88−0.06
Informal votes3,8515.12+0.06
Turnout 75,21596.05+0.58
Two-party-preferred result
Labor Leo McLeay 43,91361.68−3.16
Liberal Bruce Larter27,28138.32+3.16
Labor hold Swing -3.16

Wentworth

This section is an excerpt from Electoral results for the Division of Wentworth § 1996
1996 Australian federal election: Wentworth
PartyCandidateVotes%±%
Liberal Andrew Thomson 39,01452.01−0.66
Labor Paul Pearce 23,85631.80−5.01
Democrats Di Happ6,5068.67+5.89
Greens Fiona McCrossin4,4685.96+5.96
Independent Rodney Marks4680.62+0.62
Independent David Synnott3580.48+0.48
Natural Law Paddy Engelen2250.30+0.30
John Hooper1220.16+0.16
Total formal votes75,01796.55−0.55
Informal votes2,6843.45+0.55
Turnout 77,70195.41+0.86
Two-party-preferred result
Liberal Andrew Thomson 43,12257.83+2.37
Labor Paul Pearce 31,44542.17−2.37
Liberal hold Swing +2.37

Werriwa

This section is an excerpt from Electoral results for the Division of Werriwa § 1996
1996 Australian federal election: Werriwa
PartyCandidateVotes%±%
Labor Mark Latham 33,80047.90−13.51
Liberal Andrew Thorn23,79033.71+3.22
Democrats Emanuela Lang4,5416.44+1.47
Against Further Immigration Vince Townsend3,9735.63+5.63
Independent James Whitehall2,7223.86+3.86
Reclaim Australia Edwin Woodger1,1691.66+1.66
Greg Josling5710.81+0.81
Total formal votes70,56694.91−1.09
Informal votes3,7825.09+1.09
Turnout 74,34895.82+0.52
Two-party-preferred result
Labor Mark Latham 39,48956.21−9.56
Liberal Andrew Thorn30,76143.79+9.56
Labor hold Swing −9.56

See also

Related Research Articles

This is a list of electoral division results for the Australian 1954 federal election.

This is a list of electoral division results for the Australian 1946 federal election.

This is a list of electoral division results for the Australian 1949 federal election.

This is a list of electoral division results for the Australian 1951 federal election.

This is a list of electoral division results for the Australian 1955 federal election.

This is a list of electoral division results for the Australian 1958 federal election.

This is a list of electoral division results for the Australian 1961 federal election.

This is a list of electoral division results for the Australian 1966 federal election.

This is a list of electoral division results for the Australian 1969 federal election.

This is a list of electoral division results for the Australian 1972 federal election.

This is a list of electoral division results for the Australian 1977 federal election.

This is a list of electoral division results for the Australian 1980 federal election.

This is a list of electoral division results for the Australian 1983 federal election.

<span class="mw-page-title-main">Results of the 2007 Australian federal election in New South Wales</span>

This is a list of electoral division results in the Australian 2007 federal election for the state of New South Wales.
<span class="mw-page-title-main">Results of the 2001 Australian federal election in New South Wales</span>

This is a list of electoral division results for the Australian 2001 federal election in the state of New South Wales.

<span class="mw-page-title-main">Results of the 1984 Australian federal election in New South Wales</span>

This is a list of electoral division results for the Australian 1984 federal election in the state of New South Wales.

<span class="mw-page-title-main">Results of the 1987 Australian federal election in New South Wales</span>

This is a list of electoral division results for the Australian 1987 federal election in the state of New South Wales.

<span class="mw-page-title-main">Results of the 1990 Australian federal election in New South Wales</span>

This is a list of electoral division results for the Australian 1990 federal election in the state of New South Wales.
<span class="mw-page-title-main">Results of the 1993 Australian federal election in New South Wales</span>

This is a list of electoral division results for the Australian 1993 federal election in the state of New South Wales.

<span class="mw-page-title-main">Results of the 1998 Australian federal election in New South Wales</span>

This is a list of electoral division results for the Australian 1998 federal election in the state of New South Wales.

References

  1. 1 2 3 4 5 6 7 8 9 10 11 12 13 14 15 16 17 18 19 20 21 "1996 House of Representatives: New South Wales". Psephos Adam Carr's Election Archive. Retrieved 11 June 2022.
  2. Newman, G; Kopras, A (4 November 1996). "Federal Elections 1996" (PDF). Background Paper 6 1996-97. Parliamentary Research Service. ISSN   1037-2938 . Retrieved 10 January 2022.
  3. "1996 House of Representatives". Psephos Adam Carr's Election Archive. Retrieved 10 June 2022.
  4. "1996 Two Party Preferred Statistics V1_9.XLS". 1993, 1996 and 1998 election statistics. Australian Electoral Commission. Retrieved 13 June 2022.