| ||||||||||||||||||||||||||||||||||
All 37 Victorian seats in the Australian House of Representatives and 6 seats in the Australian Senate | ||||||||||||||||||||||||||||||||||
---|---|---|---|---|---|---|---|---|---|---|---|---|---|---|---|---|---|---|---|---|---|---|---|---|---|---|---|---|---|---|---|---|---|---|
| ||||||||||||||||||||||||||||||||||
Results by division for the House of Representatives, shaded by winning party's margin of victory. |
1998 Australian federal election |
---|
National results |
State and territory results |
This is a list of electoral division results for the Australian 1998 federal election in the state of Victoria. [1] [2]
Party | Votes | % | Swing | Seats | Change | ||
---|---|---|---|---|---|---|---|
Liberal | 1,053,990 | 37.08 | -2.82 | 16 | 3 | ||
National | 77,385 | 2.72 | -1.90 | 2 | |||
Liberal/National Coalition | 1,131,375 | 39.80 | -4.72 | 18 | 3 | ||
Labor | 1,261,289 | 44.37 | 1.45 | 19 | 3 | ||
Democrats | 171,091 | 6.02 | -1.33 | ||||
One Nation | 105,798 | 3.72 | 3.72 | ||||
Greens | 59,383 | 2.09 | 0.19 | ||||
Independent | 38,232 | 1.34 | -0.29 | ||||
Unity | 29,265 | 1.03 | 1.03 | ||||
Shooters | 12,675 | 0.45 | 0.45 | ||||
Natural Law | 9,654 | 0.34 | 0.00 | ||||
Australia First | 6,455 | 0.23 | 0.00 | ||||
Progressive Labour | 4,991 | 0.18 | 0.00 | ||||
Reform | 4,220 | 0.15 | 0.00 | ||||
Christian Democrats | 3,793 | 0.13 | 0.00 | ||||
Citizens Electoral Council | 2,914 | 0.10 | 0.00 | ||||
Abolish Child Support | 945 | 0.03 | 0.00 | ||||
Democratic Socialist | 425 | 0.01 | 0.00 | ||||
Republican | 176 | 0.01 | 0.00 | ||||
Total | 2,842,681 | 37 | |||||
Two-party-preferred vote | |||||||
Labor | 1,521,560 | 53.53 | 3.22 | 19 | 3 | ||
Liberal/National Coalition | 1,321,121 | 46.47 | -3.22 | 18 | 3 | ||
Invalid/blank votes | 103,524 | 3.5 | |||||
Turnout | 2,946,205 | 95.6 | |||||
Registered voters | 3,081,632 | ||||||
Source: Federal Elections 1998 |
Party | Candidate | Votes | % | ±% | |
---|---|---|---|---|---|
Liberal | Peter Nugent | 38,645 | 48.49 | −3.10 | |
Labor | Peter Lockwood | 30,689 | 38.51 | −0.18 | |
Democrats | Darrell Stosegan | 6,000 | 7.53 | −1.38 | |
One Nation | Ian Cameron | 2,306 | 2.89 | +2.89 | |
Unity | Guosheng Chen | 1,371 | 1.72 | +1.72 | |
Reform | Paul Rigoni | 685 | 0.86 | +0.86 | |
Total formal votes | 79,696 | 97.17 | −0.43 | ||
Informal votes | 2,324 | 2.83 | +0.43 | ||
Turnout | 82,020 | 96.64 | −0.38 | ||
Two-party-preferred result | |||||
Liberal | Peter Nugent | 43,227 | 54.24 | −1.35 | |
Labor | Peter Lockwood | 36,469 | 45.76 | +1.35 | |
Liberal hold | Swing | −1.35 |
Party | Candidate | Votes | % | ±% | |
---|---|---|---|---|---|
Liberal | Michael Ronaldson | 34,527 | 45.23 | −3.77 | |
Labor | Marg Card | 31,232 | 40.92 | −0.98 | |
One Nation | John Blanchard | 3,738 | 4.90 | +4.90 | |
Democrats | Peta Price | 2,824 | 3.70 | −0.52 | |
Shooters | John Wiley | 1,569 | 2.06 | +2.06 | |
Greens | Malcolm Campbell | 1,083 | 1.42 | +1.42 | |
Christian Democrats | Frank Colosimo | 840 | 1.10 | −1.24 | |
Independent | Ian Harrison | 188 | 0.25 | +0.25 | |
Unity | Margaret Taylor | 182 | 0.24 | +0.24 | |
Independent | Alex Graham | 147 | 0.19 | +0.19 | |
Total formal votes | 76,330 | 96.45 | −1.44 | ||
Informal votes | 2,809 | 3.55 | +1.44 | ||
Turnout | 79,139 | 96.73 | −0.09 | ||
Two-party-preferred result | |||||
Liberal | Michael Ronaldson | 40,280 | 52.77 | −0.90 | |
Labor | Marg Card | 36,050 | 47.23 | +0.90 | |
Liberal hold | Swing | −0.90 |
Party | Candidate | Votes | % | ±% | |
---|---|---|---|---|---|
Labor | Martin Ferguson | 53,034 | 65.84 | +7.01 | |
Liberal | Lauri Rowe | 16,290 | 20.22 | −1.01 | |
Democrats | Marc Nicholls | 4,038 | 5.01 | −1.01 | |
Greens | Helen Rosenbaum | 3,705 | 4.60 | +0.99 | |
Natural Law | Martin Richardson | 1,486 | 1.84 | −0.95 | |
Militant Socialist | Matt Wilson | 1,087 | 1.35 | +1.35 | |
Unity | Sami Mazloum | 659 | 0.82 | +0.82 | |
Citizens Electoral Council | Wayne Barwick | 254 | 0.32 | +0.32 | |
Total formal votes | 80,553 | 96.09 | +1.17 | ||
Informal votes | 3,280 | 3.91 | −1.17 | ||
Turnout | 83,833 | 94.48 | −0.75 | ||
Two-party-preferred result | |||||
Labor | Martin Ferguson | 61,569 | 76.43 | +5.12 | |
Liberal | Lauri Rowe | 18,984 | 23.57 | −5.12 | |
Labor hold | Swing | +5.12 |
Party | Candidate | Votes | % | ±% | |
---|---|---|---|---|---|
Labor | Steve Gibbons | 33,483 | 42.91 | +0.09 | |
Liberal | Max Turner | 28,004 | 35.89 | −8.86 | |
One Nation | Karel Zegers | 5,159 | 6.61 | +6.61 | |
Democrats | Alan Tilley | 3,533 | 4.53 | −1.11 | |
National | Scott Mitchell | 2,479 | 3.18 | +3.18 | |
Greens | David Rhys Jones | 2,080 | 2.67 | −0.60 | |
Reform | Alfred Thorpe | 1,108 | 1.42 | +1.42 | |
Independent | Peter Morley | 846 | 1.08 | +1.08 | |
Natural Law | Alan McDonald | 526 | 0.67 | +0.37 | |
Unity | Gayle Maddigan | 361 | 0.46 | +0.46 | |
Australia First | Peter Biggs | 332 | 0.43 | +0.43 | |
Citizens Electoral Council | Lyn Speirs | 126 | 0.16 | +0.16 | |
Total formal votes | 78,037 | 95.87 | −2.09 | ||
Informal votes | 3,366 | 4.13 | +2.09 | ||
Turnout | 81,403 | 97.01 | +0.08 | ||
Two-party-preferred result | |||||
Labor | Steve Gibbons | 41,726 | 53.47 | +4.35 | |
Liberal | Max Turner | 36,311 | 46.53 | −4.35 | |
Labor gain from Liberal | Swing | +4.35 |
Party | Candidate | Votes | % | ±% | |
---|---|---|---|---|---|
Labor | Alan Griffin | 38,165 | 48.66 | +2.84 | |
Liberal | Jim Wood | 30,257 | 38.58 | −7.05 | |
Democrats | Adam McBeth | 4,718 | 6.02 | −0.08 | |
One Nation | Laurence Lowe | 2,296 | 2.93 | +2.93 | |
Unity | Toan Huynh | 1,336 | 1.70 | +1.70 | |
Greens | Colin Smith | 1,195 | 1.52 | −0.49 | |
Abolish Child Support | Dikran Chabdjian | 253 | 0.32 | +0.32 | |
Natural Law | Michael Soos | 209 | 0.27 | −0.17 | |
Total formal votes | 78,429 | 96.31 | −0.72 | ||
Informal votes | 3,001 | 3.69 | +0.72 | ||
Turnout | 81,430 | 96.19 | −0.26 | ||
Two-party-preferred result | |||||
Labor | Alan Griffin | 44,485 | 56.72 | +5.96 | |
Liberal | Jim Wood | 33,944 | 43.28 | −5.96 | |
Labor hold | Swing | +5.96 |
Party | Candidate | Votes | % | ±% | |
---|---|---|---|---|---|
Labor | Neil O'Keefe | 36,516 | 50.00 | −0.95 | |
Liberal | Serge Petrovich | 26,317 | 36.03 | −2.41 | |
Democrats | Vaughan Williams | 4,365 | 5.98 | −3.64 | |
One Nation | Frank Preston | 3,319 | 4.54 | +4.54 | |
Greens | Paul Fyffe | 1,397 | 1.91 | +1.91 | |
Independent | Rod Hardy | 957 | 1.31 | +1.31 | |
Natural Law | Ngaire Mason | 163 | 0.22 | −0.78 | |
Total formal votes | 73,034 | 94.82 | −2.21 | ||
Informal votes | 3,988 | 5.18 | +2.21 | ||
Turnout | 77,022 | 95.98 | −0.23 | ||
Two-party-preferred result | |||||
Labor | Neil O'Keefe | 42,074 | 57.61 | +0.58 | |
Liberal | Serge Petrovich | 30,960 | 42.39 | −0.58 | |
Labor hold | Swing | +0.58 |
Party | Candidate | Votes | % | ±% | |
---|---|---|---|---|---|
Labor | Andrew Theophanous | 50,022 | 62.36 | +1.02 | |
Liberal | Trevor Blake | 21,111 | 26.32 | −2.52 | |
Democrats | Robert Livesay | 5,363 | 6.69 | −0.25 | |
Unity | Benal Keceli | 2,968 | 3.70 | +3.70 | |
Natural Law | Michael Harris | 755 | 0.94 | +0.21 | |
Total formal votes | 80,219 | 96.55 | +0.31 | ||
Informal votes | 2,864 | 3.45 | −0.31 | ||
Turnout | 83,083 | 95.15 | −0.48 | ||
Two-party-preferred result | |||||
Labor | Andrew Theophanous | 55,334 | 68.98 | +1.78 | |
Liberal | Trevor Blake | 24,885 | 31.02 | −1.78 | |
Labor hold | Swing | +1.78 |
Party | Candidate | Votes | % | ±% | |
---|---|---|---|---|---|
Liberal | Michael Wooldridge | 34,322 | 46.39 | −3.64 | |
Labor | Frank Armenio | 24,732 | 33.42 | −2.38 | |
Democrats | John McLaren | 5,481 | 7.41 | −2.53 | |
One Nation | Stephen Beck | 2,412 | 3.26 | +3.26 | |
Independent | John Mackellar | 2,067 | 2.79 | +2.79 | |
Greens | Chris James | 1,634 | 2.21 | −1.07 | |
Shooters | Judy Warwick | 1,070 | 1.45 | +1.45 | |
Christian Democrats | Basil Smidt | 917 | 1.24 | +1.24 | |
Natural Law | Robert Kendi | 557 | 0.75 | +0.75 | |
Unity | Gary Smart | 405 | 0.55 | +0.55 | |
Independent | Steve Raskovy | 396 | 0.54 | +0.54 | |
Total formal votes | 73,993 | 95.98 | −1.26 | ||
Informal votes | 3,098 | 4.02 | +1.26 | ||
Turnout | 77,091 | 96.11 | −0.55 | ||
Two-party-preferred result | |||||
Liberal | Michael Wooldridge | 40,598 | 54.87 | −1.78 | |
Labor | Frank Armenio | 33,395 | 45.13 | +1.78 | |
Liberal hold | Swing | −1.78 |
Party | Candidate | Votes | % | ±% | |
---|---|---|---|---|---|
Labor | Anna Burke | 33,275 | 42.38 | +1.99 | |
Liberal | Peter Vlahos | 32,771 | 41.74 | −5.39 | |
Democrats | Bernie Millane | 5,392 | 6.87 | −0.40 | |
Greens | Julian Guess | 2,431 | 3.10 | +0.44 | |
Unity | Ka-Sing Chua | 2,214 | 2.82 | +2.82 | |
One Nation | Douglas Hesse | 2,064 | 2.63 | +2.63 | |
Natural Law | Mark Toomey | 193 | 0.25 | −0.22 | |
Republican | Nicholas Fell | 176 | 0.22 | +0.22 | |
Total formal votes | 78,516 | 96.43 | −1.01 | ||
Informal votes | 2,910 | 3.57 | +1.01 | ||
Turnout | 81,426 | 95.68 | −0.51 | ||
Two-party-preferred result | |||||
Labor | Anna Burke | 40,887 | 52.07 | +4.67 | |
Liberal | Peter Vlahos | 37,629 | 47.93 | −4.67 | |
Labor gain from Liberal | Swing | +4.67 |
Party | Candidate | Votes | % | ±% | |
---|---|---|---|---|---|
Liberal | Stewart McArthur | 34,336 | 46.02 | −6.64 | |
Labor | Michael Bjork-Billings | 26,923 | 36.08 | +0.22 | |
Democrats | Jeffrey Paull | 4,765 | 6.39 | −5.10 | |
One Nation | Duncan Maclean | 4,140 | 5.55 | +5.55 | |
Greens | Adrian Whitehead | 2,292 | 3.07 | +3.07 | |
Independent | Simon Arundell | 1,634 | 2.19 | +2.19 | |
Unity | Robert Harwood | 525 | 0.70 | +0.70 | |
Total formal votes | 74,615 | 97.45 | −0.33 | ||
Informal votes | 1,949 | 2.55 | +0.33 | ||
Turnout | 76,564 | 95.79 | −0.90 | ||
Two-party-preferred result | |||||
Liberal | Stewart McArthur | 40,665 | 54.50 | −3.19 | |
Labor | Michael Bjork-Billings | 33,950 | 45.50 | +3.19 | |
Liberal hold | Swing | −3.19 |
Party | Candidate | Votes | % | ±% | |
---|---|---|---|---|---|
Labor | Gavan O'Connor | 38,608 | 50.82 | +0.06 | |
Liberal | Dennis Jensen | 25,561 | 33.64 | −5.93 | |
Democrats | Andre Csausov | 4,352 | 5.73 | −2.04 | |
One Nation | Robert Grant | 3,854 | 5.07 | +5.07 | |
Progressive Labour | Therese Self | 3,116 | 4.10 | +4.10 | |
Unity | Michael Garbutcheon Singh | 486 | 0.64 | +0.64 | |
Total formal votes | 75,977 | 96.79 | −0.18 | ||
Informal votes | 2,516 | 3.21 | +0.18 | ||
Turnout | 78,493 | 95.64 | −1.05 | ||
Two-party-preferred result | |||||
Labor | Gavan O'Connor | 46,618 | 61.36 | +4.56 | |
Liberal | Dennis Jensen | 29,359 | 38.64 | −4.56 | |
Labor hold | Swing | +4.56 |
Party | Candidate | Votes | % | ±% | |
---|---|---|---|---|---|
Liberal | Phil Barresi | 34,047 | 43.95 | -0.77 | |
Labor | Peter Bertolus | 30,079 | 38.83 | +0.17 | |
Democrats | John Siddons | 6,177 | 7.97 | -0.90 | |
One Nation | Paul Coelli | 2,232 | 2.88 | +2.88 | |
Greens | Robyn Evans | 1,929 | 2.49 | +0.05 | |
Tim Petherbridge | 1,486 | 1.92 | +1.92 | ||
Unity | Geoffrey Teng | 1,289 | 1.66 | +1.66 | |
Natural Law | Linda Keath | 230 | 0.30 | -0.66 | |
Total formal votes | 77,469 | 96.81 | -0.32 | ||
Informal votes | 2,549 | 3.19 | +0.32 | ||
Turnout | 80,018 | 96.05 | -0.61 | ||
Two-party-preferred result | |||||
Liberal | Phil Barresi | 40,233 | 51.93 | -0.55 | |
Labor | Peter Bertolus | 37,236 | 48.07 | +0.55 | |
Liberal hold | Swing | -0.55 |
Party | Candidate | Votes | % | ±% | |
---|---|---|---|---|---|
Liberal | Bruce Billson | 35,297 | 46.24 | −2.18 | |
Labor | Michael Quayle | 29,755 | 38.98 | −1.12 | |
Democrats | Tony Seals | 4,392 | 5.75 | −1.25 | |
One Nation | Robyn Brown | 3,399 | 4.45 | +4.45 | |
Greens | Henry Kelsall | 2,971 | 3.89 | +1.47 | |
Unity | Jan Chapman Davis | 335 | 0.44 | +0.44 | |
Natural Law | Ben Mason | 185 | 0.24 | −0.29 | |
Total formal votes | 76,334 | 97.12 | −0.39 | ||
Informal votes | 2,264 | 2.88 | +0.39 | ||
Turnout | 78,598 | 96.03 | −0.39 | ||
Two-party-preferred result | |||||
Liberal | Bruce Billson | 39,721 | 52.04 | −1.32 | |
Labor | Michael Quayle | 36,613 | 47.96 | +1.32 | |
Liberal hold | Swing | −1.32 |
Party | Candidate | Votes | % | ±% | |
---|---|---|---|---|---|
Liberal | Peter Reith | 36,570 | 47.39 | -6.31 | |
Labor | John Armitage | 28,874 | 37.42 | +4.20 | |
Democrats | David Allison | 4,923 | 6.38 | -1.08 | |
One Nation | Robert Langley | 4,029 | 5.22 | +5.22 | |
Greens | Mervyn Vogt | 2,057 | 2.67 | -1.39 | |
Unity | Tony Kamps | 451 | 0.58 | +0.58 | |
Natural Law | Jan Charlwood | 264 | 0.34 | -0.14 | |
Total formal votes | 77,168 | 96.85 | -0.30 | ||
Informal votes | 2,511 | 3.15 | +0.30 | ||
Turnout | 79,679 | 96.26 | -0.14 | ||
Two-party-preferred result | |||||
Liberal | Peter Reith | 41,457 | 53.72 | -6.34 | |
Labor | John Armitage | 35,711 | 46.28 | +6.34 | |
Liberal hold | Swing | -6.34 |
Party | Candidate | Votes | % | ±% | |
---|---|---|---|---|---|
Labor | Nicola Roxon | 51,443 | 67.47 | +4.02 | |
Liberal | Anthony Cursio | 15,233 | 19.98 | −1.81 | |
Democrats | David Wark | 3,420 | 4.49 | −0.82 | |
One Nation | Nikolas Kavalenka | 2,638 | 3.46 | +3.46 | |
Greens | Liz Ingham | 2,180 | 2.86 | −0.44 | |
Unity | Adrian Shorland | 1,078 | 1.41 | +1.41 | |
Natural Law | Michael Pollock | 249 | 0.33 | −0.09 | |
Total formal votes | 76,241 | 95.78 | +1.21 | ||
Informal votes | 3,360 | 4.22 | −1.21 | ||
Turnout | 79,601 | 93.75 | −0.61 | ||
Two-party-preferred result | |||||
Labor | Nicola Roxon | 57,875 | 75.91 | +4.68 | |
Liberal | Anthony Cursio | 18,366 | 24.09 | −4.68 | |
Labor hold | Swing | +4.68 |
Party | Candidate | Votes | % | ±% | |
---|---|---|---|---|---|
National | Peter McGauran | 31,774 | 42.97 | -18.24 | |
Labor | Judith Stone | 19,438 | 26.28 | +0.30 | |
One Nation | Tony Peters | 8,454 | 11.43 | +11.43 | |
Independent | Doug Treasure | 4,076 | 5.51 | +5.51 | |
Democrats | Jo McCubbin | 3,931 | 5.32 | -2.09 | |
Independent | Leonie Cameron | 2,611 | 3.53 | +3.53 | |
Independent | Jack Vanderland | 900 | 1.22 | +1.22 | |
Independent | Les Horsfield | 799 | 1.08 | +1.08 | |
Natural Law | Frances Clarke | 751 | 1.02 | +0.36 | |
Australia First | John Weatherhead | 650 | 0.88 | +0.88 | |
Unity | Robert Thorpe | 567 | 0.77 | +0.77 | |
Total formal votes | 73,951 | 95.08 | -2.37 | ||
Informal votes | 3,829 | 4.92 | +2.37 | ||
Turnout | 77,780 | 95.98 | -0.92 | ||
Two-party-preferred result | |||||
National | Peter McGauran | 43,506 | 58.83 | -9.81 | |
Labor | Judith Stone | 30,445 | 41.17 | +9.81 | |
National hold | Swing | -9.81 |
Party | Candidate | Votes | % | ±% | |
---|---|---|---|---|---|
Liberal | David Kemp | 41,881 | 52.04 | −3.23 | |
Labor | Margaret Khouri | 26,980 | 33.53 | +1.44 | |
Democrats | Diane Barry | 6,156 | 7.65 | −0.68 | |
Greens | Nick Brunton | 2,328 | 2.89 | −0.90 | |
One Nation | Peter Crawford | 1,822 | 2.26 | +2.26 | |
Unity | Arkady Shtrambrandt | 672 | 0.84 | +0.84 | |
Abolish Child Support | Meret Field | 413 | 0.51 | +0.51 | |
Natural Law | Joan Dickins | 225 | 0.28 | −0.25 | |
Total formal votes | 80,477 | 97.29 | −0.43 | ||
Informal votes | 2,242 | 2.71 | +0.43 | ||
Turnout | 82,719 | 94.94 | −0.72 | ||
Two-party-preferred result | |||||
Liberal | David Kemp | 46,801 | 58.15 | −2.79 | |
Labor | Margaret Khouri | 33,676 | 41.85 | +2.79 | |
Liberal hold | Swing | −2.79 |
Party | Candidate | Votes | % | ±% | |
---|---|---|---|---|---|
Liberal | Peter Costello | 41,353 | 53.44 | −2.36 | |
Labor | Jude Wallace | 24,852 | 32.12 | +1.60 | |
Democrats | Craig Shaw | 5,770 | 7.46 | −1.68 | |
Greens | Robert Trafficante | 2,155 | 2.78 | −1.13 | |
One Nation | Rod Spencer | 1,208 | 1.56 | +1.56 | |
Unity | David Zyngier | 1,031 | 1.33 | +1.33 | |
Independent | Ian Lawson | 584 | 0.75 | +0.75 | |
Natural Law | Michael Dickins | 205 | 0.26 | −0.37 | |
Independent | Russell Dwyer | 128 | 0.17 | +0.17 | |
Abolish Child Support | President Torney | 93 | 0.12 | +0.12 | |
Total formal votes | 77,379 | 96.99 | −0.99 | ||
Informal votes | 2,403 | 3.01 | +0.99 | ||
Turnout | 79,782 | 94.08 | −0.95 | ||
Two-party-preferred result | |||||
Liberal | Peter Costello | 46,133 | 59.62 | −1.11 | |
Labor | Jude Wallace | 31,246 | 40.38 | +1.11 | |
Liberal hold | Swing | −1.11 |
Party | Candidate | Votes | % | ±% | |
---|---|---|---|---|---|
Labor | Gareth Evans | 44,172 | 59.78 | +4.60 | |
Liberal | Margaret Nicholls | 21,823 | 29.54 | -2.51 | |
Democrats | Daniel Berk | 4,425 | 5.99 | -1.30 | |
Christian Democrats | Lynne Dickson | 1,296 | 1.75 | +1.75 | |
Unity | Kunwar Raj Singh | 931 | 1.26 | +1.26 | |
Independent | Robert Bisset | 860 | 1.16 | +1.16 | |
Natural Law | Heath Allison | 379 | 0.51 | -0.08 | |
Total formal votes | 73,886 | 95.47 | +0.01 | ||
Informal votes | 3,503 | 4.53 | -0.01 | ||
Turnout | 77,389 | 95.21 | -0.47 | ||
Two-party-preferred result | |||||
Labor | Gareth Evans | 48,109 | 65.11 | +2.30 | |
Liberal | Margaret Nicholls | 25,777 | 34.89 | -2.30 | |
Labor hold | Swing | +2.30 |
Party | Candidate | Votes | % | ±% | |
---|---|---|---|---|---|
Labor | Simon Crean | 46,107 | 56.98 | +1.95 | |
Liberal | John Pesutto | 26,059 | 32.21 | −3.71 | |
Democrats | Polly Morgan | 3,720 | 4.60 | −0.72 | |
One Nation | Alan Salter | 2,559 | 3.16 | +3.16 | |
Greens | Susan Walters | 1,492 | 1.84 | −0.04 | |
Unity | Stan Rosenthal | 841 | 1.04 | +1.04 | |
Natural Law | John Cordon | 137 | 0.17 | −0.21 | |
Total formal votes | 80,915 | 96.36 | −0.66 | ||
Informal votes | 3,058 | 3.64 | +0.66 | ||
Turnout | 83,973 | 95.29 | −0.56 | ||
Two-party-preferred result | |||||
Labor | Simon Crean | 51,451 | 63.59 | +3.03 | |
Liberal | John Pesutto | 29,464 | 36.41 | −3.03 | |
Labor hold | Swing | +3.03 |
Party | Candidate | Votes | % | ±% | |
---|---|---|---|---|---|
Liberal | Lou Lieberman | 38,590 | 50.87 | −11.73 | |
Labor | Zuvele Leschen | 21,572 | 28.43 | +0.40 | |
One Nation | John Anderson | 6,023 | 7.94 | +7.94 | |
Democrats | Kevin Smith | 3,708 | 4.89 | −2.91 | |
Australia First | Brian Robson | 2,157 | 2.84 | +2.84 | |
Greens | Tim Bardsley | 1,825 | 2.41 | +2.41 | |
Natural Law | Susan Griffith | 738 | 0.97 | −0.61 | |
Independent | Norm Ryan | 454 | 0.60 | +0.60 | |
Independent | David Maroney | 431 | 0.57 | +0.57 | |
Independent | Jurek Paz | 368 | 0.49 | +0.49 | |
Total formal votes | 75,866 | 96.12 | −1.57 | ||
Informal votes | 3,061 | 3.88 | +1.57 | ||
Turnout | 78,927 | 96.18 | +0.25 | ||
Two-party-preferred result | |||||
Liberal | Lou Lieberman | 45,600 | 60.11 | −7.69 | |
Labor | Zuvele Leschen | 30,266 | 39.89 | +7.69 | |
Liberal hold | Swing | −7.69 |
Party | Candidate | Votes | % | ±% | |
---|---|---|---|---|---|
Labor | Greg Wilton | 35,604 | 48.43 | +4.38 | |
Liberal | Mike Rawlinson | 28,060 | 38.17 | −3.89 | |
Democrats | Robert Ryan | 4,355 | 5.92 | −3.65 | |
One Nation | Denis Reed-Smith | 2,971 | 4.04 | +4.04 | |
Greens | Daniel Tirawa | 1,570 | 2.14 | +2.14 | |
Unity | Mija Carkeek | 421 | 0.57 | +0.57 | |
Australia First | Patricia Brook | 325 | 0.44 | +0.44 | |
Natural Law | Amanda McIntosh | 211 | 0.29 | −0.56 | |
Total formal votes | 73,517 | 96.39 | −0.82 | ||
Informal votes | 2,754 | 3.61 | +0.82 | ||
Turnout | 76,271 | 96.21 | +0.00 | ||
Two-party-preferred result | |||||
Labor | Greg Wilton | 41,467 | 56.40 | +4.84 | |
Liberal | Mike Rawlinson | 32,050 | 43.60 | −4.84 | |
Labor hold | Swing | +4.84 |
Party | Candidate | Votes | % | ±% | |
---|---|---|---|---|---|
Labor | Jenny Macklin | 38,842 | 48.15 | +3.99 | |
Liberal | Tony Raunic | 31,760 | 39.37 | −3.34 | |
Democrats | John McPherson | 4,732 | 5.87 | −1.07 | |
Greens | Robyn Roberts | 2,633 | 3.26 | −0.03 | |
One Nation | Ray Mason | 1,971 | 2.44 | +2.44 | |
Unity | Grant Walters | 468 | 0.58 | +0.58 | |
Natural Law | Steve Griffith | 265 | 0.33 | +0.01 | |
Total formal votes | 80,671 | 97.42 | −0.01 | ||
Informal votes | 2,137 | 2.58 | +0.01 | ||
Turnout | 82,808 | 96.11 | −0.78 | ||
Two-party-preferred result | |||||
Labor | Jenny Macklin | 45,100 | 55.91 | +3.20 | |
Liberal | Tony Raunic | 35,571 | 44.09 | −3.20 | |
Labor hold | Swing | +3.20 |
Party | Candidate | Votes | % | ±% | |
---|---|---|---|---|---|
Liberal | Petro Georgiou | 43,028 | 54.83 | −2.18 | |
Labor | Maxine Morand | 23,107 | 29.44 | +2.16 | |
Democrats | Brad Starkie | 6,366 | 8.11 | −0.17 | |
Greens | Wendy Salter | 3,177 | 4.05 | −0.96 | |
One Nation | Ron McKean | 1,637 | 2.09 | +2.09 | |
Unity | Milton Nomikoudis | 1,164 | 1.48 | +1.48 | |
Total formal votes | 78,479 | 97.98 | −0.03 | ||
Informal votes | 1,620 | 2.02 | +0.03 | ||
Turnout | 80,099 | 95.28 | −1.11 | ||
Two-party-preferred result | |||||
Liberal | Petro Georgiou | 48,176 | 61.39 | −2.42 | |
Labor | Maxine Morand | 30,303 | 38.61 | +2.42 | |
Liberal hold | Swing | −2.42 |
Party | Candidate | Votes | % | ±% | |
---|---|---|---|---|---|
Liberal | Bob Charles | 31,456 | 42.84 | −1.62 | |
Labor | Carolyn Hirsh | 27,733 | 37.77 | −1.06 | |
Democrats | Amanda Leeper | 6,447 | 8.78 | −0.67 | |
One Nation | Jeff Thomas | 3,173 | 4.32 | +4.32 | |
Greens | Robyn Holtham | 2,801 | 3.81 | −0.90 | |
Christian Democrats | Wolf Voigt | 740 | 1.01 | −0.25 | |
Unity | Assyl Haidar | 411 | 0.56 | +0.56 | |
Independent | Frank Dean | 331 | 0.45 | −0.33 | |
Abolish Child Support | Graham Woolley | 186 | 0.25 | +0.25 | |
Natural Law | Andrew Stenberg | 152 | 0.21 | −0.31 | |
Total formal votes | 73,430 | 96.39 | −1.08 | ||
Informal votes | 2,751 | 3.61 | +1.08 | ||
Turnout | 76,181 | 96.10 | −0.36 | ||
Two-party-preferred result | |||||
Liberal | Bob Charles | 37,442 | 50.99 | −0.38 | |
Labor | Carolyn Hirsh | 35,988 | 49.01 | +0.38 | |
Liberal hold | Swing | −0.38 |
Party | Candidate | Votes | % | ±% | |
---|---|---|---|---|---|
Labor | Julia Gillard | 46,374 | 61.21 | −0.63 | |
Liberal | Cameron O'Sullivan | 19,381 | 25.58 | −2.54 | |
Democrats | Anthony Shaw | 4,090 | 5.40 | −2.36 | |
One Nation | John Brodel | 3,127 | 4.13 | +4.13 | |
Unity | George Papaellinas | 1,446 | 1.91 | +1.91 | |
Greens | Cynthia Mason | 1,339 | 1.77 | +1.77 | |
Total formal votes | 75,757 | 96.63 | +0.03 | ||
Informal votes | 2,638 | 3.37 | −0.03 | ||
Turnout | 78,395 | 96.43 | +0.10 | ||
Two-party-preferred result | |||||
Labor | Julia Gillard | 52,893 | 69.82 | +1.31 | |
Liberal | Cameron O'Sullivan | 22,864 | 30.18 | −1.31 | |
Labor hold | Swing | +1.31 |
Party | Candidate | Votes | % | ±% | |
---|---|---|---|---|---|
National | John Forrest | 43,132 | 57.18 | −12.27 | |
Labor | John Zigouras | 16,471 | 21.83 | −1.68 | |
One Nation | Bill Croft | 9,516 | 12.61 | +12.61 | |
Democrats | Tom Joyce | 3,440 | 4.56 | −1.30 | |
Independent | Lionel McKenzie | 2,278 | 3.02 | +3.02 | |
Citizens Electoral Council | Lee Cubit | 600 | 0.80 | +0.80 | |
Total formal votes | 75,437 | 97.09 | −0.31 | ||
Informal votes | 2,260 | 2.91 | +0.31 | ||
Turnout | 77,697 | 96.13 | −0.59 | ||
Two-party-preferred result | |||||
National | John Forrest | 52,328 | 69.37 | −4.13 | |
Labor | John Zigouras | 23,109 | 30.63 | +4.13 | |
National hold | Swing | −4.13 |
Party | Candidate | Votes | % | ±% | |
---|---|---|---|---|---|
Labor | Bob Sercombe | 48,458 | 64.66 | +1.96 | |
Liberal | Will Charlton | 18,305 | 24.43 | -2.90 | |
Democrats | Helen Martin | 3,469 | 4.63 | -0.36 | |
Greens | Tony Camilleri | 1,867 | 2.49 | +2.49 | |
Citizens Electoral Council | Paul Gallagher | 1,366 | 1.82 | +1.82 | |
Unity | Diana Kalantzis | 1,203 | 1.61 | +1.61 | |
Natural Law | Paul Treacy | 273 | 0.36 | -0.30 | |
Total formal votes | 74,941 | 95.53 | +0.12 | ||
Informal votes | 3,508 | 4.47 | -0.12 | ||
Turnout | 78,449 | 95.43 | -0.55 | ||
Two-party-preferred result | |||||
Labor | Bob Sercombe | 53,999 | 72.06 | +3.20 | |
Liberal | Will Charlton | 20,942 | 27.94 | -3.20 | |
Labor hold | Swing | +3.20 |
Party | Candidate | Votes | % | ±% | |
---|---|---|---|---|---|
Liberal | Fran Bailey | 32,951 | 43.46 | -2.67 | |
Labor | Graeme McEwen | 30,350 | 40.03 | +0.93 | |
One Nation | Dennis Lacey | 3,877 | 5.11 | +5.11 | |
Democrats | Sean Carter | 3,652 | 4.82 | -1.45 | |
Greens | Pam Lawson | 2,020 | 2.66 | -1.24 | |
Shooters | Vicki Treble | 1,808 | 2.38 | +2.38 | |
Independent | Stephen Bowden | 611 | 0.81 | +0.81 | |
Independent | Elizabeth Savage Kooroonya | 363 | 0.48 | +0.48 | |
Natural Law | Susan Brown | 186 | 0.25 | -0.15 | |
Total formal votes | 75,818 | 96.66 | -0.80 | ||
Informal votes | 2,623 | 3.34 | +0.80 | ||
Turnout | 78,441 | 96.17 | -0.56 | ||
Two-party-preferred result | |||||
Liberal | Fran Bailey | 38,699 | 51.04 | -1.13 | |
Labor | Graeme McEwen | 37,119 | 48.96 | +1.13 | |
Liberal hold | Swing | -1.13 |
Party | Candidate | Votes | % | ±% | |
---|---|---|---|---|---|
Liberal | Russell Broadbent | 29,512 | 38.91 | -1.20 | |
Labor | Christian Zahra | 27,995 | 36.91 | -3.95 | |
One Nation | Bryan Atkin | 3,963 | 5.22 | +5.22 | |
Independent | Barry Cunningham | 3,800 | 5.01 | +5.01 | |
Democrats | David Wall | 3,228 | 4.26 | -0.81 | |
Shooters | Peter Kelly | 2,954 | 3.89 | +3.89 | |
Australia First | Peter Wells | 2,036 | 2.68 | +2.68 | |
Greens | Jenny Farrar | 1,645 | 2.17 | -0.50 | |
Independent | Anthony Geoghegan | 352 | 0.46 | +0.46 | |
Unity | Colin Milne | 247 | 0.33 | +0.33 | |
Natural Law | Peter Jackson | 116 | 0.15 | -0.07 | |
Total formal votes | 75,848 | 95.89 | -1.40 | ||
Informal votes | 3,251 | 4.11 | +1.40 | ||
Turnout | 79,099 | 96.53 | -0.31 | ||
Two-party-preferred result | |||||
Labor | Christian Zahra | 38,360 | 50.57 | +2.64 | |
Liberal | Russell Broadbent | 37,488 | 49.43 | -2.64 | |
Labor gain from Liberal | Swing | +2.64 |
Party | Candidate | Votes | % | ±% | |
---|---|---|---|---|---|
Labor | Lindsay Tanner | 45,958 | 57.90 | +0.17 | |
Liberal | Paul Nettelbeck | 19,289 | 24.30 | +0.21 | |
Democrats | Brent McKenna | 7,122 | 8.97 | +0.31 | |
Greens | Nolan Tyrrell | 4,811 | 6.06 | -0.58 | |
Unity | Sherridan Maxwell | 1,095 | 1.38 | +1.38 | |
Democratic Socialist | Maurice Sibelle | 425 | 0.54 | +0.54 | |
Imperial British | James Ferrari | 365 | 0.46 | -0.10 | |
Natural Law | Lawrence Clarke | 176 | 0.22 | -0.22 | |
Citizens Electoral Council | Ivan Horvat | 133 | 0.17 | +0.17 | |
Total formal votes | 79,374 | 96.34 | -0.30 | ||
Informal votes | 3,018 | 3.66 | +0.30 | ||
Turnout | 82,392 | 92.79 | +0.46 | ||
Two-party-preferred result | |||||
Labor | Lindsay Tanner | 56,991 | 71.80 | +1.59 | |
Liberal | Paul Nettelbeck | 22,383 | 28.20 | -1.59 | |
Labor hold | Swing | +1.59 |
Party | Candidate | Votes | % | ±% | |
---|---|---|---|---|---|
Labor | Michael Danby | 32,849 | 44.10 | -2.47 | |
Liberal | Fiona Snedden | 29,037 | 38.99 | -0.74 | |
Democrats | Julie Peters | 6,099 | 8.19 | +1.10 | |
Greens | Dinesh Mathew | 3,523 | 4.73 | -0.43 | |
Unity | Diana Wolowski | 1,413 | 1.90 | +1.90 | |
One Nation | Arthur Hawley | 1,380 | 1.85 | +1.85 | |
Natural Law | Tom Haynes | 180 | 0.24 | -0.25 | |
Total formal votes | 74,481 | 96.89 | -0.35 | ||
Informal votes | 2,390 | 3.11 | +0.35 | ||
Turnout | 76,871 | 92.34 | -1.10 | ||
Two-party-preferred result | |||||
Labor | Michael Danby | 41,585 | 55.83 | -0.22 | |
Liberal | Fiona Snedden | 32,896 | 44.17 | +0.22 | |
Labor hold | Swing | -0.22 |
Party | Candidate | Votes | % | ±% | |
---|---|---|---|---|---|
Liberal | Kevin Andrews | 35,415 | 46.89 | -8.63 | |
Labor | Peter Allan | 24,812 | 32.85 | -1.02 | |
Independent | Philip Nitschke | 6,843 | 9.06 | +9.06 | |
Democrats | Damian Wise | 4,395 | 5.82 | -3.02 | |
One Nation | John Casley | 1,383 | 1.83 | +1.83 | |
Unity | Mohamed Morsy | 1,383 | 1.83 | +1.83 | |
Independent | Marcia Riordan | 1,060 | 1.40 | +1.40 | |
Natural Law | Mark Bunn | 240 | 0.32 | -1.46 | |
Total formal votes | 75,531 | 96.82 | -0.71 | ||
Informal votes | 2,480 | 3.18 | +0.71 | ||
Turnout | 78,011 | 95.79 | -0.85 | ||
Two-party-preferred result | |||||
Liberal | Kevin Andrews | 41,844 | 55.40 | -5.59 | |
Labor | Peter Allan | 33,687 | 44.60 | +5.59 | |
Liberal hold | Swing | -5.59 |
Party | Candidate | Votes | % | ±% | |
---|---|---|---|---|---|
Liberal | Sharman Stone | 46,070 | 59.43 | +16.20 | |
Labor | John Stuart | 16,061 | 20.72 | -0.70 | |
Shooters | Geoff Wilson | 5,274 | 6.80 | +6.80 | |
One Nation | Robert Hellemons | 5,259 | 6.78 | +6.78 | |
Democrats | Ray Cadmore | 2,276 | 2.94 | -2.12 | |
Greens | Eleisha Mullane | 1,243 | 1.60 | +1.60 | |
Australia First | Diane Teasdale | 955 | 1.23 | +1.23 | |
Independent | Nino Marcucci | 386 | 0.50 | +0.50 | |
Total formal votes | 77,524 | 96.58 | -0.75 | ||
Informal votes | 2,742 | 3.42 | +0.75 | ||
Turnout | 80,266 | 96.05 | -0.86 | ||
Two-party-preferred result | |||||
Liberal | Sharman Stone | 55,866 | 72.06 | +18.36 | |
Labor | John Stuart | 21,658 | 27.94 | +27.94 | |
Liberal hold | Swing | +18.36 |
Party | Candidate | Votes | % | ±% | |
---|---|---|---|---|---|
Labor | Harry Jenkins | 52,320 | 67.72 | +4.44 | |
Liberal | Peter Pratt | 18,882 | 24.44 | +0.17 | |
Democrats | Hussein Tahiri | 4,503 | 5.83 | -2.90 | |
Unity | M. Kheirallah | 949 | 1.23 | +1.23 | |
Natural Law | Robert Brown | 603 | 0.78 | -0.90 | |
Total formal votes | 77,257 | 96.53 | +0.07 | ||
Informal votes | 2,777 | 3.47 | -0.07 | ||
Turnout | 80,034 | 96.18 | -0.48 | ||
Two-party-preferred result | |||||
Labor | Harry Jenkins | 55,500 | 71.84 | +1.10 | |
Liberal | Peter Pratt | 21,757 | 28.16 | -1.10 | |
Labor hold | Swing | +1.10 |
Party | Candidate | Votes | % | ±% | |
---|---|---|---|---|---|
Liberal | David Hawker | 37,570 | 49.07 | -8.43 | |
Labor | Mia Vitue | 23,897 | 31.21 | -2.21 | |
One Nation | Simon Edge | 5,889 | 7.69 | +7.69 | |
Democrats | Maggie Lindop | 4,957 | 6.47 | -2.60 | |
Reform | Leigh McDonald | 2,427 | 3.17 | +3.17 | |
Independent | Robert O'Brien | 1,824 | 2.38 | +2.38 | |
Total formal votes | 76,564 | 97.24 | -0.76 | ||
Informal votes | 2,170 | 2.76 | +0.76 | ||
Turnout | 78,734 | 96.79 | -0.72 | ||
Two-party-preferred result | |||||
Liberal | David Hawker | 43,981 | 57.44 | -4.87 | |
Labor | Mia Vitue | 32,583 | 42.56 | +4.87 | |
Liberal hold | Swing | -4.87 |
Party | Candidate | Votes | % | ±% | |
---|---|---|---|---|---|
Labor | Kelvin Thomson | 50,507 | 63.96 | +13.98 | |
Liberal | David Curry | 20,280 | 25.68 | +4.45 | |
Democrats | Robert Stone | 4,507 | 5.71 | +2.11 | |
Progressive Labour | Bill Deller | 1,875 | 2.37 | +2.37 | |
Unity | Randa Abdel-Fattah | 1,363 | 1.73 | +1.73 | |
Citizens Electoral Council | Andrew Fox | 435 | 0.55 | +0.55 | |
Total formal votes | 78,967 | 95.73 | -0.62 | ||
Informal votes | 3,520 | 4.27 | +0.62 | ||
Turnout | 82,487 | 94.55 | -0.44 | ||
Two-party-preferred result | |||||
Labor | Kelvin Thomson | 56,033 | 70.96 | +15.19 | |
Liberal | David Curry | 22,934 | 29.04 | +29.04 | |
Labor hold | Swing | +15.19 |
This is a list of electoral results for the Division of Calare in Australian federal elections from the division's creation in 1906 until the present.
This is a list of electoral results for the Division of Farrer in Australian federal elections from the electorate's creation in 1949 until the present.
This is a list of electoral results for the Division of North Sydney in Australian federal elections from the electorate's creation in 1901 until the present.
This is a list of electoral results for the Division of Parramatta in Australian federal elections from the division's creation in 1901 until the present.
This is a list of electoral results for the Division of Corio in Australian federal elections from the division's creation in 1901 until the present.
McEwan, an Australian Electoral Division in the Australian state of Victoria, has existed since 1984.
This is a list of electoral results for the Division of McMillan in Australian federal elections from the division's creation in 1949 until its abolition in 2019.
This is a list of electoral results for the Division of Higinbotham in Australian federal elections from the division's creation in 1949 until its abolition in 1969.
This is a list of electoral results for the Division of Adelaide in Australian federal elections from the division's creation in 1903 until the present.
This is a list of electoral results for the Division of Canberra in Australian federal elections from the division's creation in 1974 until the present.
The following tables show results for the Australian House of Representatives at the 1998 federal election held on 3 October 1998.
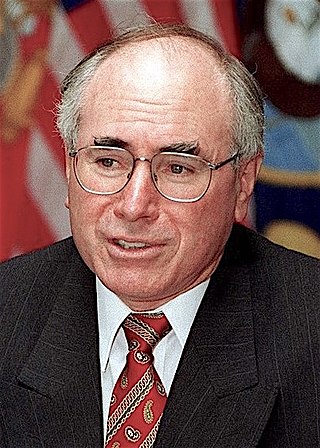
This is a list of electoral division results for the 1998 Australian federal election in the state of Western Australia.
This is a list of electoral division results for the Australian 1963 federal election.
This is a list of electoral division results for the Australian 1990 federal election in the state of Victoria.
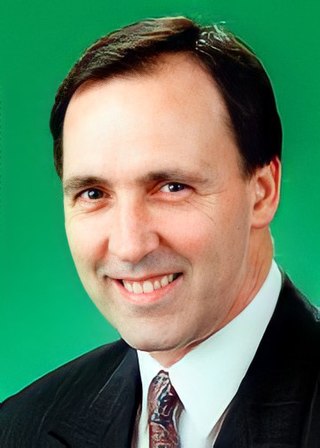
This is a list of electoral division results for the Australian 1993 federal election in the state of Victoria.
This is a list of electoral division results for the Australian 1996 federal election in the state of Victoria.
This is a list of electoral division results for the Australian 1998 federal election in the state of South Australia.
This is a list of electoral division results for the Australian 1996 federal election for the Australian Capital Territory and the Northern Territory.
This is a list of electoral division results for the Australian 1998 federal election for the Australian Capital Territory and the Northern Territory.
The following tables show results for the Australian House of Representatives at the 1993 federal election held on 13 March 1993.