Results of the 2001 Australian federal election in Victoria

Last updated

2001 Australian federal election
(Victoria)
Flag of Victoria (Australia).svg
  1998 10 November 2001 2004  

All 37 Victoria seats in the Australian House of Representatives
and 6 seats in the Australian Senate
 First partySecond party
  Kim Beazley crop.jpg Howard John BANNER.jpg
Leader Kim Beazley John Howard
Party Labor Liberal/National coalition
Last election19 seats16 seats
Seats won20 seats15 seats
Seat changeIncrease2.svg 1Decrease2.svg 1
Popular vote1,230,7571,245,542
Percentage41.65%42.15%
SwingDecrease2.svg 2.72Increase2.svg 2.35
TPP 53.05%46.95%
TPP swingIncrease2.svg 1.65Decrease2.svg 1.65

This is a list of electoral division results for the Australian 2001 federal election in the state of Victoria. [1] [2] [3]

Contents

Overall results

Turnout 99.60% (CV) — Informal 3.40% [1]
PartyVotes%SwingSeatsChange
   Liberal 1,154,49339.071.9915Decrease2.svg 1
  National 91,0493.080.362Steady2.svg
Liberal/National Coalition 1,245,54242.152.3517Decrease2.svg 1
  Labor 1,230,75741.65–2.7220Increase2.svg 1
  Democrats 184,5826.250.23
  Greens 174,3995.903.81
  Independents 60,8010.02
  One Nation 37,8111.28–2.44
  Citizens Electoral Council 6,6920.230.08
  Christian Democrats 6,1880.210.08
  No GST 5,1040.17
  Liberals for Forests 1,9600.07
  Lower Excise Fuel 1,1940.04
Total2,955,03137
Two-party-preferred vote
  Labor 1,540,61452.14–1.3920Increase2.svg 1
  Liberal/National Coalition 1,414,41746.47+1.3917Decrease2.svg 1
Invalid/blank votes122,5253.68+0.47
Turnout2,955,03195.61
Registered voters3,218,746
Source: AEC Tally Room

Results by division

Aston

2001 Australian federal election: Aston
PartyCandidateVotes%±%
Liberal Chris Pearce 42,97350.78+2.29
Labor Kieran Boland31,26936.95−1.56
Democrats Ruth Kendall5,9527.03−0.49
Greens Mick Kir3,0623.62+3.62
Christian Democrats Ray Levick1,0741.27+1.27
Citizens Electoral Council Doug Mitchell2900.34+0.34
Total formal votes84,62096.82−0.35
Informal votes2,7823.18+0.35
Turnout 87,40297.12
Two-party-preferred result
Liberal Chris Pearce 47,53156.17+1.93
Labor Kieran Boland37,08943.83−1.93
Liberal hold Swing +1.93

Ballarat

2001 Australian federal election: Ballarat
PartyCandidateVotes%±%
Labor Catherine King 35,55844.14+3.23
Liberal Charles Collins34,51242.85−2.39
Greens Tony Kelly5,1266.36+4.95
Democrats Danii Coric3,3004.10+0.40
One Nation John Blanchard2,0532.55−2.35
Total formal votes80,54997.12+0.67
Informal votes2,3912.88−0.67
Turnout 82,94097.65
Two-party-preferred result
Labor Catherine King 42,47152.73+5.50
Liberal Charles Collins38,07847.27−5.50
Labor gain from Liberal Swing +5.50

Batman

2001 Australian federal election: Batman
PartyCandidateVotes%±%
Labor Martin Ferguson 46,50658.70−7.13
Liberal John Davies17,19621.71+1.48
Greens Alex Bhathal9,17111.58+6.98
Democrats Scott Kneebone4,9546.25+1.24
  Democratic Socialist Jackie Lynch1,0641.34+1.34
Citizens Electoral Council Wayne Barwick3290.42+0.42
Total formal votes79,22094.46−1.63
Informal votes4,6475.54+1.63
Turnout 83,86793.49
Two-party-preferred result
Labor Martin Ferguson 59,47875.08−1.35
Liberal John Davies19,74224.92+1.35
Labor hold Swing −3.75

Bendigo

2001 Australian federal election: Bendigo
PartyCandidateVotes%±%
Labor Steve Gibbons 35,63043.48+0.58
Liberal Maurie Sharkey32,31139.43+3.55
Greens Bruce Rivendell4,2795.22+2.56
Democrats Helen Lilley2,6203.20−1.33
One Nation Neil Smith2,0392.49−4.12
Christian Democrats Phil Arnold1,8572.27+2.27
Independent Karel Zegers1,3871.69+1.69
Independent John Pasquarelli 1,0731.31+1.31
Ron Barrow7440.91+0.91
Total formal votes81,94096.28+0.42
Informal votes3,1653.72−0.42
Turnout 85,10597.03
Two-party-preferred result
Labor Steve Gibbons 43,89253.57+0.10
Liberal Maurie Sharkey38,04846.43−0.10
Labor hold Swing +0.10

Bruce

2001 Australian federal election: Bruce
PartyCandidateVotes%±%
Labor Alan Griffin 38,15048.61−0.05
Liberal Reg Steel31,81340.54+1.96
Democrats Shaun Robyns5,1646.58+0.56
Greens David Collis3,3494.27+2.74
Total formal votes78,47696.35+0.04
Informal votes2,9693.65−0.04
Turnout 81,44595.62
Two-party-preferred result
Labor Alan Griffin 43,59255.55−1.17
Liberal Reg Steel34,88444.45+1.17
Labor hold Swing −1.17

Burke

2001 Australian federal election: Burke
PartyCandidateVotes%±%
Labor Brendan O'Connor 39,13847.74−2.25
Liberal Chris Dawe31,28238.16+2.13
Greens Marcus Ward6,0627.39+5.48
Democrats Geoff Lutz5,4936.70+0.72
Total formal votes81,97596.43+1.61
Informal votes3,0313.57−1.61
Turnout 85,00695.98
Two-party-preferred result
Labor Brendan O'Connor 45,50455.51−2.10
Liberal Chris Dawe36,47144.49+2.10
Labor hold Swing −2.10

Calwell

2001 Australian federal election: Calwell
PartyCandidateVotes%±%
Labor Maria Vamvakinou 45,20351.85−10.50
Liberal Darren Buller22,02025.26−1.06
Independent Andrew Theophanous 8,3929.63+9.63
Democrats Robert Livesay3,3563.85−2.84
No GST John Abbotto3,0743.53+3.53
Greens Bee Barker2,1052.41+2.41
Independent D. Dervish2,0032.30+2.30
Mohamed Bochi5550.64+0.64
Citizens Electoral Council Sleiman Yohanna4650.53+0.53
Total formal votes87,17393.56−3.00
Informal votes6,0056.44+3.00
Turnout 93,17895.28+0.73
Two-party-preferred result
Labor Maria Vamvakinou 59,04467.73−1.25
Liberal Darren Buller28,12932.27+1.25
Labor hold Swing −1.25

Casey

2001 Australian federal election: Casey
PartyCandidateVotes%±%
Liberal Tony Smith 40,35451.26+4.87
Labor David McKenzie 26,21133.29−0.13
Democrats Tom Joyce6,7388.56+1.15
Greens Lorraine Leach5,4246.89+4.68
Total formal votes78,72796.42+0.44
Informal votes2,9223.58−0.44
Turnout 81,64996.18
Two-party-preferred result
Liberal Tony Smith 45,00457.16+2.29
Labor David McKenzie 33,72342.84−2.29
Liberal hold Swing +2.29

Chisholm

2001 Australian federal election: Chisholm
PartyCandidateVotes%±%
Liberal Ros Clowes34,83643.58+1.84
Labor Anna Burke 33,92942.44+0.06
Democrats James Bennett5,3796.73−0.14
Greens Howard Tankey4,8986.13+3.03
No GST John Murray8951.12+1.12
Total formal votes79,93796.99+0.56
Informal votes2,4813.01−0.56
Turnout 82,41895.26
Two-party-preferred result
Labor Anna Burke 42,17952.77+0.70
Liberal Ros Clowes37,75847.23−0.70
Labor hold Swing +0.70

Corangamite

2001 Australian federal election: Corangamite
PartyCandidateVotes%±%
Liberal Stewart McArthur 37,92947.42+1.40
Labor Michael Bjork-Billings26,56933.21−2.87
Democrats Robyn Hodge5,1286.41+0.02
Greens Iain Lygo5,0986.37+3.30
One Nation Graham Hills1,9822.48−3.07
Liberals for Forests Nigel Strauss1,9602.45+2.45
Independent Simon Arundell1,3261.66−0.53
Total formal votes79,99296.62−0.83
Informal votes2,7983.38+0.83
Turnout 82,79096.86
Two-party-preferred result
Liberal Stewart McArthur 44,52955.67+1.17
Labor Michael Bjork-Billings35,46344.33−1.17
Liberal hold Swing +1.17

Corio

2001 Australian federal election: Corio [3]
PartyCandidateVotes%±%
Labor Gavan O'Connor 38,02148.75−2.07
Liberal Steve Malesic28,25436.22+2.58
Democrats Erica Menheere-Thompson5,3886.91+1.18
Greens Catherine Johnson3,3884.34+4.34
One Nation Herbert Tirkot1,4201.82−3.25
Tim Gooden6980.89+0.89
Cheryl Fairbrother6530.84+0.84
Citizens Electoral Council Gareth Hill1760.23+0.23
Total formal votes77,99894.91−1.89
Informal votes4,1855.09+1.89
Turnout 82,18396.47
Two-party-preferred result
Labor Gavan O'Connor 45,78758.70−2.66
Liberal Steve Malesic32,21141.30+2.66
Labor hold Swing −2.66

Deakin

2001 Australian federal election: Deakin
PartyCandidateVotes%±%
Liberal Phil Barresi 37,41747.26+3.31
Labor Helen Buckingham 30,39738.39−0.44
Democrats Nahum Ayliffe6,3177.98+0.00
Greens Robyn Evans5,0456.37+3.88
Total formal votes79,17697.44+0.62
Informal votes2,0822.56−0.62
Turnout 81,25895.62
Two-party-preferred result
Liberal Phil Barresi 40,96251.74−0.19
Labor Helen Buckingham 38,21448.26+0.19
Liberal hold Swing -0.19

Dunkley

2001 Australian federal election: Dunkley
PartyCandidateVotes%±%
Liberal Bruce Billson 39,20349.90+3.66
Labor Mark Conroy28,08835.75−3.23
Greens Henry Kelsall4,4865.71+1.82
Democrats Ian Woodhouse4,3505.54−0.22
One Nation Michael Cartwright1,4381.83−2.62
Independent Fletcher Davis9951.27+1.27
Total formal votes78,56096.55−0.57
Informal votes2,8053.45+0.57
Turnout 81,36596.27
Two-party-preferred result
Liberal Bruce Billson 43,53755.42+3.88
Labor Mark Conroy35,02344.58−3.88
Liberal hold Swing +3.88

Flinders

2001 Australian federal election: Flinders
PartyCandidateVotes%±%
Liberal Greg Hunt 43,60151.71+4.32
Labor Wayne Finch27,69532.85−4.57
Greens David de Rango4,8865.79+3.13
Democrats Richard Armstrong4,6905.56−0.82
One Nation Kevin Dowey1,9112.27−2.95
Independent Earle Wilson9681.15+1.15
Independent Ashley Blade5670.67+0.67
Total formal votes84,31896.23−0.61
Informal votes3,3003.77+0.61
Turnout 87,61896.47
Two-party-preferred result
Liberal Greg Hunt 48,58557.62+3.90
Labor Wayne Finch35,73342.38−3.90
Liberal hold Swing +3.90

Gellibrand

2001 Australian federal election: Gellibrand
PartyCandidateVotes%±%
Labor Nicola Roxon 46,12460.40−7.07
Liberal Christopher Tann19,19125.13+5.15
Democrats Rachel Richards5,2566.88+2.40
Greens Michele Finey4,8316.33+3.47
Jorge Jorquera9631.26+1.26
Total formal votes76,36595.10−0.68
Informal votes3,9384.90+0.68
Turnout 80,30393.31
Two-party-preferred result
Labor Nicola Roxon 54,81471.78−4.13
Liberal Christopher Tann21,55128.22+4.13
Labor hold Swing −4.13

Gippsland

2001 Australian federal election: Gippsland
PartyCandidateVotes%±%
National Peter McGauran 34,55545.62+2.65
Labor Bill Bolitho19,46925.70−0.58
Independent Doug Treasure4,2495.61+0.10
Greens Chris Aitken 4,2055.55+5.55
One Nation Michael Freshwater4,0665.37−6.06
Democrats Jo McCubbin3,3314.40−0.92
Independent John Jago1,5792.08+2.08
Independent Phillip Evans1,5512.05+2.05
Independent Ben Buckley1,2491.65+1.65
Independent Marjorie Thorpe7911.04+1.04
Independent Phillip Robinson4870.64+0.64
Citizens Electoral Council Frank Williams2210.29+0.29
Total formal votes75,75394.41−0.66
Informal votes4,4845.59+0.66
Turnout 80,23796.02
Two-party-preferred result
National Peter McGauran 43,97858.02−0.81
Labor Bill Bolitho31,77541.96+0.81
National hold Swing -0.81

Goldstein

2001 Australian federal election: Goldstein
PartyCandidateVotes%±%
Liberal David Kemp 43,53552.72+0.68
Labor Rachel Powning22,73027.52−6.00
Democrats Michaela Newell6,2157.53−0.12
Greens Teresa Puszka5,2946.41+3.52
Independent Kristin Stegley4,8075.82+5.82
Total formal votes82,58197.23−0.06
Informal votes2,3502.77+0.06
Turnout 84,93194.60
Two-party-preferred result
Liberal David Kemp 49,12259.48+1.33
Labor Rachel Powning33,45940.52−1.33
Liberal hold Swing +1.33

Higgins

2001 Australian federal election: Higgins
PartyCandidateVotes%±%
Liberal Peter Costello 42,43753.19−0.25
Labor Katie Stephens23,03828.88−3.24
Democrats Katie Moss7,2759.12+1.66
Greens Tania Giles7,0298.81+6.03
Total formal votes79,77997.32+0.33
Informal votes2,1982.68−0.33
Turnout 81,97793.47
Two-party-preferred result
Liberal Peter Costello 46,58358.39−1.23
Labor Katie Stephens33,19641.61+1.23
Liberal hold Swing −1.23

Holt

2001 Australian federal election: Holt
PartyCandidateVotes%±%
Labor Anthony Byrne 44,68156.50−3.29
Liberal Jason Wood 24,62131.13+1.60
Democrats Polly Morgan5,2406.63+0.64
Greens Theos Patrinos2,1492.72+2.72
Christian Democrats Lynne Dickson1,5131.91+0.16
Gordon Ford8801.11+1.11
Total formal votes79,08495.06−0.41
Informal votes4,1094.94+0.41
Turnout 83,19395.05
Two-party-preferred result
Labor Anthony Byrne 50,07863.32−1.79
Liberal Jason Wood 29,00636.68+1.79
Labor hold Swing -1.79

Hotham

2001 Australian federal election: Hotham
PartyCandidateVotes%±%
Labor Simon Crean 44,35154.45−2.53
Liberal Priscilla Ruffolo28,57935.09+2.88
Democrats Jessica Joss4,3835.38+0.78
Greens Ollie Bennett3,5444.35+2.51
Citizens Electoral Council Simon Hall5980.73+0.73
Total formal votes81,45596.44+0.08
Informal votes3,0053.56−0.08
Turnout 84,46095.08
Two-party-preferred result
Labor Simon Crean 49,70161.01−2.58
Liberal Priscilla Ruffolo31,75438.99+2.58
Labor hold Swing −2.58

Indi

2001 Australian federal election: Indi
PartyCandidateVotes%±%
Liberal Sophie Panopoulos 31,15240.07−10.79
Labor Barbara Murdoch21,01427.02−1.41
National Don Chambers9,55212.29+12.29
Independent Nelson McIntosh5,2846.80+6.80
One Nation Lyn Bennetts3,0793.96−3.98
Greens Michael Wardle2,9563.80+1.40
Democrats Robert Chuck2,9203.76−1.12
Pat Adams8951.15+1.15
Christian Democrats Philip Seymour8841.14+1.14
Total formal votes77,73694.78−1.34
Informal votes4,2815.22+1.34
Turnout 82,01795.91
Two-party-preferred result
Liberal Sophie Panopoulos 47,53561.19+1.08
Labor Barbara Murdoch30,20138.81−1.08
Liberal hold Swing +1.08

Isaacs

2001 Australian federal election: Isaacs
PartyCandidateVotes%±%
Labor Ann Corcoran 31,95142.18−6.25
Liberal Michael Shepherdson31,52041.61+3.44
Democrats Haydn Fletcher5,6277.43+1.50
Greens Darren Bujeya3,0734.06+1.92
One Nation John Groves1,3581.79−2.25
Independent Shirly Oakley1,3421.77+1.77
Independent Patricia Brook6400.84+0.84
Citizens Electoral Council Heather Stanton2460.32+0.32
Total formal votes75,75795.35−1.03
Informal votes3,6914.65+1.03
Turnout 79,44897.11
Two-party-preferred result
Labor Ann Corcoran 40,01152.81−3.59
Liberal Michael Shepherdson35,74647.19+3.59
Labor hold Swing −3.59

Jagajaga

2001 Australian federal election: Jagajaga
PartyCandidateVotes%±%
Labor Jenny Macklin 37,02745.61−2.54
Liberal Brett Jones32,61940.18+0.81
Democrats Peter Wigg5,4216.68+0.81
Greens Samantha Roberts5,1786.38+3.11
Independent Gary Schorel-Hlavka6730.83+0.83
Citizens Electoral Council Paul Gallagher2660.33+0.33
Total formal votes81,18496.36−1.06
Informal votes3,0703.64+1.06
Turnout 84,25495.93
Two-party-preferred result
Labor Jenny Macklin 45,17055.64−0.27
Liberal Brett Jones36,01444.36+0.27
Labor hold Swing −0.27

Kooyong

2001 Australian federal election: Kooyong
PartyCandidateVotes%±%
Liberal Petro Georgiou 44,24455.08+0.26
Labor Tom Wilson21,09626.26−3.18
Greens Peter Campbell8,60710.72+6.67
Democrats Ari Sharp6,3747.94−0.18
Total formal votes80,32197.48−0.50
Informal votes2,0752.52+0.50
Turnout 82,39694.86
Two-party-preferred result
Liberal Petro Georgiou 48,94460.94−0.45
Labor Tom Wilson31,37739.06+0.45
Liberal hold Swing −0.45

La Trobe

2001 Australian federal election: La Trobe
PartyCandidateVotes%±%
Liberal Bob Charles 37,64146.59+3.75
Labor Philip Staindl27,91234.55−3.22
Democrats Tony Holland6,4247.95−0.83
Greens Craig Smith5,7407.10+3.29
One Nation June Scott1,3041.61−2.71
Christian Democrats Wolfgang Voigt8611.07+0.06
Independent Jason Allen5300.66+0.66
Independent Frank Dean3860.48+0.03
Total formal votes80,79895.80−0.59
Informal votes3,5444.20+0.59
Turnout 84,34295.92
Two-party-preferred result
Liberal Bob Charles 43,36653.67+2.68
Labor Philip Staindl37,43246.33−2.68
Liberal hold Swing +2.68

Lalor

2001 Australian federal election: Lalor
PartyCandidateVotes%±%
Labor Julia Gillard 47,49058.10−3.12
Liberal David McConnell24,63430.14+4.55
Democrats Roger Howe6,2977.70+2.30
Greens Tony Briffa3,3214.06+2.30
Total formal votes81,74295.65−0.99
Informal votes3,7184.35+0.99
Turnout 85,46096.20
Two-party-preferred result
Labor Julia Gillard 53,64465.63−4.19
Liberal David McConnell28,09834.37+4.19
Labor hold Swing −4.19

Mallee

2001 Australian federal election: Mallee
PartyCandidateVotes%±%
National John Forrest 44,76959.06+1.88
Labor John Zigouras15,44020.37−1.47
One Nation Bob Mackley6,5508.64−3.97
Independent Ross Douglass3,7044.89+4.89
Democrats Timothy Kelly3,5324.66+0.10
Greens Julie Rivendell1,8092.39+2.39
Total formal votes75,80496.38−0.71
Informal votes2,8503.62+0.71
Turnout 78,65496.62
Two-party-preferred result
National John Forrest 53,00769.93+0.56
Labor John Zigouras22,79730.07−0.56
National hold Swing +0.56

Maribyrnong

2001 Australian federal election: Maribyrnong
PartyCandidateVotes%±%
Labor Bob Sercombe 44,82559.91−4.75
Liberal Grahame Barclay20,70527.67+3.25
Democrats Charles Williams4,5676.10+1.48
Greens Jules Beckwith2,8783.85+1.36
Citizens Electoral Council Andre Kozlowski1,8402.46+0.64
Total formal votes74,81594.55−0.97
Informal votes4,3095.45+0.97
Turnout 79,12494.71
Two-party-preferred result
Labor Bob Sercombe 50,41067.38−4.68
Liberal Grahame Barclay24,40532.62+4.68
Labor hold Swing -4.68

McEwen

2001 Australian federal election: McEwen [3]
PartyCandidateVotes%±%
Liberal Fran Bailey 37,96346.01+2.55
Labor Andrew MacLeod 31,98638.76−1.27
Greens Jim Romagnesi5,0066.07+3.40
Democrats Tony Carden3,9864.83+0.01
One Nation Alan Salter2,4482.97−2.15
Independent Bill Lodwick1,1291.37+1.37
Total formal votes82,51896.19−0.47
Informal votes3,2723.81+0.47
Turnout 85,79097.24
Two-party-preferred result
Liberal Fran Bailey 42,24951.20+0.16
Labor Andrew MacLeod 40,26948.80−0.16
Liberal hold Swing +0.16

McMillan

2001 Australian federal election: McMillan [3]
PartyCandidateVotes%±%
Labor Christian Zahra 35,23844.48+7.57
Liberal Jim Forbes31,53239.80+0.94
Democrats David Wall3,2334.08−0.17
Greens Jenny Farrar2,9183.68+1.51
One Nation John Holtman2,8643.62−1.61
National David Roberts2,1722.74+2.74
Betty Howell1,2621.59+1.59
Total formal votes79,21996.52+0.63
Informal votes2,8533.48−0.63
Turnout 82,07296.44
Two-party-preferred result
Labor Christian Zahra 41,55952.46+1.89
Liberal Jim Forbes37,66047.54−1.89
Labor hold Swing +1.89

Melbourne

2001 Australian federal election: Melbourne
PartyCandidateVotes%±%
Labor Lindsay Tanner 39,97847.65−10.25
Liberal Con Frantzeskos20,87024.87+0.57
Greens Pamela Curr13,17415.70+9.64
Democrats Brent McKenna8,0629.61+0.64
  Independent Socialist Stephen Jolly 1,2601.50+1.50
Imperial British James Ferrari5580.67+0.21
Total formal votes83,90296.23−0.11
Informal votes3,2883.77+0.11
Turnout 87,19091.58
Two-party-preferred result
Labor Lindsay Tanner 58,80870.09−1.71
Liberal Con Frantzeskos25,09429.91+1.71
Labor hold Swing -1.71

Melbourne Ports

2001 Australian federal election: Melbourne Ports
PartyCandidateVotes%±%
Liberal Andrew McLorinan31,38439.71+0.72
Labor Michael Danby 31,11039.36−4.74
Greens Jeannette Kavanagh8,91211.28+6.55
Democrats Greg Chipp7,3289.27+1.08
Citizens Electoral Council Jeremy Beck3050.39+0.39
Total formal votes79,03996.74−0.15
Informal votes2,6623.26+0.15
Turnout 81,70192.32
Two-party-preferred result
Labor Michael Danby 44,01855.69−0.14
Liberal Andrew McLorinan35,02144.31+0.14
Labor hold Swing -0.14

Menzies

2001 Australian federal election: Menzies
PartyCandidateVotes%±%
Liberal Kevin Andrews 41,56553.28+6.39
Labor Olga Vasilopoulos25,89533.19+0.34
Democrats Michael Ryan5,1136.55+0.74
Greens Barry Watson4,3015.51+5.51
No GST Brendan Griffin1,1351.45+1.45
Total formal votes78,00996.55−0.27
Informal votes2,7843.45+0.27
Turnout 80,79395.78
Two-party-preferred result
Liberal Kevin Andrews 45,97758.94+3.54
Labor Olga Vasilopoulos32,03241.06−3.54
Liberal hold Swing +3.54

Murray

2001 Australian federal election: Murray
PartyCandidateVotes%±%
Liberal Sharman Stone 53,49867.24+7.81
Labor Alan Calder16,08320.21−0.50
One Nation Robert Hellemons3,1623.97−2.81
Democrats Elizabeth Taylor2,5143.16+0.22
Independent Simon Bush2,4833.12+3.12
Greens David Jones1,8272.30+0.69
Total formal votes79,56796.47−0.11
Informal votes2,9083.53+0.11
Turnout 82,47597.25
Two-party-preferred result
Liberal Sharman Stone 58,82473.93+1.87
Labor Alan Calder20,74326.07−1.87
Liberal hold Swing +1.87

Scullin

2001 Australian federal election: Scullin
PartyCandidateVotes%±%
Labor Harry Jenkins 51,29463.07−4.65
Liberal Lucas Kostadinoski21,70626.69+2.25
Democrats Brian Mawhinney5,3176.54+0.71
Greens Merinda Gray2,4222.98+2.98
Citizens Electoral Council Trudy Campbell5890.72+0.72
Total formal votes81,32895.12−1.41
Informal votes4,1744.88+1.41
Turnout 85,50296.62
Two-party-preferred result
Labor Harry Jenkins 56,26569.17−2.67
Liberal Lucas Kostadinoski25,05130.83+2.67
Labor hold Swing -2.67

Wannon

2001 Australian federal election: Wannon
PartyCandidateVotes%±%
Liberal David Hawker 40,36652.39+3.32
Labor Richard Morrow25,64833.29+2.08
Greens Gillian Blair2,7643.59+3.59
Democrats Amanda Packer2,2962.98−3.49
One Nation Olive Schmidt2,1362.77−4.92
Independent Leigh McDonald1,7602.28+2.28
Lower Excise Fuel Ricky Witney1,1941.55+1.55
Independent Robert O'Brien8781.14−1.24
Total formal votes77,04296.13−1.11
Informal votes3,0983.87+1.11
Turnout 80,14097.29
Two-party-preferred result
Liberal David Hawker 45,92159.58+2.14
Labor Richard Morrow31,12040.42−2.14
Liberal hold Swing +2.14

Wills

2001 Australian federal election: Wills
PartyCandidateVotes%±%
Labor Kelvin Thomson 44,01956.03−7.93
Liberal Vytautas Valasinavicius21,03026.77+1.08
Greens Richard Di Natale 6,0817.74+7.74
Democrats Robert Stone5,0366.41+0.70
Citizens Electoral Council Craig Isherwood1,3671.74+1.19
Socialist Alliance David Glanz1,0361.32+1.32
Total formal votes78,56994.81−0.92
Informal votes4,3025.19+0.92
Turnout 82,87193.93
Two-party-preferred result
Labor Kelvin Thomson 54,54269.42−1.54
Liberal Vytautas Valasinavicius24,02730.56+1.54
Labor hold Swing -1.54

See also

Related Research Articles

<span class="mw-page-title-main">Catherine King (politician)</span> Australian politician (born 1966)

Catherine Fiona King is an Australian politician serving as the Minister for Infrastructure, Transport, Regional Development and Local Government since 2022 and as the Member of Parliament (MP) for Ballarat since 2001. She is a member of the Australian Labor Party (ALP) and briefly served as a minister in the Gillard and Rudd governments in 2013. She served as Shadow Minister of Health from 2013 to 2019 and as Shadow Minister for Infrastructure, Transport and Regional Development from 2019 to 2022.

<span class="mw-page-title-main">Electorates of the Australian House of Representatives</span> Federal electorates in Australia

Electorates of the Australian House of Representatives are single member electoral districts for the lower house of the Parliament of the Commonwealth. There are currently 151 electorates.

<span class="mw-page-title-main">Division of Ballarat</span> Australian federal electoral division

The Division of Ballarat is an Australian electoral division in the state of Victoria. The division was proclaimed in 1900, and was one of the original 65 divisions to be contested at the first federal election. It was named for the provincial city of the same name by Scottish squatter Archibald Yuille, who established the first settlement − his sheep run called Ballaarat − in 1837, with the name derived from a local Wathawurrung word for the area, balla arat, thought to mean "resting place".

<span class="mw-page-title-main">Division of Indi</span> Australian federal electoral division

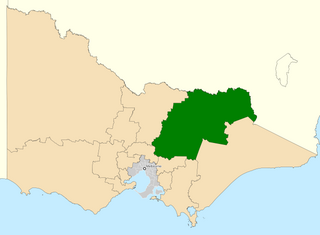
The Division of Indi is an Australian electoral division in the state of Victoria. The division is located in the north-east of the state, adjoining the border with New South Wales. The largest settlements in the division are the regional cities of Wodonga, Wangaratta, and Benalla. Other towns in the electorate include Rutherglen, Mansfield, Beechworth, Myrtleford, Bright, Alexandra, Tallangatta, Corryong and a number of other small villages. While Indi is one of the largest electorates in Victoria, much of it is located within the largely uninhabited Australian Alps. While Wodonga serves as a regional hub for much of the more heavily populated northern part of the electorate, the southern part is closer to Melbourne than Wodonga.

In Australia, a redistribution is the process of redrawing the boundaries of electoral divisions for the House of Representatives arising from changes in population and changes in the number of representatives. There is no redistribution for the Senate as each State constitutes a division, though with multiple members. The Australian Electoral Commission (AEC), an independent statutory authority, oversees the apportionment and redistribution process for federal divisions, taking into account a number of factors. Politicians, political parties and the public may make submissions to the AEC on proposed new boundaries, but any interference with their deliberations is considered a serious offence.

This is a list of electoral results for the Division of Calare in Australian federal elections from the division's creation in 1906 until the present.

This is a list of electoral results for the Division of North Sydney in Australian federal elections from the electorate's creation in 1901 until the present.

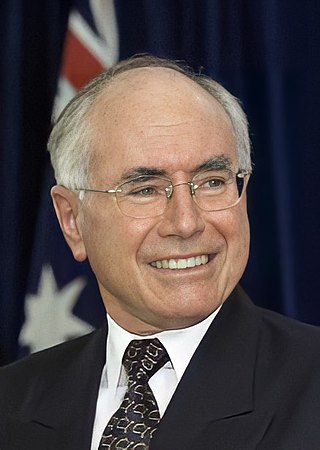
This is a list of electoral results for the Division of Warringah in Australian federal elections from the division's creation in 1922 until the present.

This is a list of electoral results for the Division of Corio in Australian federal elections from the division's creation in 1901 until the present.

McEwan, an Australian Electoral Division in the Australian state of Victoria, has existed since 1984.

This is a list of electoral results for the Division of McMillan in Australian federal elections from the division's creation in 1949 until its abolition in 2019.

This is a list of electoral results for the Division of Wills in Australian federal elections from the division's creation in 1949 until the present.

This is a list of electoral results for the Division of Burke in Australian federal elections from the division's creation in 1949 until its abolition in 1955.

This is a list of electoral results for the Division of Higinbotham in Australian federal elections from the division's creation in 1949 until its abolition in 1969.

<span class="mw-page-title-main">Results of the 2007 Australian federal election in Victoria</span>

This is a list of electoral division results for the Australian 2007 federal election in the state of Victoria.

<span class="mw-page-title-main">Results of the 2001 Australian federal election in Tasmania</span>

This is a list of electoral division results for the Australian 2001 federal election in the state of Tasmania.

<span class="mw-page-title-main">Results of the 2001 Australian federal election in South Australia</span>

This is a list of electoral division results for the Australian 2001 federal election in the state of South Australia.

<span class="mw-page-title-main">Results of the 2001 Australian federal election in Western Australia</span>

This is a list of electoral division results for the Australian 2001 federal election in the state of Western Australia.

<span class="mw-page-title-main">Results of the 2001 Australian federal election in Queensland</span>

This is a list of electoral division results for the Australian 2001 federal election in the state of Queensland.

The following tables show results for the Australian House of Representatives at the 2001 federal election held on 10 November 2001. The parliament increased from 148 to 150 seats, with a new seat in Western Australia and a new seat in the Northern Territory.

References

  1. 1 2 "2001 First preference votes for Victoria". Australian Electoral Commission. Retrieved 8 June 2022.
  2. "2001 Victoria division results". Australian Electoral Commission. Retrieved 8 June 2022.
  3. 1 2 3 4 "2001 House of Representatives: Victoria". Psephos Adam Carr's Election Archive. Retrieved 8 June 2022.