Results of the 2001 Australian federal election in South Australia

Last updated

2001 Australian federal election
(South Australia)
Flag of South Australia.svg
  1998 10 November 2001 2004  

All 12 South Australian seats in the Australian House of Representatives
and 6 seats in the Australian Senate
 First partySecond party
  Howard John BANNER.jpg Kim Beazley crop.jpg
Leader John Howard Kim Beazley
Party Liberal/National coalition Labor
Last election9 seats3 seats
Seats won9 seats3 seats
Seat changeSteady2.svgSteady2.svg
Popular vote430,442316,362
Percentage45.90%33.75%
SwingIncrease2.svg 3.85Decrease2.svg 0.74
TPP 54.08%45.92%
TPP swingIncrease2.svg 0.97Decrease2.svg 0.97

This is a list of electoral division results for the Australian 2001 federal election in the state of South Australia. [1] [2] [3]

Contents

Overall results

Turnout 99.60% (CV) — Informal 3.40% [1]
PartyVotes%SwingSeatsChange
  Liberal 430,44245.903.859Steady2.svg
  Labor 316,36233.74-0.743Steady2.svg
  Democrats 98,84910.540.40
  One Nation 44,5744.75-5.05
  Greens 34,1413.643.15
  Independents 7,9210.80
  No GST 4,2020.42+0.42
  Communist 0,6720.07
Total937,70812
Two-party-preferred vote
  Liberal 45.92-0.979Steady2.svg
  Labor  54.080.973Steady2.svg

Results by division

Adelaide

2001 Australian federal election: Adelaide [3]
PartyCandidateVotes%±%
Liberal Trish Worth 34,25844.20+0.80
Labor Tim Stanley28,73237.07−0.08
Democrats Sue Mann8,25510.65+0.93
Greens Lynne Osborn4,6385.98+2.82
One Nation Lee Peacock1,6302.10−3.34
Total formal votes77,51394.91−0.70
Informal votes4,1565.09+0.70
Turnout 81,66994.81
Two-party-preferred result
Liberal Trish Worth 38,92850.22−0.43
Labor Tim Stanley38,58549.78+0.43
Liberal hold Swing −0.43

Barker

2001 Australian federal election: Barker
PartyCandidateVotes%±%
Liberal Patrick Secker 43,20154.06+7.20
Labor David Detchon18,96823.74+2.04
One Nation Dona Wright5,9007.38−5.62
Democrats Louise Miller5,5046.89+0.55
Greens Matt Rigney2,6293.29+3.29
Independent Liz Ballinger2,5383.18+3.18
Independent Philip Cornish1,1671.46+1.46
Total formal votes79,90794.50−0.43
Informal votes4,6545.50+0.43
Turnout 84,56196.96
Two-party-preferred result
Liberal Patrick Secker 52,49165.69+1.65
Labor David Detchon27,41634.31−1.65
Liberal hold Swing +1.65

Bonython

2001 Australian federal election: Bonython
PartyCandidateVotes%±%
Labor Martyn Evans 35,81347.36−2.42
Liberal Brenton Chomel21,82228.86+3.81
Democrats Mark Dennis7,98410.56+1.26
One Nation John Mahoney4,8256.38−8.23
No GST Rita Hunt3,0664.05+4.05
Greens Lisa Blake2,1022.78+2.78
Total formal votes75,61292.67−1.87
Informal votes5,9847.33+1.87
Turnout 81,59696.00
Two-party-preferred result
Labor Martyn Evans 45,68860.42−2.89
Liberal Brenton Chomel29,92439.58+2.89
Labor hold Swing −2.89

Boothby

2001 Australian federal election: Boothby
PartyCandidateVotes%±%
Liberal Andrew Southcott 39,25847.93−0.53
Labor Jim Murphy20,97625.61−4.82
Democrats Jo Pride15,95119.47+5.92
Greens Michelle Drummond2,5163.07+3.07
One Nation Daniel Piechnick2,1512.63−4.13
Independent Paul Starling4680.57+0.57
Independent Jack King4410.54+0.54
William Manfield1540.19+0.19
Total formal votes81,91595.50−1.47
Informal votes3,8644.50+1.47
Turnout 85,77995.99
Two-party-preferred result
Liberal Andrew Southcott 46,98257.35−0.26
Labor Jim Murphy34,93342.65+0.26
Liberal hold Swing −0.26

Grey

2001 Australian federal election: Grey
PartyCandidateVotes%±%
Liberal Barry Wakelin 42,27054.61+6.91
Labor Con O'Neill24,34531.45+0.83
One Nation Sylvia Holland5,2766.82−6.19
Democrats Gil Robertson3,6724.74−0.41
Greens Felicity Martin1,8452.38+2.38
Total formal votes77,40895.43−0.31
Informal votes3,7084.57+0.31
Turnout 81,11694.95
Two-party-preferred result
Liberal Barry Wakelin 46,87660.56+1.53
Labor Con O'Neill30,53239.44−1.53
Liberal hold Swing +1.53

Hindmarsh

2001 Australian federal election: Hindmarsh
PartyCandidateVotes%±%
Liberal Chris Gallus 35,11746.04+2.76
Labor Steve Georganas 29,18738.26−0.93
Democrats Caroline Dowd6,7648.87+1.45
Greens Deb Cashel2,7573.61+0.92
One Nation Peter Fitzpatrick2,4583.22−3.80
Total formal votes76,28394.22−1.21
Informal votes4,6775.78+1.21
Turnout 80,96095.79
Two-party-preferred result
Liberal Chris Gallus 39,56451.86+0.63
Labor Steve Georganas 36,71948.14−0.63
Liberal hold Swing +0.63

Kingston

2001 Australian federal election: Kingston
PartyCandidateVotes%±%
Labor David Cox 31,12740.17+0.66
Liberal Dean Hersey30,08038.82+0.56
Democrats Graham Pratt9,07611.71+2.22
One Nation Charlie McCormack3,6344.69−4.59
Greens Deborah Guildner2,4373.14+3.14
No GST Gordon Arandelovic1,1361.47+1.47
Total formal votes77,49094.50−0.81
Informal votes4,5115.50+0.81
Turnout 82,00196.59
Two-party-preferred result
Labor David Cox 40,61852.42+0.54
Liberal Dean Hersey36,87247.58−0.54
Labor hold Swing +0.54

Makin

2001 Australian federal election: Makin
PartyCandidateVotes%±%
Liberal Trish Draper 36,97945.94+5.35
Labor Julie Woodman29,53936.70−1.14
Democrats Christine Posta8,34310.37+0.14
One Nation Rod Kowald3,7794.69−4.95
Greens Allon Reeves1,8502.30+2.30
Total formal votes80,49094.79−0.92
Informal votes4,4205.21+0.92
Turnout 84,91096.68
Two-party-preferred result
Liberal Trish Draper 43,27153.76+2.98
Labor Julie Woodman37,21946.24−2.98
Liberal hold Swing +2.98

Mayo

2001 Australian federal election: Mayo
PartyCandidateVotes%±%
Liberal Alexander Downer 41,25952.76+6.45
Labor Delia Brennan16,26920.80−0.73
Democrats John McLaren11,60714.84−6.98
Greens Dave Clark4,0845.22+5.22
One Nation Mike Thomas2,3663.03−4.52
Independent Bill Spragg2,3072.95+2.95
Independent Howie Coombe3100.40−0.25
Total formal votes78,20294.51−1.59
Informal votes4,5445.49+1.59
Turnout 82,74696.19
Two-party-preferred result
Liberal Alexander Downer 49,16262.87+2.97
Labor Delia Brennan29,04037.13−2.97
Liberal hold Swing N/A

Port Adelaide

2001 Australian federal election: Port Adelaide
PartyCandidateVotes%±%
Labor Rod Sawford 38,78350.77−2.33
Liberal Josh Krieg22,47429.42+3.61
Democrats Matilda Bawden7,3139.57+0.62
One Nation Andrew Phillips3,9325.15−3.83
Greens Brian Noone3,2104.20+4.08
Communist Michael Perth6720.88−0.16
Total formal votes76,38493.14−1.25
Informal votes5,6276.86+1.25
Turnout 82,01195.48
Two-party-preferred result
Labor Rod Sawford 49,37964.65−1.07
Liberal Josh Krieg27,00535.35+1.07
Labor hold Swing -1.07

Sturt

2001 Australian federal election: Sturt
PartyCandidateVotes%±%
Liberal Christopher Pyne 39,50850.73+2.84
Labor Lindsay Simmons 23,14329.72−2.03
Democrats Tim Farrow8,43810.83−1.25
Greens Mark Cullen3,2574.18+4.18
One Nation Brian Richards2,4513.15−2.87
Independent Neil Aitchison1,0811.39+1.39
Total formal votes77,87894.74−0.86
Informal votes4,3225.26+0.86
Turnout 82,20095.53
Two-party-preferred result
Liberal Christopher Pyne 45,31058.18+0.46
Labor Lindsay Simmons 32,56841.82−0.46
Liberal hold Swing +0.46

Wakefield

2001 Australian federal election: Wakefield
PartyCandidateVotes%±%
Liberal Neil Andrew 44,21656.24+6.27
Labor Tim Rowbottom19,48024.78+2.81
One Nation David Dwyer6,1727.85−8.59
Democrats Marcus Reseigh5,9427.56−0.14
Greens Pam Kelly2,8163.58+3.58
Total formal votes78,62694.52−0.57
Informal votes4,5585.48+0.57
Turnout 83,18496.69
Two-party-preferred result
Liberal Neil Andrew 50,76464.57−2.07
Labor Tim Rowbottom27,86135.43+2.07
Liberal hold Swing -2.07

See also

Related Research Articles

<span class="mw-page-title-main">Electorates of the Australian House of Representatives</span> Federal electorates in Australia

Electorates of the Australian House of Representatives are single member electoral districts for the lower house of the Parliament of the Commonwealth. There are currently 151 electorates.

<span class="mw-page-title-main">Division of Chifley</span> Australian federal electoral division

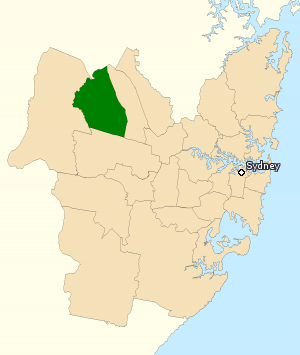
The Division of Chifley is an Australian electoral division in the state of New South Wales.

<span class="mw-page-title-main">Division of Ballarat</span> Australian federal electoral division

The Division of Ballarat is an Australian electoral division in the state of Victoria. The division was proclaimed in 1900, and was one of the original 65 divisions to be contested at the first federal election. It was named for the provincial city of the same name by Scottish squatter Archibald Yuille, who established the first settlement − his sheep run called Ballaarat − in 1837, with the name derived from a local Wathawurrung word for the area, balla arat, thought to mean "resting place".

<span class="mw-page-title-main">Division of Hasluck</span> Australian federal electoral division

The Division of Hasluck is an electoral division of the Australian House of Representatives, located in Western Australia.

In Australia, a redistribution is the process of redrawing the boundaries of electoral divisions for the House of Representatives arising from changes in population and changes in the number of representatives. There is no redistribution for the Senate as each State constitutes a division, though with multiple members. The Australian Electoral Commission (AEC), an independent statutory authority, oversees the apportionment and redistribution process for federal divisions, taking into account a number of factors. Politicians, political parties and the public may make submissions to the AEC on proposed new boundaries, but any interference with their deliberations is considered a serious offence.

This is a list of electoral results for the Division of Calare in Australian federal elections from the division's creation in 1906 until the present.

This is a list of electoral results for the Division of North Sydney in Australian federal elections from the electorate's creation in 1901 until the present.

This is a list of electoral results for the Division of Warringah in Australian federal elections from the division's creation in 1922 until the present.

This is a list of electoral results for the Division of Werriwa in Australian federal elections from the division's creation in 1901 until the present.

This is a list of electoral results for the Division of Adelaide in Australian federal elections from the division's creation in 1903 until the present.

This is a list of electoral results for the Division of Canberra in Australian federal elections from the division's creation in 1974 until the present.

This is a list of electoral results for the Division of Lyons in Australian federal elections from the division's creation in 1984 until the present.

<span class="mw-page-title-main">Results of the 2004 Australian federal election in South Australia</span>

This is a list of electoral division results for the Australian 2004 federal election in the state of South Australia.

This is a list of electoral division results for the Australian 2001 federal election for the Australian Capital Territory and the Northern Territory.

<span class="mw-page-title-main">Results of the 2001 Australian federal election in Tasmania</span>

This is a list of electoral division results for the Australian 2001 federal election in the state of Tasmania.

<span class="mw-page-title-main">Results of the 2001 Australian federal election in Western Australia</span>

This is a list of electoral division results for the Australian 2001 federal election in the state of Western Australia.

<span class="mw-page-title-main">Results of the 2001 Australian federal election in Queensland</span>

This is a list of electoral division results for the Australian 2001 federal election in the state of Queensland.

<span class="mw-page-title-main">Results of the 2001 Australian federal election in Victoria</span>

This is a list of electoral division results for the Australian 2001 federal election in the state of Victoria.

<span class="mw-page-title-main">Results of the 2001 Australian federal election in New South Wales</span>

This is a list of electoral division results for the Australian 2001 federal election in the state of New South Wales.

The following tables show results for the Australian House of Representatives at the 2001 federal election held on 10 November 2001. The parliament increased from 148 to 150 seats, with a new seat in Western Australia and a new seat in the Northern Territory.

References

  1. 1 2 "2001 First preference votes for South Australia". Australian Electoral Commission. Retrieved 8 June 2022.
  2. "2001 South Australia division results". Australian Electoral Commission. Retrieved 8 June 2022.
  3. 1 2 "2001 House of Representatives: South Australia". Psephos Adam Carr's Election Archive. Retrieved 8 June 2022.