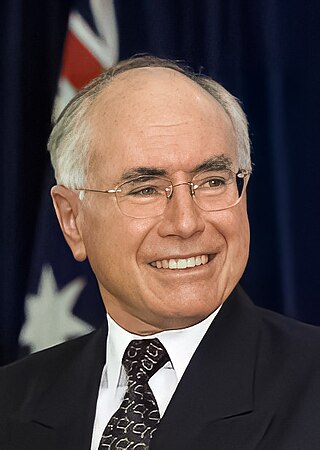
The 2001 Australian federal election was held in Australia on 10 November 2001. All 150 seats in the House of Representatives and 40 seats in the 76-member Senate were up for election. The incumbent Liberal Party of Australia led by Prime Minister of Australia John Howard and coalition partner the National Party of Australia led by John Anderson defeated the opposition Australian Labor Party led by Kim Beazley. Future Opposition Leader Peter Dutton entered parliament at this election. As of 2023 this was the most recent federal election to have a rematch in 11 years, and the most recent repeated election when Howard beat Beazley just 3 years earlier and until 2013 to have both major party leaders running in previous federal elections as major party leaders when in 2013, and the last for both major party leaders to appear in consecutive federal elections in 24 years.

Electorates of the Australian House of Representatives are single member electoral districts for the lower house of the Parliament of the Commonwealth. There are currently 151 electorates.
Legalise Cannabis Australia (LCA), also known as the Legalise Cannabis Party (LCP) and formerly the Help End Marijuana Prohibition (HEMP) Party, is a single-issue Australian political party. It has a number of policies that centre around the re-legalisation and regulation of cannabis for personal, medicinal and industrial uses in Australia.
In Australia, a redistribution is the process of redrawing the boundaries of electoral divisions for the House of Representatives arising from changes in population and changes in the number of representatives. There is no redistribution for the Senate as each State constitutes a division, though with multiple members. The Australian Electoral Commission (AEC), an independent statutory authority, oversees the apportionment and redistribution process for federal divisions, taking into account a number of factors. Politicians, political parties and the public may make submissions to the AEC on proposed new boundaries, but any interference with their deliberations is considered a serious offence.
This is a list of electoral results for the Division of Calare in Australian federal elections from the division's creation in 1906 until the present.
This is a list of electoral results for the Division of North Sydney in Australian federal elections from the electorate's creation in 1901 until the present.
This is a list of electoral results for the Division of Bass in Australian federal elections from the division's creation in 1903 until the present.
This is a list of electoral results for the Division of Braddon in Australian federal elections from the division's creation in 1955 until the present.
This is a list of electoral results for the Division of Denison in Australian federal elections from the division's creation in 1903 until it was abolished in 2019 and replaced with Clark.
This is a list of electoral results for the Division of Lyons in Australian federal elections from the division's creation in 1984 until the present.
This is a list of electoral results for the Division of Franklin in Australian federal elections from the division's creation in 1903 until the present.
This is a list of electoral results for the Division of Darwin in Australian federal elections from the division's creation in 1903 until its abolition in 1955.
This is a list of electoral results for the Division of Wilmot in Australian federal elections from the division's creation in 1903 until its abolition in 1984.

The 2019 Australian federal election was held on Saturday 18 May 2019 to elect members of the 46th Parliament of Australia. The election had been called following the dissolution of the 45th Parliament as elected at the 2016 double dissolution federal election. All 151 seats in the House of Representatives and 40 of the 76 seats in the Senate were up for election.
The following tables show state-by-state results in the Australian House of Representatives at the 2016 federal election, Coalition 76, Labor 69, Australian Greens 1, Nick Xenophon Team 1, Katter's Australian Party 1, with 2 independents.

The Tasmanian Nationals are a political party in the Australian state of Tasmania, aligned with the National Party of Australia. The party is not currently registered with the Tasmanian Electoral Commission, and is not separately registered with the Australian Electoral Commission, unlike the other state branches of the Nationals.

This is a list of electoral division results for the Australian 2007 federal election in the state of Tasmania.

This is a list of electoral division results for the Australian 2004 federal election in the state of Tasmania.
The following tables show results for the Australian House of Representatives at the 2001 federal election held on 10 November 2001. The parliament increased from 148 to 150 seats, with a new seat in Western Australia and a new seat in the Northern Territory.


