| |||||||||||||||||||||||||||||||||||||
All 15 Western Australian seats in the Australian House of Representatives and 6 seats in the Australian Senate | |||||||||||||||||||||||||||||||||||||
---|---|---|---|---|---|---|---|---|---|---|---|---|---|---|---|---|---|---|---|---|---|---|---|---|---|---|---|---|---|---|---|---|---|---|---|---|---|
|
2001 Australian federal election |
---|
National results |
State and territory results |
This is a list of electoral division results for the Australian 2001 federal election in the state of Western Australia. [1] [2] [3]
Party | Votes | % | Swing | Seats | Change | ||
---|---|---|---|---|---|---|---|
Liberal | 449,036 | 41.39 | +3.24 | 8 | 1 | ||
Labor | 402,927 | 37.14 | -0.29 | 7 | |||
One Nation | 67,992 | 6.27 | -3.01 | ||||
Greens | 64,939 | 5.99 | +0.93 | ||||
Democrats | 50,581 | 4.66 | +0.70 | ||||
Liberals for Forests | 13,116 | 1.21 | |||||
Christian Democrats | 12,792 | 1.18 | |||||
National | 11,052 | 1.02 | |||||
Independent | 6,957 | 0.64 | |||||
Citizens Electoral Council | 2,907 | 0.27 | |||||
Curtin Labor Alliance | 2,496 | 0.23 | |||||
Total | 1,084,795 | 15 | 1 | ||||
Two-party-preferred vote | |||||||
Liberal | 559,926 | 51.62 | 1.08 | 8 | 1 | ||
Labor | 524,869 | 48.38 | -1.08 | 7 |
Party | Candidate | Votes | % | ±% | |
---|---|---|---|---|---|
Labor | Kim Beazley | 36,917 | 51.71 | −1.38 | |
Liberal | Margaret Thomas | 17,110 | 23.97 | −2.47 | |
Liberals for Forests | Keith Woollard | 8,006 | 11.21 | +11.21 | |
One Nation | Steve Robbie | 4,380 | 6.14 | −5.82 | |
Greens | Kate Davis | 2,486 | 3.48 | +0.58 | |
Democrats | Paul Hubbard | 1,706 | 2.39 | −2.47 | |
Christian Democrats | Terry Iredale | 621 | 0.87 | +0.29 | |
Citizens Electoral Council | Brian McCarthy | 164 | 0.23 | +0.23 | |
Total formal votes | 71,390 | 95.69 | +1.17 | ||
Informal votes | 3,214 | 4.31 | −1.17 | ||
Turnout | 74,604 | 95.98 | |||
Two-party-preferred result | |||||
Labor | Kim Beazley | 42,869 | 60.05 | −3.32 | |
Liberal | Margaret Thomas | 28,521 | 39.95 | +3.32 | |
Labor hold | Swing | −3.32 |
Party | Candidate | Votes | % | ±% | |
---|---|---|---|---|---|
Liberal | Don Randall | 28,947 | 41.84 | +3.30 | |
Labor | Jane Gerick | 26,490 | 38.29 | +0.71 | |
One Nation | Angelo Dacheff | 4,976 | 7.19 | −5.64 | |
Greens | Keith Read | 3,711 | 5.36 | +1.24 | |
Democrats | Darren Brown | 2,639 | 3.81 | +0.16 | |
Christian Democrats | Doug Kennedy | 1,779 | 2.57 | +0.85 | |
Citizens Electoral Council | John Macdonald | 648 | 0.94 | +0.76 | |
Total formal votes | 69,190 | 94.86 | −0.51 | ||
Informal votes | 3,746 | 5.14 | +0.51 | ||
Turnout | 72,936 | 95.72 | |||
Two-party-preferred result | |||||
Liberal | Don Randall | 34,860 | 50.38 | +0.42 | |
Labor | Jane Gerick | 34,330 | 49.62 | −0.42 | |
Liberal gain from Labor | Swing | +0.42 |
Party | Candidate | Votes | % | ±% | |
---|---|---|---|---|---|
Labor | Graham Edwards | 34,703 | 47.75 | +4.14 | |
Liberal | Andre Shannon | 26,250 | 36.12 | −2.72 | |
One Nation | Ron Holt | 4,130 | 5.68 | −2.39 | |
Democrats | Tracy Chaloner | 3,111 | 4.28 | +0.34 | |
Greens | Dave Fort | 2,951 | 4.06 | +0.16 | |
Christian Democrats | Paul Salmon | 1,117 | 1.54 | +0.36 | |
National | Sue Metcalf | 410 | 0.56 | +0.56 | |
Total formal votes | 72,672 | 95.33 | −0.84 | ||
Informal votes | 3,564 | 4.67 | +0.84 | ||
Turnout | 76,236 | 96.06 | |||
Two-party-preferred result | |||||
Labor | Graham Edwards | 40,341 | 55.51 | +2.40 | |
Liberal | Andre Shannon | 32,331 | 44.49 | −2.40 | |
Labor hold | Swing | +2.40 |
Party | Candidate | Votes | % | ±% | |
---|---|---|---|---|---|
Liberal | Julie Bishop | 41,863 | 55.16 | +10.59 | |
Labor | Trish Fowler | 17,789 | 23.44 | +0.69 | |
Greens | Steve Walker | 7,019 | 9.25 | +2.93 | |
Democrats | Ashley Buckley | 4,863 | 6.41 | +1.60 | |
One Nation | Neil Gilmour | 1,840 | 2.42 | −1.28 | |
Liberals for Forests | G. Wood | 1,750 | 2.31 | +2.31 | |
Christian Democrats | Karen McDonald | 763 | 1.01 | +1.01 | |
Total formal votes | 75,887 | 96.70 | −0.57 | ||
Informal votes | 2,590 | 3.30 | +0.57 | ||
Turnout | 78,477 | 95.65 | |||
Two-party-preferred result | |||||
Liberal | Julie Bishop | 48,502 | 63.91 | +0.43 | |
Labor | Trish Fowler | 27,385 | 36.09 | −0.43 | |
Liberal hold | Swing | +0.43 |
Party | Candidate | Votes | % | ±% | |
---|---|---|---|---|---|
Liberal | Geoff Prosser | 34,392 | 46.03 | +3.79 | |
Labor | Tresslyn Smith | 22,872 | 30.61 | −0.10 | |
One Nation | Alan Giorgi | 7,510 | 10.05 | −1.88 | |
Greens | Paul Llewellyn | 5,359 | 7.17 | +1.07 | |
Democrats | Alison Wylie | 2,477 | 3.31 | +0.27 | |
National | Charles Caldwell | 1,397 | 1.87 | −1.09 | |
Curtin Labor Alliance | Megan Kirwan | 433 | 0.58 | +0.58 | |
Citizens Electoral Council | Arthur Harvey | 281 | 0.38 | +0.25 | |
Total formal votes | 74,721 | 94.95 | +0.08 | ||
Informal votes | 3,976 | 5.05 | −0.08 | ||
Turnout | 78,697 | 96.36 | |||
Two-party-preferred result | |||||
Liberal | Geoff Prosser | 43,049 | 57.61 | +3.01 | |
Labor | Tresslyn Smith | 31,672 | 42.39 | −3.01 | |
Liberal hold | Swing | +3.01 |
Party | Candidate | Votes | % | ±% | |
---|---|---|---|---|---|
Labor | Carmen Lawrence | 34,054 | 47.01 | −2.33 | |
Liberal | Louise Smyth | 22,025 | 30.40 | +0.08 | |
Greens | Robert Delves | 6,565 | 9.06 | +2.07 | |
One Nation | Chris Reynolds | 4,308 | 5.95 | −1.75 | |
Democrats | Rod Swift | 3,878 | 5.35 | +0.91 | |
Christian Democrats | Michelle Shave | 1,025 | 1.41 | +1.41 | |
Sarah Harris | 588 | 0.81 | +0.81 | ||
Total formal votes | 72,443 | 94.28 | −1.50 | ||
Informal votes | 4,393 | 5.72 | +1.50 | ||
Turnout | 76,836 | 95.42 | |||
Two-party-preferred result | |||||
Labor | Carmen Lawrence | 43,952 | 60.72 | −1.57 | |
Liberal | Louise Smyth | 28,491 | 39.28 | +1.57 | |
Labor hold | Swing | -1.57 |
Party | Candidate | Votes | % | ±% | |
---|---|---|---|---|---|
Liberal | Bethwyn Chan | 27,660 | 39.33 | +2.49 | |
Labor | Sharryn Jackson | 26,890 | 38.23 | −1.15 | |
One Nation | James Hopkinson | 4,920 | 7.00 | −4.72 | |
Greens | Luke Edmonds | 3,986 | 5.67 | +0.86 | |
Democrats | Peter Markham | 3,455 | 4.91 | +0.08 | |
Christian Democrats | Terry Ryan | 1,695 | 2.41 | +1.37 | |
Citizens Electoral Council | Ronnie McLean | 804 | 1.14 | +0.89 | |
Curtin Labor Alliance | Michael Daniels | 520 | 0.74 | +0.74 | |
National | Ros Hegarty | 401 | 0.57 | +0.24 | |
Total formal votes | 70,331 | 94.20 | −1.43 | ||
Informal votes | 4,334 | 5.80 | +1.43 | ||
Turnout | 74,665 | 95.75 | |||
Two-party-preferred result | |||||
Labor | Sharryn Jackson | 36,420 | 51.78 | −0.77 | |
Liberal | Bethwyn Chan | 33,911 | 48.22 | +0.77 | |
Labor notional hold | Swing | -0.77 |
Party | Candidate | Votes | % | ±% | |
---|---|---|---|---|---|
Liberal | Barry Haase | 28,810 | 42.60 | +14.57 | |
Labor | Paul Browning | 23,712 | 35.06 | +7.44 | |
One Nation | Robin Scott | 5,818 | 8.60 | +0.21 | |
Greens | Laurie Miller | 2,554 | 3.78 | −0.46 | |
Democrats | Don Hoddy | 2,383 | 3.52 | +1.52 | |
Independent | Clark Butson | 1,947 | 2.88 | +2.88 | |
National | Peter McCumstie | 1,379 | 2.04 | −3.94 | |
Independent | Neville Smith | 474 | 0.70 | +0.70 | |
Curtin Labor Alliance | Ian Burt | 447 | 0.66 | +0.66 | |
Citizens Electoral Council | Callum Payne | 111 | 0.16 | −0.11 | |
Total formal votes | 67,635 | 94.40 | −0.95 | ||
Informal votes | 4,010 | 5.60 | +0.95 | ||
Turnout | 71,645 | 86.84 | |||
Two-party-preferred result | |||||
Liberal | Barry Haase | 36,755 | 54.34 | +2.24 | |
Labor | Paul Browning | 30,880 | 45.66 | −2.24 | |
Liberal hold | Swing | +2.24 |
Party | Candidate | Votes | % | ±% | |
---|---|---|---|---|---|
Liberal | Mal Washer | 33,302 | 48.99 | +11.76 | |
Labor | Kim Young | 22,888 | 33.67 | +3.96 | |
Greens | Andrew Roy | 3,683 | 5.42 | +0.82 | |
Democrats | Clive Oliver | 3,391 | 4.99 | +1.13 | |
One Nation | John Evans | 3,078 | 4.53 | −1.83 | |
Independent | Geof Henderson | 1,640 | 2.41 | +2.41 | |
Total formal votes | 67,982 | 96.04 | −0.97 | ||
Informal votes | 2,802 | 3.96 | +0.97 | ||
Turnout | 70,784 | 95.96 | |||
Two-party-preferred result | |||||
Liberal | Mal Washer | 38,096 | 56.04 | +0.42 | |
Labor | Kim Young | 29,886 | 43.96 | −0.42 | |
Liberal hold | Swing | +0.42 |
Party | Candidate | Votes | % | ±% | |
---|---|---|---|---|---|
Liberal | Wilson Tuckey | 36,867 | 49.48 | +2.59 | |
Labor | Mark Pendlebury | 14,742 | 19.78 | +0.56 | |
One Nation | Ron McLean | 8,774 | 11.77 | −3.19 | |
National | Vicki Brown | 5,480 | 7.35 | −0.03 | |
Greens | Sandy Davis | 3,525 | 4.73 | −0.29 | |
Christian Democrats | Alistair McNabb | 1,611 | 2.16 | −0.02 | |
Democrats | Carole Pestana | 1,502 | 2.02 | −0.32 | |
Liberals for Forests | Donna Selby | 1,167 | 1.57 | +1.57 | |
Independent | Stephan Gyorgy | 509 | 0.68 | +0.68 | |
Citizens Electoral Council | Terry Iturbide | 338 | 0.45 | +0.18 | |
Total formal votes | 74,515 | 94.08 | −1.19 | ||
Informal votes | 4,693 | 5.92 | +1.19 | ||
Turnout | 79,208 | 95.88 | |||
Two-party-preferred result | |||||
Liberal | Wilson Tuckey | 51,484 | 69.09 | +2.52 | |
Labor | Mark Pendlebury | 23,031 | 30.91 | −2.52 | |
Liberal hold | Swing | +2.52 |
Party | Candidate | Votes | % | ±% | |
---|---|---|---|---|---|
Liberal | Judi Moylan | 31,509 | 44.83 | +4.45 | |
Labor | Liam Costello | 21,306 | 30.32 | +1.12 | |
One Nation | Ken Collins | 6,105 | 8.69 | −4.36 | |
Greens | Juanita Miller | 5,072 | 7.22 | +1.86 | |
Democrats | Jack Fox | 3,147 | 4.48 | −0.04 | |
National | Chris Nelson | 1,985 | 2.82 | +0.12 | |
Christian Democrats | Vivian Hill | 858 | 1.22 | +1.11 | |
Citizens Electoral Council | Stuart Smith | 299 | 0.43 | +0.05 | |
Total formal votes | 70,281 | 95.02 | −1.22 | ||
Informal votes | 3,682 | 4.98 | +1.22 | ||
Turnout | 73,963 | 95.33 | |||
Two-party-preferred result | |||||
Liberal | Judi Moylan | 56.87 | +1.68 | ||
Labor | Liam Costello | 43.13 | −1.68 | ||
Liberal hold | Swing | +1.68 |
Party | Candidate | Votes | % | ±% | |
---|---|---|---|---|---|
Labor | Stephen Smith | 35,389 | 47.88 | −1.88 | |
Liberal | Rod Webb | 23,894 | 32.33 | +1.95 | |
Greens | Alison Xamon | 5,437 | 7.36 | +1.27 | |
Democrats | Aaron Hewett | 5,381 | 7.28 | +2.63 | |
One Nation | Peter Gilberthorpe | 3,244 | 4.39 | −3.81 | |
Philip Chilton | 568 | 0.77 | +0.77 | ||
Total formal votes | 73,913 | 94.98 | −1.18 | ||
Informal votes | 3,907 | 5.02 | +1.18 | ||
Turnout | 77,820 | 95.25 | |||
Two-party-preferred result | |||||
Labor | Stephen Smith | 45,239 | 61.21 | −1.33 | |
Liberal | Rod Webb | 28,674 | 38.79 | +1.33 | |
Labor hold | Swing | -1.33 |
Party | Candidate | Votes | % | ±% | |
---|---|---|---|---|---|
Labor | Jann McFarlane | 31,774 | 41.24 | +0.39 | |
Liberal | Bob Cronin | 30,963 | 40.19 | −0.69 | |
Greens | Heather Aquilina | 4,608 | 5.98 | +1.03 | |
Democrats | Pat Olver | 4,572 | 5.93 | +1.65 | |
One Nation | Keith Thorogood | 3,041 | 3.95 | −2.66 | |
Liberals for Forests | Perry Jasper | 1,071 | 1.39 | +1.39 | |
Christian Democrats | Keith McEncroe | 1,022 | 1.33 | +1.33 | |
Total formal votes | 77,051 | 94.60 | −0.37 | ||
Informal votes | 4,395 | 5.40 | +0.37 | ||
Turnout | 81,446 | 95.22 | |||
Two-party-preferred result | |||||
Labor | Jann McFarlane | 39,740 | 51.58 | −0.58 | |
Liberal | Bob Cronin | 37,311 | 48.42 | +0.58 | |
Labor hold | Swing | -0.58 |
Party | Candidate | Votes | % | ±% | |
---|---|---|---|---|---|
Labor | Kim Wilkie | 29,220 | 41.27 | +1.13 | |
Liberal | Bev Brennan | 27,597 | 38.98 | −0.55 | |
Greens | Elena Jeffreys | 4,163 | 5.88 | +0.70 | |
Democrats | Paul McCutcheon | 4,043 | 5.71 | +0.85 | |
One Nation | Sandra Vinciullo | 3,292 | 4.65 | −3.26 | |
Christian Democrats | Colleen Tapley | 1,130 | 1.60 | +0.25 | |
Curtin Labor Alliance | Simon Makin | 1,096 | 1.55 | +1.55 | |
Citizens Electoral Council | Brian Smith | 262 | 0.37 | −0.41 | |
Total formal votes | 70,803 | 95.13 | −0.58 | ||
Informal votes | 3,628 | 4.87 | +0.58 | ||
Turnout | 74,431 | 94.78 | |||
Two-party-preferred result | |||||
Labor | Kim Wilkie | 36,844 | 52.04 | −0.71 | |
Liberal | Bev Brennan | 33,959 | 47.96 | +0.71 | |
Labor hold | Swing | -0.71 |
Party | Candidate | Votes | % | ±% | |
---|---|---|---|---|---|
Liberal | Daryl Williams | 37,847 | 49.81 | +1.46 | |
Labor | Sam Gowegati | 24,181 | 31.83 | −0.32 | |
Democrats | Andrew Ingram | 4,033 | 5.31 | −0.28 | |
Greens | Ben Stanwix | 3,820 | 5.03 | +0.23 | |
One Nation | Aaron Lumsdaine | 2,576 | 3.39 | −3.61 | |
Independent | Gordon Graham | 1,231 | 1.62 | +1.62 | |
Christian Democrats | Craig Watson | 1,171 | 1.54 | −0.14 | |
Liberals for Forests | Michael Lucas | 1,122 | 1.48 | +1.48 | |
Total formal votes | 75,981 | 95.96 | −0.93 | ||
Informal votes | 3,200 | 4.04 | +0.93 | ||
Turnout | 79,181 | 95.75 | |||
Two-party-preferred result | |||||
Liberal | Daryl Williams | 44,047 | 57.97 | +0.93 | |
Labor | Sam Gowegati | 31,934 | 42.03 | −0.93 | |
Liberal hold | Swing | +0.93 |
Electorates of the Australian House of Representatives are single member electoral districts for the lower house of the Parliament of the Commonwealth. There are currently 151 electorates.
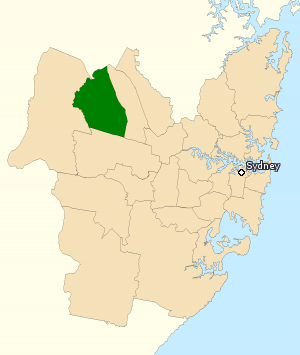
The Division of Chifley is an Australian electoral division in the state of New South Wales.
The Division of Ballarat is an Australian electoral division in the state of Victoria. The division was proclaimed in 1900, and was one of the original 65 divisions to be contested at the first federal election. It was named for the provincial city of the same name by Scottish squatter Archibald Yuille, who established the first settlement − his sheep run called Ballaarat − in 1837, with the name derived from a local Wathawurrung word for the area, balla arat, thought to mean "resting place".
The Division of Hasluck is an electoral division of the Australian House of Representatives, located in Western Australia.
In Australia, a redistribution is the process of redrawing the boundaries of electoral divisions for the House of Representatives arising from changes in population and changes in the number of representatives. There is no redistribution for the Senate as each State constitutes a division, though with multiple members. The Australian Electoral Commission (AEC), an independent statutory authority, oversees the apportionment and redistribution process for federal divisions, taking into account a number of factors. Politicians, political parties and the public may make submissions to the AEC on proposed new boundaries, but any interference with their deliberations is considered a serious offence.
This is a list of electoral results for the Division of Calare in Australian federal elections from the division's creation in 1906 until the present.
This is a list of electoral results for the Division of North Sydney in Australian federal elections from the electorate's creation in 1901 until the present.
This is a list of electoral results for the Division of Paterson in Australian federal elections from the division's creation in 1949 until its abolition in 1984, and then from its recreation in 1993 until the present.
This is a list of electoral results for the Division of Warringah in Australian federal elections from the division's creation in 1922 until the present.
This is a list of electoral results for the Division of Canning in Australian federal elections from the division's creation in 1949 until the present.
This is a list of electoral results for the Division of Canberra in Australian federal elections from the division's creation in 1974 until the present.
This is a list of electoral results for the Division of Braddon in Australian federal elections from the division's creation in 1955 until the present.
This is a list of electoral results for the Division of Lyons in Australian federal elections from the division's creation in 1984 until the present.
This is a list of electoral division results for the Australian 2001 federal election for the Australian Capital Territory and the Northern Territory.
This is a list of electoral division results for the Australian 2001 federal election in the state of Tasmania.
This is a list of electoral division results for the Australian 2001 federal election in the state of South Australia.
This is a list of electoral division results for the Australian 2001 federal election in the state of Queensland.
This is a list of electoral division results for the Australian 2001 federal election in the state of Victoria.
This is a list of electoral division results for the Australian 2001 federal election in the state of New South Wales.
The following tables show results for the Australian House of Representatives at the 2001 federal election held on 10 November 2001. The parliament increased from 148 to 150 seats, with a new seat in Western Australia and a new seat in the Northern Territory.