2022 Australian federal election |
---|
National results |
State and territory results |
This is a list of division results for the 2022 Australian federal election in the Australian Capital Territory and the Northern Territory.
This election was held using Instant-runoff voting. In this election, in the Australian Capital Territory (ACT) and the Northern Territory, there were no "turn-overs." In each district, the candidate leading in the first count took the seat, either in the first count or in the end.
| ||||||||||||||||||||||||||||||||||
All 3 Australian Capital Territory seats in the Australian House of Representatives and all 2 seats in the Australian Senate | ||||||||||||||||||||||||||||||||||
---|---|---|---|---|---|---|---|---|---|---|---|---|---|---|---|---|---|---|---|---|---|---|---|---|---|---|---|---|---|---|---|---|---|---|
| ||||||||||||||||||||||||||||||||||
Results by electorate. |
Party | Votes | % | Swing (pp) | Seats | Change (seats) | |||
---|---|---|---|---|---|---|---|---|
Australian Labor Party | 126,595 | 44.89 | +3.80 | 3 | ||||
Liberal Party of Australia | 74,759 | 26.51 | −4.81 | 0 | ||||
Australian Greens | 52,648 | 18.67 | +1.82 | 0 | ||||
United Australia Party | 6,864 | 2.43 | −0.25 | 0 | ||||
Pauline Hanson's One Nation | 6,630 | 2.35 | +2.35 | 0 | ||||
Liberal Democratic Party | 1,706 | 0.60 | 0.35 | 0 | ||||
Independent | 12,795 | 4.54 | +0.12 | 0 | ||||
Total | 281,997 | 100.00 | 3 | |||||
Invalid/blank votes | 7,116 | 2.46 | −1.03 | – | – | |||
Turnout | 289,113 | 92.07 | –1.08 | – | – | |||
Registered voters | 314,025 | – | – | – | – | |||
Two-party-preferred vote | ||||||||
Labor | 188,799 | 66.95 | +5.34 | – | – | |||
Liberal | 93,198 | 33.05 | –5.34 | – | – | |||
Source: AEC for both votes and seats |
Party | Candidate | Votes | % | ±% | |
---|---|---|---|---|---|
Labor | David Smith | 41,060 | 41.73 | +3.59 | |
Liberal | Jane Hiatt | 29,241 | 29.72 | −1.72 | |
Greens | Kathryn Savery | 14,559 | 14.80 | +1.71 | |
Independent | Jamie Christie | 8,023 | 8.15 | −0.12 | |
United Australia | Sean Conway | 2,831 | 2.88 | +0.48 | |
One Nation | Benjamin Ambard | 2,680 | 2.72 | +2.72 | |
Total formal votes | 98,394 | 97.12 | +2.27 | ||
Informal votes | 2,915 | 2.88 | −2.27 | ||
Turnout | 101,309 | 92.58 | −1.20 | ||
Two-party-preferred result | |||||
Labor | David Smith | 61,935 | 62.95 | +5.43 | |
Liberal | Jane Hiatt | 36,459 | 37.05 | −5.43 | |
Labor hold | Swing | +5.43 | |||
Party | Candidate | Votes | % | ±% | |
---|---|---|---|---|---|
Labor | Alicia Payne | 41,435 | 44.88 | +4.38 | |
Greens | Tim Hollo | 22,795 | 24.69 | +1.38 | |
Liberal | Slade Minson | 20,102 | 21.77 | −6.08 | |
Independent | Tim Bohm | 4,772 | 5.17 | +0.47 | |
United Australia | Catherine Smith | 1,687 | 1.83 | +0.25 | |
One Nation | James Miles | 1,531 | 1.66 | +1.66 | |
Total formal votes | 92,322 | 98.23 | +0.39 | ||
Informal votes | 1,668 | 1.77 | −0.39 | ||
Turnout | 93,990 | 92.08 | −0.54 | ||
Notional two-party-preferred count | |||||
Labor | Alicia Payne | 66,898 | 72.46 | +5.38 | |
Liberal | Slade Minson | 25,424 | 27.54 | −5.38 | |
Two-candidate-preferred result | |||||
Labor | Alicia Payne | 57,421 | 62.20 | −4.89 | |
Greens | Tim Hollo | 34,901 | 37.80 | +37.80 | |
Labor hold | |||||
Party | Candidate | Votes | % | ±% | |
---|---|---|---|---|---|
Labor | Andrew Leigh | 44,100 | 48.31 | +3.45 | |
Liberal | Nathan Kuster | 25,416 | 27.84 | −6.82 | |
Greens | Natasa Sojic | 15,294 | 16.75 | +2.33 | |
One Nation | Lucia Grant | 2,419 | 2.65 | +2.65 | |
United Australia | Timothy Elton | 2,346 | 2.57 | −1.50 | |
Liberal Democrats | Guy Jakeman | 1,706 | 1.87 | +1.87 | |
Total formal votes | 91,281 | 97.30 | +0.29 | ||
Informal votes | 2,533 | 2.70 | −0.29 | ||
Turnout | 93,814 | 91.51 | −1.50 | ||
Two-party-preferred result | |||||
Labor | Andrew Leigh | 59,966 | 65.69 | +5.13 | |
Liberal | Nathan Kuster | 31,315 | 34.31 | −5.13 | |
Labor hold | Swing | +5.13 | |||
| ||||||||||||||||||||||||||||||||||
All 2 Northern Territory seats in the Australian House of Representatives and all 2 seats in the Australian Senate | ||||||||||||||||||||||||||||||||||
---|---|---|---|---|---|---|---|---|---|---|---|---|---|---|---|---|---|---|---|---|---|---|---|---|---|---|---|---|---|---|---|---|---|---|
| ||||||||||||||||||||||||||||||||||
Results by electorate. |
Party | Votes | % | Swing (pp) | Seats | Change (seats) | |||
---|---|---|---|---|---|---|---|---|
Australian Labor Party | 38,522 | 38.16 | −4.11 | 2 | ||||
Country Liberal Party | 29,664 | 29.39 | −8.13 | 0 | ||||
Australian Greens | 13,182 | 13.06 | +2.91 | 0 | ||||
Liberal Democratic Party | 7,787 | 7.71 | +7.71 | 0 | ||||
Pauline Hanson's One Nation | 5,418 | 5.37 | +5.37 | 0 | ||||
United Australia Party | 4,510 | 4.47 | +1.62 | 0 | ||||
Australian Citizens Party | 497 | 0.49 | +0.49 | 0 | ||||
Independent | 1,357 | 1.34 | −3.30 | 0 | ||||
Total | 100,937 | 100.00 | 2 | |||||
Invalid/blank votes | 5,658 | 5.31 | +0.62 | – | – | |||
Turnout | 106,595 | 73.08 | –4.86 | – | – | |||
Registered voters | 145,851 | – | – | – | – | |||
Two-party-preferred vote | ||||||||
Labor | 56,065 | 55.54 | +1.34 | – | – | |||
Liberal | 44,872 | 44.46 | –1.34 | – | – | |||
Source: AEC for both votes and seats |
Party | Candidate | Votes | % | ±% | |
---|---|---|---|---|---|
Labor | Marion Scrymgour | 16,747 | 36.56 | −8.24 | |
Country Liberal | Damien Ryan | 15,893 | 34.69 | −2.22 | |
Greens | Blair McFarland | 5,018 | 10.95 | +2.71 | |
One Nation | Tim Gallard | 2,470 | 5.39 | +5.39 | |
Liberal Democrats | George Kasparek | 1,948 | 4.25 | +4.25 | |
United Australia | Allan McLeod | 1,882 | 4.11 | +1.29 | |
Independent | Michael Gravener | 948 | 2.07 | +2.07 | |
Australian Citizens | Thong Sum Lee | 497 | 1.08 | +1.08 | |
Independent | Imelda Adamson Agars | 409 | 0.89 | +0.89 | |
Total formal votes | 45,812 | 92.63 | −2.32 | ||
Informal votes | 3,647 | 7.37 | +2.32 | ||
Turnout | 49,459 | 66.83 | −6.02 | ||
Two-party-preferred result | |||||
Labor | Marion Scrymgour | 23,339 | 50.95 | −4.51 | |
Country Liberal | Damien Ryan | 22,473 | 49.05 | +4.51 | |
Labor hold | Swing | −4.51 | |||
Party | Candidate | Votes | % | ±% | |
---|---|---|---|---|---|
Labor | Luke Gosling | 21,775 | 39.50 | −0.54 | |
Country Liberal | Tina Macfarlane | 13,771 | 24.98 | −13.07 | |
Greens | Aiya Goodrich Carttling | 8,164 | 14.81 | +2.97 | |
Liberal Democrats | Kylie Bonanni | 5,839 | 10.59 | +10.59 | |
One Nation | Emily Lohse | 2,948 | 5.35 | +5.35 | |
United Australia | Tayla Selfe | 2,628 | 4.77 | +1.90 | |
Total formal votes | 55,125 | 96.48 | +0.85 | ||
Informal votes | 2,011 | 3.52 | −0.85 | ||
Turnout | 57,136 | 79.53 | −3.55 | ||
Two-party-preferred result | |||||
Labor | Luke Gosling | 32,726 | 59.37 | +6.29 | |
Country Liberal | Tina Macfarlane | 22,399 | 40.63 | −6.29 | |
Labor hold | Swing | +6.29 | |||
The Division of Canberra is an Australian electoral division in the Australian Capital Territory. It is named for the city of Canberra, Australia's national capital, and includes all of central Canberra, Kowen, Majura, as well as part of Weston Creek, Woden Valley, Molonglo Valley, Belconnen, and Jerrabomberra. It is currently held by Alicia Payne of the Labor Party.
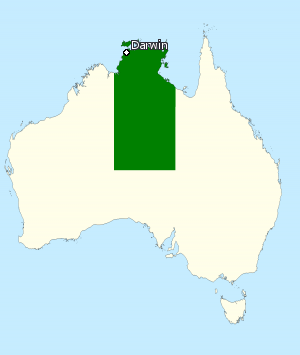
The Division of Lingiari is an Australian electoral division in the Northern Territory that covers the entirety of the territory outside of the Division of Solomon, which covers Darwin and surrounding areas. The division also includes the Christmas and Cocos (Keeling) Islands.
The Division of Solomon is an Australian Electoral Division in the Northern Territory. It is largely coextensive with the Darwin/Palmerston metropolitan area. The only other division in the territory, the Division of Lingiari, covers the remainder of the territory.
In Australia, a redistribution is the process of redrawing the boundaries of electoral divisions for the House of Representatives arising from changes in population and changes in the number of representatives. There is no redistribution for the Senate as each State constitutes a division, though with multiple members. The Australian Electoral Commission (AEC), an independent statutory authority, oversees the apportionment and redistribution process for federal divisions, taking into account a number of factors. Politicians, political parties and the public may make submissions to the AEC on proposed new boundaries, but any interference with their deliberations is considered a serious offence.
Adam Graham Giles is an Australian former politician and former Chief Minister of the Northern Territory (2013–2016) as well as the former leader of the Country Liberal Party (CLP) in the unicameral Northern Territory Parliament. Giles was the first Indigenous Australian to serve as a head of government in Australia.
The 2016 Northern Territory general election was held on Saturday 27 August 2016 to elect all 25 members of the Legislative Assembly in the unicameral Northern Territory Parliament.
This is a list of electoral results for the Division of Lingiari in Australian federal elections from the division's creation in 2001 until the present.
This is a list of electoral results for the Division of Solomon in Australian federal elections from the division's creation in 2001 until the present.
This is a list of electoral results for the Division of Canberra in Australian federal elections from the division's creation in 1974 until the present.
The National Tally Room was the Australian centre for federal election results to be tallied for electorates and Senate quotas, making up the Parliament of Australia, which consists of the House of Representatives and the Senate. The Tally Room was operated by the Australian Electoral Commission (AEC) between 1972 and 2010.
Natasha Louise Griggs is an Australian former politician and the administrator of the Australian Indian Ocean Territories from 2017 to 2022.
Luke John Anthony Gosling, is an Australian politician and a retired Australian Army officer. Gosling has been the Australian Labor Party member for the Australian House of Representatives seat of Solomon in the Northern Territory since the 2016 federal election.
The 2020 Northern Territory general election was held on 22 August 2020 to elect all 25 members of the Legislative Assembly in the unicameral Northern Territory Parliament.
The Division of Bean is an electoral division for the Australian House of Representatives in the Australian Capital Territory (ACT) and Norfolk Island, which was created in 2018 and contested for the first time at the 2019 federal election.
This is a list of division results for the 2019 Australian federal election in the Australian Capital Territory and the Northern Territory.
These are the results for the Australian Senate at the 2019 Australian federal election.
This is a list of electoral division results for the 2022 Australian federal election in the state of New South Wales.
The 2022 Australian federal election was held on 21 May 2022 to elect all 151 members of the Australian House of Representatives and 40 of 76 members of the Australian Senate. Of those, 15 MPs and 6 senators were elected to represent the state of Western Australia. In this election, the Australian Labor Party led by Anthony Albanese took 4 House seats from the opposing Liberal Party of Australia, thereby gaining the majority of Western Australia's lower house seats for the first time since 1990. The Liberals under Scott Morrison lost a total of 6 seats, including all but 2 of its seats in the Perth metropolitan area.
The 2022 Australian federal election in the Senate was held on 21 May 2022 to elect 40 of the 76 senators in the Australian Senate, after a six-week campaign. Senators elected at this election are scheduled to take office on 1 July 2022, with the exception of the Senators elected from two territories whose terms commence from election day. The elected senators sit alongside continuing senators elected in 2019 as part of the 47th Parliament of Australia.