The Division of Greenway is an Australian electoral division in the state of New South Wales.

The Division of Macquarie is an Australian electoral division in the state of New South Wales. The division was created in 1900 and was one of the original 65 divisions contested at the first federal election. It is named for Lachlan Macquarie, who was Governor of New South Wales between 1810 and 1821.

The Division of Parramatta is an Australian electoral division in the state of New South Wales. The division was created in 1900 and was one of the original 65 divisions contested at the first federal election. It is named for the locality of Parramatta. The name Parramatta has been sourced to an Aboriginal word for the area. The Darug people had lived in the area for many generations, and regarded the area as a food bowl, rich in food from the river and forests. They called the area Baramada or Burramatta ("Parramatta") which means "the place where the eels lie down".

The Division of Lyne is an Australian electoral division in the state of New South Wales.
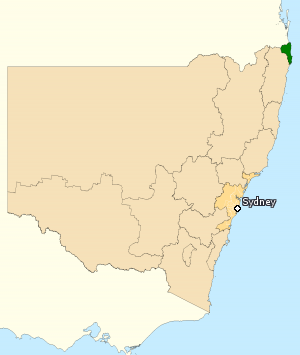
The Division of Richmond is an Australian electoral division in the state of New South Wales.

The Division of Mitchell is an Australian electoral division in the state of New South Wales.

The Division of Page is an Australian electoral division in the state of New South Wales.

Marrickville was an electoral district of the Legislative Assembly in the Australian state of New South Wales. It was an urban electorate in Sydney's inner west, centred on the suburb of Marrickville from which it took its name. At the time of its abolition it also included the suburbs of Camperdown, Darlington, Enmore, Lewisham, Newtown, Petersham, Stanmore and parts of Dulwich Hill and Erskineville as well as the University of Sydney.
Charlestown is an electoral district of the Legislative Assembly in the Australian state of New South Wales. It has been represented by Jodie Harrison of the Labor Party since the Charlestown by-election on 25 October 2014.

Port Macquarie is an electoral district of the Legislative Assembly in the Australian state of New South Wales. It is represented by Leslie Williams of the Liberal Party.
This is a list of electoral results for the Division of Macquarie in Australian federal elections from the division's creation in 1901 until the present.

The 2011 New South Wales state election held on Saturday, 26 March 2011. The 16-year-incumbent Labor Party government led by Premier Kristina Keneally was defeated in a landslide by the Liberal–National Coalition opposition led by Barry O'Farrell.

This is a list of electoral division results for the Australian 2010 federal election in the state of New South Wales.

This is a list of electoral division results for the Australian 2013 federal election in the state of New South Wales.

This is a list of electoral division results for the 2016 Australian federal election in the state of New South Wales.

The 2023 New South Wales state election was held on 25 March 2023 to elect the 58th Parliament of New South Wales, including all 93 seats in the Legislative Assembly and 21 of the 42 seats in the Legislative Council. The election was conducted by the New South Wales Electoral Commission (NSWEC).

This is a list of electoral division results for the 2022 Australian federal election in the state of New South Wales.

This is a list of electoral division results in the Australian 2007 federal election for the state of New South Wales.
This is a list of electoral division results in the Australian 2004 federal election for the state of New South Wales.
This is a list of local government area results for the 2021 New South Wales local elections.