Electorates of the Australian House of Representatives are single member electoral districts for the lower house of the Parliament of the Commonwealth. There are currently 151 electorates.

The 1903 Australian federal election was held in Australia on 16 December 1903. All 75 seats in the House of Representatives, and 19 of the 36 seats in the Senate were up for election. The incumbent Protectionist Party minority government led by Prime Minister Alfred Deakin retained the most House of Representatives seats of the three parties and retained government with the parliamentary support of the Labour Party led by Chris Watson. The Free Trade Party led by George Reid remained in opposition.
In Australia, a redistribution is the process of redrawing the boundaries of electoral divisions for the House of Representatives arising from changes in population and changes in the number of representatives. There is no redistribution for the Senate as each State constitutes a division, though with multiple members. The Australian Electoral Commission (AEC), an independent statutory authority, oversees the apportionment and redistribution process for federal divisions, taking into account a number of factors. Politicians, political parties and the public may make submissions to the AEC on proposed new boundaries, but any interference with their deliberations is considered a serious offence.
The Tasmania First Party is a minor Australian political party which operates exclusively in the state of Tasmania. The party was begun by members of the Tasmanian Firearms Owners Association in response to the Howard government's 1996 National Firearms Agreement, which the party called a "unilateral imposition of unnecessarily restrictive firearm legislation, following the unique tragedy of Martin Bryant's Port Arthur protest[sic]."

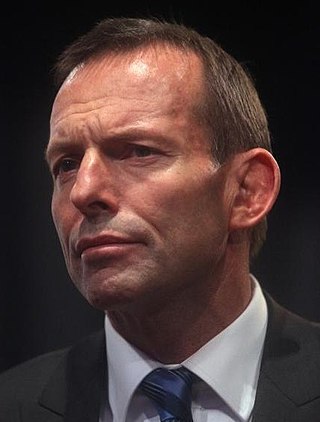
The 2010 Australian federal election was held on Saturday, 21 August 2010 to elect members of the 43rd Parliament of Australia. The incumbent centre-left Australian Labor Party led by Prime Minister Julia Gillard won a second term against the opposition centre-right Liberal Party of Australia led by Opposition Leader Tony Abbott and Coalition partner the National Party of Australia, led by Warren Truss, after Labor formed a minority government with the support of three independent MPs and one Australian Greens MP.
This is a list of electoral results for the Division of Bass in Australian federal elections from the division's creation in 1903 until the present.
This is a list of electoral results for the Division of Braddon in Australian federal elections from the division's creation in 1955 until the present.
This is a list of electoral results for the Division of Denison in Australian federal elections from the division's creation in 1903 until it was abolished in 2019 and replaced with Clark.
This is a list of electoral results for the Division of Lyons in Australian federal elections from the division's creation in 1984 until the present.
This is a list of electoral results for the Division of Franklin in Australian federal elections from the division's creation in 1903 until the present.
The following tables show state-by-state results in the Australian House of Representatives at the 2010 federal election, Labor 72, Coalition 72, Nationals (WA) 1, Australian Greens 1, with 4 independents.

This is a list of electoral division results for the Australian 2010 federal election in the state of New South Wales.

This is a list of electoral division results for the Australian 2010 federal election in the state of Victoria.

This is a list of electoral division results for the Australian 2010 federal election in the state of Queensland.

This is a list of electoral division results for the 2010 Australian federal election for the state of South Australia.

This is a list of electoral division results for the 2013 Australian federal election in the state of Tasmania.
The following tables show state-by-state results in the Australian House of Representatives at the 2016 federal election, Coalition 76, Labor 69, Australian Greens 1, Nick Xenophon Team 1, Katter's Australian Party 1, with 2 independents.

The Tasmanian Nationals are a political party in the Australian state of Tasmania, aligned with the National Party of Australia. The party is not currently registered with the Tasmanian Electoral Commission, and is not separately registered with the Australian Electoral Commission, unlike the other state branches of the Nationals.

This is a list of electoral division results for the Australian 2007 federal election in the state of Tasmania.

This is a list of electoral division results for the Australian 2001 federal election in the state of Tasmania.


