| ||||||||||||||||||||||||||||||||||
All 36 seats in the Senate 18 seats needed for a majority | ||||||||||||||||||||||||||||||||||
---|---|---|---|---|---|---|---|---|---|---|---|---|---|---|---|---|---|---|---|---|---|---|---|---|---|---|---|---|---|---|---|---|---|---|
|
The 5 September 1914 election was a double dissolution election which meant all 36 seats in the Senate were up for election, with each Australian states electing six members, with half to serve a six-year term and the rest to serve a three year term. Terms were taken to have commenced on 1 July 1914. The Senate resolved that in each State the three senators who received the most votes would sit for a six-year term, finishing on 30 June 1920 while the other half would sit for a three-year term, finishing on 30 June 1917. [1]
It was a landslide victory for the Labor Party, which won 31 seats and was the largest party by first preference votes in every state except South Australia. The opposition party, the Commonwealth Liberal Party, won just one seat, which was in South Australia, despite retaining four seats (two each in New South Wales and Tasmania). The Liberal Party lost three seats, one each in New South Wales, Victoria and Tasmania, while Labor lost one seat in New South Wales. Every state except Western Australia and South Australia swung to Labor.
Party | Votes | % | Swing | Seats | Change | |||
---|---|---|---|---|---|---|---|---|
6 year term | 3 year term | Total | ||||||
Labor | 6,119,018 | 52.15 | +3.43 | 17 | 14 | 31 | 2 | |
Liberal | 5,605,305 | 47.77 | −1.61 | 1 | 4 | 4 | 2 | |
Independents | 9,799 | 0.08 | −0.78 | |||||
Total | 11,734,122 | 18 | 18 | 36 | ||||
Invalid/blank votes | 86,649 | 4.24 | −1.42 | |||||
Turnout | 2,042,336 | 73.63 | −0.99 | |||||
Registered voters | 2,811,515 | |||||||
Source: Psephos: 1914 Senate |
Each elector voted for up to six candidates. Percentages refer to the number of voters rather than the number of votes.
Party | Candidate | Votes | % | ±% | |
---|---|---|---|---|---|
Labor | Albert Gardiner (elected 1) | 344,151 | 51.6 | +1.0 [lower-alpha 1] | |
Labor | Allan McDougall (elected 2) | 342,482 | 51.3 | +0.3 [lower-alpha 1] | |
Labor | John Grant (elected 3) | 341,934 | 51.2 | +6.0 [lower-alpha 2] | |
Liberal | Sir Albert Gould (re-elected 4) | 341,569 | 51.1 | −2.5 [lower-alpha 2] | |
Liberal | Edward Millen (re-elected 5) | 339,476 | 50.9 | −1.6 [lower-alpha 2] | |
Labor | David Watson (elected 6) | 338,280 | 50.7 | +5.7 [lower-alpha 2] | |
Liberal | Charles Oakes (defeated) | 333,763 | 50.0 | −2.3 [lower-alpha 2] | |
Labor | Arthur Rae (defeated) | 333,243 | 49.9 | +0.9 | |
Labor | Ike Smith | 324,630 | 48.6 | +6.1 [lower-alpha 2] | |
Liberal | Frank Coen | 324,152 | 48.6 | ||
Liberal | Herbert Pratten | 322,076 | 48.3 | ||
Liberal | Arthur Trethowan | 318,788 | 47.8 | ||
Total formal votes | 4,004,514 667,419 voters | 95.02 | +1.74 | ||
Informal votes | 34,948 | 4.98 | −1.74 | ||
Turnout | 702,403 | 64.85 | −4.34 | ||
Party total votes | |||||
Labor | 2,024,690 | 50.56 | +6.34 | ||
Liberal | 1,979,824 | 49.44 | −3.32 |
Each elector voted for up to six candidates. Percentages refer to the number of voters rather than the number of votes.
Party | Candidate | Votes | % | ±% | |
---|---|---|---|---|---|
Labor | Thomas Givens (re-elected 1) | 152,990 | 57.8 | +7.0 [lower-alpha 1] | |
Labor | Myles Ferricks (re-elected 2) | 152,469 | 57.6 | +2.8 [lower-alpha 2] | |
Labor | William Maughan (re-elected 3) | 152,321 | 57.5 | +2.8 [lower-alpha 2] | |
Labor | James Stewart (re-elected 4) | 151,553 | 57.3 | +7.6 [lower-alpha 1] | |
Labor | John Mullan (re-elected 5) | 150,703 | 56.9 | +6.4 [lower-alpha 2] | |
Labor | Harry Turley (re-elected 6) | 150,703 | 56.9 | +6.4 [lower-alpha 1] | |
Liberal | Thomas Crawford | 114,652 | 43.3 | ||
Liberal | William Aitchison | 113,317 | 42.8 | ||
Liberal | Frederick Johnson | 113,230 | 42.8 | ||
Liberal | Adolphus Jones | 112,640 | 42.6 | ||
Liberal | Edward Smith | 111,766 | 42.2 | ||
Liberal | Michael O'Donnell | 111,396 | 42.1 | ||
Total formal votes | 1,588,266 264,711 voters | 95.77 | +0.90 | ||
Informal votes | 11,693 | 4.23 | −0.90 | ||
Turnout | 276,404 | 75.07 | +1.77 | ||
Party total votes | |||||
Labor | 911,265 | 57.37 | +3.19 | ||
Liberal | 677,001 | 42.63 | −3.19 |
Each elector voted for up to six candidates. Percentages refer to the number of voters rather than the number of votes.
Party | Candidate | Votes | % | ±% | |
---|---|---|---|---|---|
Liberal | John Shannon (elected 1) | 190,590 | 96.1 [lower-alpha 3] | ||
Labor | John Newlands (re-elected 2) | 112,569 | 56.8 | +4.6 [lower-alpha 2] | |
Labor | James O'Loghlin (re-elected 3) | 112,283 | 56.6 | +4.1 [lower-alpha 2] | |
Labor | Robert Guthrie (re-elected 4) | 111,774 | 56.4 | +2.4 [lower-alpha 1] | |
Labor | William Senior (re-elected 5) | 109,975 | 55.5 | +4.4 [lower-alpha 2] | |
Labor | William Story (re-elected 6) | 108,263 | 54.6 | +8.1 [lower-alpha 1] | |
Liberal | Edward Vardon | 90,364 | 45.6 | ||
Liberal | Benjamin Benny | 89,568 | 45.2 | ||
Liberal | George Jenkins | 89,194 | 45.0 | ||
Liberal | George Stewart | 88,042 | 44.4 | ||
Liberal | Patrick Daley | 87,365 | 44.1 | ||
Total formal votes | 1,189,987 198,331 voters | 96.16 | +1.90 | ||
Informal votes | 7,913 | 3.84 | −1.90 | ||
Turnout | 206,244 | 80.14 | +0.04 | ||
Party total votes | |||||
Liberal | 635,123 | 53.37 | +6.97 | ||
Labor | 554,864 | 46.63 | −6.97 |
Sitting senator Gregor McGregor (Labor) had re-nominated but died after the close of nominations, leaving Labor with only 5 candidates. Electors were required to vote for 6 candidates or their vote would be invalid. If there was a large informal vote or if the surplus votes were equally distributed there was a risk of Labor losing more than one seat. Labor therefore asked its supporters to vote for John Shannon (Liberal). [5]
Each elector voted for up to six candidates. Percentages refer to the number of voters rather than the number of votes.
Party | Candidate | Votes | % | ±% | |
---|---|---|---|---|---|
Labor | David O'Keefe (re-elected 1) | 39,879 | 50.9 | −5.3 [lower-alpha 1] | |
Labor | James Long (re-elected 2) | 39,853 | 50.8 | −4.8 [lower-alpha 1] | |
Labor | James Guy (elected 3) | 39,656 | 50.6 | +6.2 [lower-alpha 2] | |
Liberal | John Keating (re-elected 4) | 39,193 | 50.0 | −2.3 [lower-alpha 2] | |
Labor | Rudolph Ready (re-elected 5) | 38,779 | 49.5 | −3.9 [lower-alpha 1] | |
Liberal | Thomas Bakhap (re-elected 6) | 38,779 | 49.5 | −3.3 [lower-alpha 2] | |
Labor | William Shoobridge | 38,096 | 48.6 | ||
Liberal | Edward Mulcahy | 38,016 | 48.5 | ||
Liberal | Louis Shoobridge | 38,006 | 48.5 | ||
Labor | James McDonald | 37,771 | 48.2 | ||
Liberal | John Clemons (defeated) | 36,577 | 46.7 | −4.0 [lower-alpha 2] | |
Liberal | Hubert Nichols | 36,325 | 46.3 | ||
Independent | Cyril Cameron | 6,979 | 8.9 | +2.8 [lower-alpha 2] | |
Independent | David Blanchard | 2,820 | 3.6 | ||
Total formal votes | 470,292 78,382 voters | 95.29 | +1.51 | ||
Informal votes | 3,871 | 4.71 | −1.51 | ||
Turnout | 82,253 | 77.61 | +2.30 | ||
Party total votes | |||||
Labor | 234,034 | 49.76 | +3.52 | ||
Liberal | 226,459 | 48.15 | −3.57 | ||
Independent | 9,799 | 2.08 | +0.04 |
Each elector voted for up to six candidates. Percentages refer to the number of voters rather than the number of votes.
Party | Candidate | Votes | % | ±% | |
---|---|---|---|---|---|
Labor | John Barnes (re-elected 1) | 334,782 | 53.7 | +4.5 [lower-alpha 2] | |
Labor | Stephen Barker (re-elected 2) | 334,517 | 53.6 | +5.2 [lower-alpha 1] | |
Labor | Edward Russell (re-elected 3) | 334,238 | 53.6 | +3.5 [lower-alpha 2] | |
Labor | Andrew McKissock (elected 4) | 333,739 | 53.5 | +4.5 [lower-alpha 2] | |
Labor | Albert Blakey (re-elected 5) | 331,911 | 53.2 | +5.1 [lower-alpha 1] | |
Labor | Edward Findley (re-elected 6) | 329,198 | 52.8 | +4.1 [lower-alpha 1] | |
Liberal | James McColl (defeated) | 294,104 | 47.2 | −2.5 [lower-alpha 2] | |
Liberal | Samuel Mauger | 293,353 | 47.0 | −1.8 [lower-alpha 2] | |
Liberal | William Edgar | 289,854 | 46.5 | ||
Liberal | James Hume Cook | 289,478 | 46.4 | ||
Liberal | William Trenwith | 289,196 | 46.4 | ||
Liberal | William McLean | 287,542 | 46.1 | ||
Total formal votes | 3,741,912 623,652 voters | 96.71 | +1.6 | ||
Informal votes | 21,246 | 3.29 | −1.2 | ||
Turnout | 644,898 | 79.15 | +3.66 | ||
Party total votes | |||||
Labor | 1,998,385 | 53.41 | +3.98 | ||
Liberal | 1,743,527 | 46.59 | −2.56 |
Each elector voted for up to six candidates. Percentages refer to the number of voters rather than the number of votes.
Party | Candidate | Votes | % | ±% | |
---|---|---|---|---|---|
Labor | George Pearce (re-elected 1) | 68,245 | 55.4 | −0.2 [lower-alpha 2] | |
Labor | Patrick Lynch (re-elected 2) | 66,189 | 53.7 | −0.4 [lower-alpha 2] | |
Labor | Ted Needham (re-elected 3) | 65,960 | 53.5 | −0.5 [lower-alpha 2] | |
Labor | George Henderson (re-elected 4) | 65,632 | 53.3 | −2.4 [lower-alpha 1] | |
Labor | Richard Buzacott (re-elected 5) | 65,303 | 53.0 | −1.2 [lower-alpha 2] | |
Labor | Hugh de Largie (re-elected 6) | 64,452 | 52.3 | +0.4 [lower-alpha 1] | |
Liberal | William Butcher | 61,288 | 49.7 | +3.9 [lower-alpha 2] | |
Liberal | William Dempster | 58,208 | 47.2 | ||
Liberal | George Throssell | 56,973 | 46.2 | ||
Liberal | John Thomson | 56,290 | 45.7 | ||
Liberal | Victor Spencer | 55,448 | 45.0 | ||
Liberal | Charles North | 55,164 | 44.8 | ||
Total formal votes | 739,152 123,192 voters | 94.67 | +1.3 | ||
Informal votes | 6,942 | 5.33 | −0.91 | ||
Turnout | 130,134 | 71.46 | −2.04 | ||
Party total votes | |||||
Labor | 395,781 | 53.55 | −1.03 | ||
Liberal | 343,371 | 46.45 | +1.03 |
The electoral system of Australia comprises the laws and processes used for the election of members of the Australian Parliament and is governed primarily by the Commonwealth Electoral Act 1918. The system presently has a number of distinctive features including compulsory enrolment; compulsory voting; majority-preferential instant-runoff voting in single-member seats to elect the lower house, the House of Representatives; and the use of the single transferable vote proportional representation system to elect the upper house, the Senate.
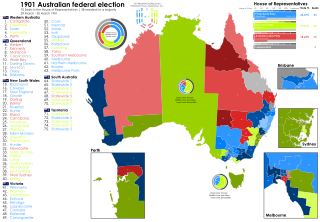
The 1901 Australian federal election for the inaugural Parliament of Australia was held in Australia on Friday 29 March and Saturday 30 March 1901. The elections followed Federation and the establishment of the Commonwealth of Australia on 1 January 1901. All 75 seats in the Australian House of Representatives, six of which were uncontested, as well as all 36 seats in the Australian Senate, were up for election.
The 1903 Australian federal election was held in Australia on 16 December 1903. All 75 seats in the House of Representatives, and 19 of the 36 seats in the Senate were up for election. The incumbent Protectionist Party minority government led by Prime Minister Alfred Deakin retained the most House of Representatives seats of the three parties and retained government with the parliamentary support of the Labour Party led by Chris Watson. The Free Trade Party led by George Reid remained in opposition.
Elections were held on 5 December 1964 to elect members to half of the 60 seats in the Australian Senate. There was no accompanying election to the House of Representatives, as Robert Menzies had called an early House-only election the previous year. As with the previous Senate election, the Coalition held exactly half of the seats in the chamber; the Democratic Labor Party and independent senator Reg Turnbull held the balance of power.
Elections were held on 25 November 1967 to elect half of the 60 seats in the Australian Senate. There was no accompanying election to the House of Representatives as the two election cycles had been out of synchronisation since 1963. The results were a setback for the government of Harold Holt. Having won a landslide victory at the House-only election the previous year, the Coalition instead lost two seats in the Senate. The Labor Party failed to make any gains in Gough Whitlam's first election as leader; the Democratic Labor Party gained two seats and held the balance of power until 1974.
The Centre Party, previously the Country Party, was a minor Australian political party in the state of Tasmania. Initially formed in 1962 as a new Tasmanian branch of the Country Party of Australia after decades of inactivity in the state, it at first enjoyed no electoral success. In the run up to the 1969 election the party was joined by Kevin Lyons, a former Liberal turned independent member of the Assembly for Braddon, who renamed it the Centre Party and retained his seat at the election, securing the balance of power and serving as Deputy Premier in a coalition government until 1972. Upon the coalition's collapse the Centre Party faded away before being dissolved in 1975.
The following tables show state-by-state results in the Australian Senate at the 1901 federal election. Senators total 17 Free Trade, 11 Protectionist, and eight Labour. The terms were deemed to start on 1 January 1901. In each state, the first three elected received full six-year terms, and the three senators elected with the lowest number of votes retire after three years.
Section 13 of the Constitution of Australia provides for three aspects of the terms of members of the Australian Senate: the timing of elections, the commencement date of their terms and for the Senate to allocate long (six-year) and short (three-year) terms following a double dissolution of the Parliament of Australia. While members of the House of Representatives and territory senators have a maximum three-year term, state senators have a fixed six-year term, subject only to the parliament being dissolved by a double dissolution.
The Tasmanian Nationals are a political party in the Australian state of Tasmania, aligned with the National Party of Australia. The party is not currently registered with the Tasmanian Electoral Commission, and is not separately registered with the Australian Electoral Commission, unlike the other state branches of the Nationals.
The Australian states each elected three members of the Australian Senate at the 1903 federal election to serve a six-year term starting on 1 January 1904.
The Australian states each elected three members of the Australian Senate at the 1906 federal election to serve a six-year term starting on 1 January 1907.
The Australian states each elected three members of the Australian Senate at the 1910 federal election to serve a six-year term starting on 1 July 1910.
The Australian states each elected three members of the Australian Senate at the 1913 federal election to serve a six-year term starting on 1 July 1913.
Special Senate elections were held on 26 November 1966 to elect members to fill casual vacancies in the Australian Senate for the states of New South Wales, Victoria, Queensland and Western Australia.
This is a list of electoral results for the Australian Senate in Victoria since Federation in 1901.
This is a list of electoral results for the Australian Senate in Western Australia since Federation in 1901.
This is a list of electoral results for the Australian Senate in South Australia since Federation in 1901.
This is a list of electoral results for the Australian Senate in Tasmania since Federation in 1901.
This is a list of electoral results for the Australian Senate in Queensland since Federation in 1901.
This is a list of electoral results for the Australian Senate in New South Wales since Federation in 1901.