This is a list of electoral results for the Electoral district of Portland in Victorian state elections.
First incarnation (1856–1904), Two members (1856–1859) | |||||||
---|---|---|---|---|---|---|---|
Member | Party | Term | Member | Party | Term | ||
Hugh Childers | None | 1856–1857 | Daniel Hughes | None | 1856–1859 | ||
John Findlay | None | 1857–1859 | |||||
Norman McLeod | None | 1859–1860 | |||||
William Haines | None | 1860–1864 | |||||
John MacPherson | None | 1864–1865 | |||||
Butler Aspinall | None | 1866–1867 | |||||
James Butters | None | 1868–1871 | |||||
Howard Spensley | None | 1871–1873 | |||||
Thomas Must | None | 1873–1877 | |||||
Thomas Cope | None | 1877–1880 | |||||
Henry Wrixon | None | 1880–1894 | |||||
Donald Norman McLeod | None | 1894–1900 | |||||
Ewen Cameron | Conservative | 1900–1904 | |||||
Second incarnation (1945–2002) | |||||||
Member | Party | Term | |||||
Robert Holt | ALP | 1945–1947 | |||||
Harry Hedditch | Country | 1947–1949 | |||||
Liberal and Country | 1949–1950 | ||||||
Robert Holt | ALP | 1950–1955 | |||||
George Gibbs | Liberal | 1955–1967 | |||||
Don McKellar | Liberal | 1967–1970 | |||||
Bill Lewis | ALP | 1970–1973 | |||||
Don McKellar | Liberal | 1973–1985 | |||||
Digby Crozier | Liberal | 1985–1988 | |||||
Denis Napthine | Liberal | 1988–2002 |
Party | Candidate | Votes | % | ±% | |
---|---|---|---|---|---|
Liberal | Denis Napthine | 12,093 | 44.4 | -11.3 | |
Labor | Lesley Ann Jackson | 8,016 | 29.4 | -5.1 | |
Independent | Patrick Kempton | 7,153 | 26.2 | +26.2 | |
Total formal votes | 27,262 | 98.1 | −0.2 | ||
Informal votes | 515 | 1.9 | +0.2 | ||
Turnout | 27,777 | 95.3 | |||
Two-party-preferred result | |||||
Liberal | Denis Napthine | 14,868 | 54.5 | -5.9 | |
Labor | Lesley Ann Jackson | 12,394 | 45.5 | +5.9 | |
Liberal hold | Swing | -5.9 |
Party | Candidate | Votes | % | ±% | |
---|---|---|---|---|---|
Liberal | Denis Napthine | 15,801 | 55.7 | -11.4 | |
Labor | Bill Sharrock | 9,781 | 34.5 | +1.6 | |
Independent | Bernard Wallace | 2,156 | 7.6 | +7.6 | |
Natural Law | Marguerite White | 626 | 2.2 | +2.2 | |
Total formal votes | 28,364 | 98.3 | +1.0 | ||
Informal votes | 476 | 1.7 | −1.0 | ||
Turnout | 28,840 | 95.5 | |||
Two-party-preferred result | |||||
Liberal | Denis Napthine | 17,074 | 60.4 | -6.7 | |
Labor | Bill Sharrock | 11,177 | 39.6 | +6.7 | |
Liberal hold | Swing | -6.7 |
Party | Candidate | Votes | % | ±% | |
---|---|---|---|---|---|
Liberal | Denis Napthine | 19,409 | 67.1 | +20.5 | |
Labor | Bill Sharrock | 9,522 | 32.9 | -0.6 | |
Total formal votes | 28,931 | 97.3 | −1.1 | ||
Informal votes | 789 | 2.7 | +1.1 | ||
Turnout | 29,720 | 96.1 | |||
Liberal hold | Swing | +4.5 |
Party | Candidate | Votes | % | ±% | |
---|---|---|---|---|---|
Liberal | Denis Napthine | 12,451 | 46.10 | -4.16 | |
Labor | Bill Sharrock | 9,359 | 34.65 | +0.39 | |
National | Graeme Dawson | 5,197 | 19.24 | +3.76 | |
Total formal votes | 27,007 | 98.36 | −0.22 | ||
Informal votes | 451 | 1.64 | +0.22 | ||
Turnout | 27,458 | 93.56 | −1.29 | ||
Two-party-preferred result | |||||
Liberal | Denis Napthine | 16,527 | 61.22 | -1.69 | |
Labor | Bill Sharrock | 9,359 | 38.78 | +1.69 | |
Liberal hold | Swing | -1.69 |
Party | Candidate | Votes | % | ±% | |
---|---|---|---|---|---|
Liberal | Digby Crozier | 13,562 | 50.3 | -5.4 | |
Labor | Bill Sharrock | 9,244 | 34.3 | -4.2 | |
National | James Patterson | 4,176 | 15.5 | +15.5 | |
Total formal votes | 26,982 | 98.6 | |||
Informal votes | 388 | 1.4 | |||
Turnout | 27,370 | 94.9 | |||
Two-party-preferred result | |||||
Liberal | Digby Crozier | 17,080 | 63.3 | +4.7 | |
Labor | Bill Sharrock | 9,902 | 36.7 | -4.7 | |
Liberal hold | Swing | +4.7 |
Party | Candidate | Votes | % | ±% | |
---|---|---|---|---|---|
Liberal | Don McKellar | 13,903 | 55.5 | +13.0 | |
Labor | Bill Sharrock | 9,606 | 38.4 | +4.7 | |
Independent | David Wilson | 1,523 | 6.1 | +6.1 | |
Total formal votes | 25,032 | 98.8 | +0.2 | ||
Informal votes | 315 | 1.2 | −0.2 | ||
Turnout | 25,347 | 95.6 | +0.2 | ||
Two-party-preferred result | |||||
Liberal | Don McKellar | 14,714 | 58.8 | +0.8 | |
Labor | Bill Sharrock | 10,318 | 41.2 | -0.8 | |
Liberal hold | Swing | +0.8 |
Party | Candidate | Votes | % | ±% | |
---|---|---|---|---|---|
Liberal | Don McKellar | 10,294 | 42.5 | +0.9 | |
Labor | Bill Lewis | 8,166 | 33.7 | +1.0 | |
National | Roger Hallam | 5,765 | 23.8 | +2.0 | |
Total formal votes | 24,225 | 98.6 | −0.2 | ||
Informal votes | 24,569 | 95.4 | −0.1 | ||
Turnout | 24,569 | 95.4 | −0.1 | ||
Two-party-preferred result | |||||
Liberal | Don McKellar | 14,063 | 58.0 | -6.7 | |
Labor | Bill Lewis | 10,162 | 42.0 | +6.7 | |
Liberal hold | Swing | -6.7 |
Party | Candidate | Votes | % | ±% | |
---|---|---|---|---|---|
Liberal | Don McKellar | 9,992 | 41.6 | +3.5 | |
Labor | Bill Lewis | 7,839 | 32.7 | -10.2 | |
National | Clive Mitchell | 5,246 | 21.8 | +8.2 | |
Democratic Labor | Patrick Healy | 932 | 3.9 | -1.5 | |
Total formal votes | 24,009 | 98.8 | |||
Informal votes | 290 | 1.2 | |||
Turnout | 24,299 | 95.5 | |||
Two-party-preferred result | |||||
Liberal | Don McKellar | 15,530 | 64.7 | +11.1 | |
Labor | Bill Lewis | 8,479 | 35.3 | -11.1 | |
Liberal hold | Swing | +11.1 |
Party | Candidate | Votes | % | ±% | |
---|---|---|---|---|---|
Labor | Bill Lewis | 7,754 | 41.7 | +3.4 | |
Liberal | Don McKellar | 7,119 | 38.3 | +6.1 | |
Country | Diana Silvester | 2,709 | 14.6 | -6.1 | |
Democratic Labor | Maurice Purcell | 1,004 | 5.4 | -3.3 | |
Total formal votes | 18,586 | 98.2 | −0.3 | ||
Informal votes | 333 | 1.8 | +0.3 | ||
Turnout | 18,919 | 95.6 | −1.1 | ||
Two-party-preferred result | |||||
Liberal | Don McKellar | 10,245 | 54.6 | +7.4 | |
Labor | Bill Lewis | 8,341 | 45.4 | -7.4 | |
Liberal gain from Labor | Swing | +7.4 |
Party | Candidate | Votes | % | ±% | |
---|---|---|---|---|---|
Labor | Bill Lewis | 6,807 | 38.3 | +5.6 | |
Liberal | Don McKellar | 5,726 | 32.2 | +3.1 | |
Country | Alma Uebergang | 3,681 | 20.7 | -8.1 | |
Democratic Labor | Adrian McInerney | 1,547 | 8.7 | -0.8 | |
Total formal votes | 17,761 | 98.5 | +0.4 | ||
Informal votes | 272 | 1.5 | −0.4 | ||
Turnout | 18,033 | 96.7 | +0.1 | ||
Two-party-preferred result | |||||
Labor | Bill Lewis | 9,371 | 52.8 | +6.4 | |
Liberal | Don McKellar | 8,390 | 47.2 | -6.4 | |
Labor gain from Liberal | Swing | +6.4 |
Party | Candidate | Votes | % | ±% | |
---|---|---|---|---|---|
Labor | John McClure | 5,638 | 32.7 | -2.2 | |
Liberal | Don McKellar | 5,017 | 29.1 | -3.3 | |
Country | Clive Mitchell | 4,966 | 28.8 | +5.6 | |
Democratic Labor | Frederick Baulch | 1,641 | 9.5 | 0.0 | |
Total formal votes | 17,262 | 98.1 | |||
Informal votes | 338 | 1.9 | |||
Turnout | 17,600 | 96.6 | |||
Two-party-preferred result | |||||
Liberal | Don McKellar | 9,246 | 53.6 | -5.2 | |
Labor | John McClure | 8,016 | 46.4 | +5.2 | |
Liberal hold | Swing | -5.2 |
Party | Candidate | Votes | % | ±% | |
---|---|---|---|---|---|
Liberal and Country | George Gibbs | 7,948 | 36.1 | +3.0 | |
Labor | George Gowty | 6,784 | 30.8 | -2.3 | |
Democratic Labor | John Russell | 3,730 | 16.9 | -1.9 | |
Country | Leonard Mibus | 3,577 | 16.2 | +1.1 | |
Total formal votes | 22,039 | 98.6 | −0.1 | ||
Informal votes | 313 | 1.4 | +0.1 | ||
Turnout | 22,352 | 95.8 | +0.6 | ||
Two-party-preferred result | |||||
Liberal and Country | George Gibbs | 14,289 | 64.8 | +2.5 | |
Labor | George Gowty | 7,750 | 35.2 | -2.5 | |
Liberal and Country hold | Swing | +2.5 |
Party | Candidate | Votes | % | ±% | |
---|---|---|---|---|---|
Labor | George Gowty | 7,163 | 33.1 | -3.9 | |
Liberal and Country | George Gibbs | 7,160 | 33.1 | -13.3 | |
Democratic Labor | John Russell | 4,056 | 18.8 | +2.2 | |
Country | Stewart Price | 3,255 | 15.1 | +15.1 | |
Total formal votes | 21,634 | 98.7 | −0.6 | ||
Informal votes | 291 | 1.3 | +0.6 | ||
Turnout | 21,925 | 96.4 | +0.3 | ||
Two-party-preferred result | |||||
Liberal and Country | George Gibbs | 13,477 | 62.3 | +2.3 | |
Labor | George Gowty | 8,157 | 37.7 | -2.3 | |
Liberal and Country hold | Swing | +2.3 |
Party | Candidate | Votes | % | ±% | |
---|---|---|---|---|---|
Liberal and Country | George Gibbs | 9,741 | 46.4 | ||
Labor | Malcolm Gladman | 7,781 | 37.0 | ||
Democratic Labor | John Russell | 3,482 | 16.6 | ||
Total formal votes | 21,004 | 99.3 | |||
Informal votes | 155 | 0.7 | |||
Turnout | 21,159 | 96.1 | |||
Two-party-preferred result | |||||
Liberal and Country | George Gibbs | 12,603 | 60.0 | ||
Labor | Malcolm Gladman | 8,401 | 40.0 | ||
Liberal and Country hold | Swing |
Party | Candidate | Votes | % | ±% | |
---|---|---|---|---|---|
Labor | Malcolm Gladman | 6,753 | 37.3 | ||
Liberal and Country | George Gibbs | 5,629 | 31.1 | ||
Country | Cyril Brimblecombe | 2,886 | 16.0 | ||
Labor (A-C) | William O'Sullivan | 2,818 | 15.6 | ||
Total formal votes | 18,086 | 98.5 | |||
Informal votes | 275 | 1.5 | |||
Turnout | 18,361 | 96.2 | |||
Two-party-preferred result | |||||
Liberal and Country | George Gibbs | 10,495 | 58.0 | ||
Labor | Malcolm Gladman | 7,591 | 42.0 | ||
Liberal and Country hold | Swing |
Party | Candidate | Votes | % | ±% | |
---|---|---|---|---|---|
Labor | Robert Holt | 9,543 | 64.8 | +13.5 | |
Liberal and Country | Howard Turner | 5,190 | 35.2 | -3.0 | |
Total formal votes | 14,733 | 99.2 | −0.3 | ||
Informal votes | 117 | 0.8 | +0.3 | ||
Turnout | 14,850 | 96.1 | −0.1 | ||
Labor hold | Swing | +12.5 |
Party | Candidate | Votes | % | ±% | |
---|---|---|---|---|---|
Labor | Robert Holt | 7,392 | 51.3 | +3.8 | |
Liberal and Country | Harry Hedditch | 5,508 | 38.2 | +15.4 | |
Country | Charles Buerckner | 1,510 | 10.5 | -19.1 | |
Total formal votes | 14,410 | 99.5 | +0.3 | ||
Informal votes | 71 | 0.5 | −0.3 | ||
Turnout | 14,481 | 96.2 | +0.4 | ||
Two-party-preferred result | |||||
Labor | Robert Holt | 7,543 | 52.3 | +2.8 | |
Liberal and Country | Harry Hedditch | 6,867 | 47.7 | +47.7 | |
Labor gain from Liberal and Country | Swing | +2.8 |
Party | Candidate | Votes | % | ±% | |
---|---|---|---|---|---|
Labor | Robert Holt | 6,576 | 47.5 | -7.0 | |
Country | Harry Hedditch | 4,100 | 29.6 | -15.9 | |
Liberal | James Lindsey | 3,161 | 22.8 | +22.8 | |
Total formal votes | 13,837 | 99.2 | −0.3 | ||
Informal votes | 115 | 0.8 | +0.3 | ||
Turnout | 13,952 | 95.8 | +5.0 | ||
Two-party-preferred result | |||||
Country | Harry Hedditch | 6,994 | 50.5 | +5.0 | |
Labor | Robert Holt | 6,843 | 49.5 | -5.0 | |
Country gain from Labor | Swing | +5.0 |
Party | Candidate | Votes | % | ±% | |
---|---|---|---|---|---|
Labor | Robert Holt | 6,913 | 54.5 | ||
Country | Harry Hedditch | 5,779 | 45.5 | ||
Total formal votes | 12,692 | 99.5 | |||
Informal votes | 66 | 0.5 | |||
Turnout | 12,758 | 90.8 | |||
Labor gain from Country | Swing |
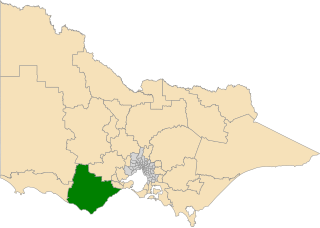
The electoral district of Polwarth is an electoral district of the Victorian Legislative Assembly. It is located in south-west rural Victoria, west of Geelong, and covers the Colac and Corangamite local government areas (LGA), parts of the Moyne, Golden Plains and Surf Coast LGAs, and slivers of the Ararat and Greater Geelong LGAs, running along the Great Ocean Road taking in Anglesea, Cape Otway, Peterborough, Aireys Inlet, Lorne, Wye River, Apollo Bay and Port Campbell, covering the inland towns of Winchelsea, Colac, Camperdown and Terang along the Princes Highway, and Inverleigh, Cressy, Lismore and Mortlake on the Hamilton Highway, and finally, includes the Otway Ranges and Lake Corangamite.
The electoral district of Thomastown is an electorate of the Victorian Legislative Assembly. It currently includes the suburbs of Lalor and Thomastown, and parts of Fawkner, Reservoir and Wollert, and has been in existence since 1985.
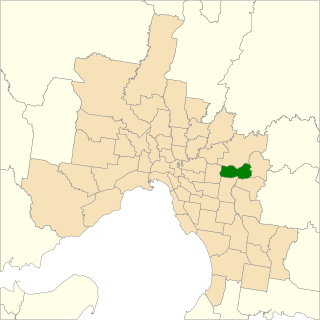
The electoral district of Evelyn is an electorate of the Victorian Legislative Assembly covering the urban fringe north east of Melbourne. It was first proclaimed in 1859.
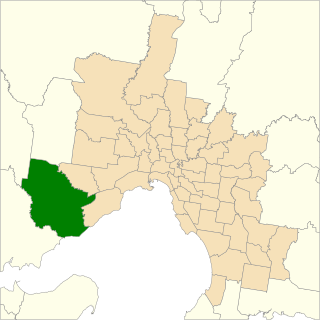
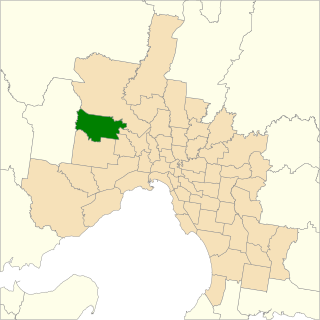
The electoral district of Kororoit is an electorate of the Victorian Legislative Assembly covering Albanvale, Caroline Springs as well as some parts of Deer Park and St Albans in the western suburbs of Melbourne.
The electoral district of Lowan is a rural Victorian Legislative Assembly electoral district of the Victorian Parliament. It is located within the Western Victoria Region of the Legislative Council. It was initially created by the Electoral Act Amendment Act 1888, taking effect at the 1889 elections. It is the state’s biggest electorate by area, covering about 41,858 km².
The electoral district of Sandringham is one of the electoral districts of Victoria, Australia, for the Victorian Legislative Assembly. It consists of the Melbourne bayside suburbs of Beaumaris, Black Rock and Sandringham, and parts of Cheltenham, Hampton, Highett, and Mentone.
The electoral district of Berwick is an electoral district of the Legislative Assembly in the Australian state of Victoria.
The electoral district of Werribee is an electoral district of the Legislative Assembly in the Australian state of Victoria. It has existed in two incarnations, first from 1976 to 2002, and was created again in the 2013 redistribution and came into effect at the 2014 state election.
This is a list of electoral results for the district of Mulgrave in Victorian state elections.
This is a list of electoral results for the Electoral district of Warrandyte in Victorian state elections.
The electoral district of Ringwood is an electoral district of the Victorian Legislative Assembly, located in the east of Melbourne. It was first proclaimed in 1958 and was abolished in 1992. Some of Ringwood was included in the new electoral district of Bayswater that year. Kay Setches, who was at the time the last member for Ringwood, contested and lost Bayswater at the 1992 election.
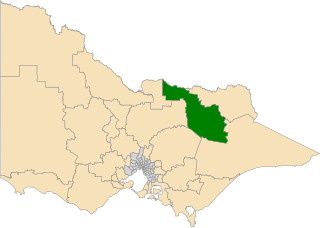
The electoral district of Eildon is an electoral district of the Victorian Legislative Assembly in Australia. It was created in the redistribution of electoral boundaries in 2013, which came into effect at the 2014 state election and is a member of the Northern Victoria Region.
The electoral district of Murray Plains is an electoral district of the Victorian Legislative Assembly in Australia. It was created in the redistribution of electoral boundaries in 2013, and came into effect at the 2014 state election.
The electoral district of Ovens Valley is an electoral district of the Victorian Legislative Assembly in Australia. It was created in the redistribution of electoral boundaries in 2013, and came into effect at the 2014 state election.
The electoral district of Sunbury is an electoral district of the Victorian Legislative Assembly in Australia. It was created in the redistribution of electoral boundaries in 2013, and came into effect at the 2014 state election.
The electoral district of Sydenham is an electoral district of the Victorian Legislative Assembly in Australia. It was created in the redistribution of electoral boundaries in 2013, and came into effect at the 2014 state election.
The Australian Federation Party (AFP), also known as AusFeds and formerly known as the Country Alliance and the Australian Country Party, is an Australian political party. Founded in 2004 by four rural Victorians, the party lodged its initial registration with the Victorian Electoral Commission on 15 August 2005.
The Electoral district of Laverton is an electoral district of the Victorian Legislative Assembly in Australia. It was created in the redistribution of electoral boundaries in 2021, and came into effect at the 2022 Victorian state election.
The electoral district of Greenvale is an electoral district of the Victorian Legislative Assembly in Australia. It was created in the redistribution of electoral boundaries in 2021, and came into effect at the 2022 Victorian state election.
The Electoral district of Kalkallo is an electoral district of the Victorian Legislative Assembly in Australia. It was created in the redistribution of electoral boundaries in 2021, and came into effect at the 2022 Victorian state election.