Electoral results for the district of Coburg

Last updated

This is a list of electoral results for the electoral district of Coburg in Victorian state elections.

Contents

Members for Coburg

MemberPartyTerm
  Frank Keane Labor Party 1927–1940
  Charlie Mutton Independent1940–1947
  Blackburn-Mutton Labor Party 1947–1950
  Progressive Labor Party 1950–1955
  Labor Party 1955–1967
  Jack Mutton Independent1967–1979
  Peter Gavin Labor Party 1979–1992
  Tom Roper Labor Party 1992–1994
  Carlo Carli Labor Party 1994–2002

Election results

Elections in the 1990s

1999

1999 Victorian state election: Coburg
PartyCandidateVotes%±%
Labor Carlo Carli 18,87764.7-0.3
Liberal Mark Hrycek7,76526.6-3.9
Greens Emma Rush2,5478.7+8.7
Total formal votes29,18995.9-1.0
Informal votes1,2484.1+1.0
Turnout 30,43786.1-6.0
Two-party-preferred result
Labor Carlo Carli 20,95171.8+4.9
Liberal Mark Hrycek8,23228.2-4.9
Labor hold Swing +4.9

1996

1996 Victorian state election: Coburg
PartyCandidateVotes%±%
Labor Carlo Carli 19,93465.0+14.1
Liberal Dino De Marchi9,34830.5+1.4
Natural Law Martin Richardson1,4054.6+2.1
Total formal votes30,68796.9+2.8
Informal votes9823.1-2.8
Turnout 31,66992.1-0.2
Two-party-preferred result
Labor Carlo Carli 20,50966.9+5.7
Liberal Dino De Marchi10,14033.1-5.7
Labor hold Swing +5.7

1994 by-election

1994 Coburg state by-election
PartyCandidateVotes%±%
Labor Carlo Carli 13,69152.8+2.0
Independent Sam Ganci5,97623.0+23.0
Greens Andrea Sharam5,36820.7+20.7
Independent Gilbert Boffa9063.5+3.5
Total formal votes25,94191.8-2.2
Informal votes2,3048.2+2.2
Turnout 28,24585.0
Two-candidate-preferred result
Labor Carlo Carli 17,18866.3+5.1
Independent Sam Ganci8,73833.7+33.7
Labor hold Swing N/A

1992

1992 Victorian state election: Coburg
PartyCandidateVotes%±%
Labor Tom Roper 14,66250.8-11.6
Liberal Ross Lazzaro8,39429.1+2.2
Independent Norma Willoughby2,3968.3+2.8
Pensioner and CIR Katheryne Savage1,5065.2+5.2
Independent Jeff Sullivan1,1654.0+4.0
Natural Law Byron Rigby7252.5+2.5
Total formal votes28,84894.1+1.0
Informal votes1,8135.9-1.0
Turnout 30,66192.3
Two-party-preferred result
Labor Tom Roper 17,56961.2-4.5
Liberal Ross Lazzaro11,14238.8+4.5
Labor hold Swing -4.5

Elections in the 1980s

1988

1988 Victorian state election: Coburg
PartyCandidateVotes%±%
Labor Peter Gavin 15,35361.27-9.17
Liberal Erdem Aydin5,91123.59-5.97
Independent Norma Willoughby3,79315.14+15.14
Total formal votes25,05793.70-2.35
Informal votes1,6856.30+2.35
Turnout 26,74291.16-1.48
Two-party-preferred result
Labor Peter Gavin 16,36465.31-5.13
Liberal Erdem Aydin8,69134.69+5.13
Labor hold Swing -5.13

1985

1985 Victorian state election: Coburg
PartyCandidateVotes%±%
Labor Peter Gavin 19,23570.4-2.4
Liberal Antonino Boeti8,07029.6+11.7
Total formal votes27,30596.0
Informal votes1,1244.0
Turnout 28,42992.6
Labor hold Swing -5.3

1982

1982 Victorian state election: Coburg
PartyCandidateVotes%±%
Labor Peter Gavin 18,65670.2+24.5
Liberal Bozidar Jovanovic5,46420.5+2.5
Independent Ernest Hadley2,4769.3+9.3
Total formal votes26,59696.1+2.5
Informal votes1,0673.9-2.5
Turnout 27,66394.3-0.5
Two-party-preferred result
Labor Peter Gavin 19,89474.8+5.3
Liberal Bozidar Jovanovic6,70225.2-5.3
Labor hold Swing +5.3

Elections in the 1970s

1979

1979 Victorian state election: Coburg
PartyCandidateVotes%±%
Labor Peter Gavin 11,64745.7+2.4
Independent Jack Mutton 7,18328.2-0.3
Liberal Nicholas Kosenko4,60218.0-5.1
Democrats Kenneth Goss8403.3+3.3
Democratic Labor John Flint8013.1-2.0
Independent Raymond Berbling4391.7+1.7
Total formal votes25,51293.6-3.0
Informal votes1,7516.4+3.0
Turnout 27,26394.8+1.2
Two-party-preferred result
Labor Peter Gavin 17,73169.5+3.0
Liberal Nicholas Kosenko7,78130.5-3.0
Two-candidate-preferred result
Labor Peter Gavin 13,07251.2+6.6
Independent Jack Mutton 12,44048.8-6.6
Labor gain from Independent Swing +6.6

1976

1976 Victorian state election: Coburg
PartyCandidateVotes%±%
Labor Peter Gavin 11,32443.3-1.2
Independent Jack Mutton 7,45228.5+8.6
Liberal Nicholas Kosenko6,04423.1-2.0
Democratic Labor Helen Hart1,3365.1-5.4
Total formal votes26,15696.6
Informal votes9313.4
Turnout 27,08793.6
Two-candidate-preferred result
Independent Jack Mutton 14,47855.3+2.4
Labor Peter Gavin 11,67844.7-2.4
Independent hold Swing +2.4

1973

1973 Victorian state election: Coburg
PartyCandidateVotes%±%
Labor Frank Cox8,58139.8+1.0
Independent Jack Mutton 6,15628.5+1.2
Liberal Louis Mingaars5,04623.4+1.6
Democratic Labor Timothy Gerrard1,8068.4-3.9
Total formal votes21,58995.7-0.1
Informal votes9674.3+0.1
Turnout 22,55695.6+0.5
Two-candidate-preferred result
Independent Jack Mutton 12,50557.9-1.0
Labor Frank Cox9,08442.1+1.0
Independent hold Swing -1.0

1970

1970 Victorian state election: Coburg
PartyCandidateVotes%±%
Labor Frank Cox8,23638.8-1.0
Independent Jack Mutton 5,72827.3+6.4
Liberal Joan Mathieson4,62721.8-2.8
Democratic Labor Peter McCabe2,61612.3-2.5
Total formal votes21,20795.8+0.1
Informal votes9314.2-0.1
Turnout 22,13895.1-0.4
Two-candidate-preferred result
Independent Jack Mutton 12,48058.8+0.4
Labor Frank Cox8,72741.2-0.4
Independent hold Swing +0.4

Elections in the 1960s

1967

1967 Victorian state election: Coburg
PartyCandidateVotes%±%
Labor Bill Brown 8,68039.8-14.2
Liberal Charles Symons5,36624.6-1.7
Independent Jack Mutton 4,54820.9+20.9
Democratic Labor John Hardy3,21614.7-5.0
Total formal votes21,81095.7
Informal votes9824.3
Turnout 22,79295.5
Two-party-preferred result
Labor Bill Brown 12,94059.3-2.4
Liberal Charles Symons8,87040.7+2.4
Two-candidate-preferred result
Independent Jack Mutton 12,48058.8+58.8
Labor Bill Brown 8,72741.2-15.7
Independent gain from Labor Swing N/A

1964

1964 Victorian state election: Coburg
PartyCandidateVotes%±%
Labor Charlie Mutton 10,98956.9-1.9
Liberal and Country John Knight4,62924.0+3.7
Democratic Labor John Hardy3,70319.2-1.7
Total formal votes19,32197.1+0.1
Informal votes5692.9-0.1
Turnout 19,89094.9-0.3
Two-party-preferred result
Labor Charlie Mutton 11,54459.7-2.2
Liberal and Country John Knight7,77740.3+2.2
Labor hold Swing -2.2

1961

1961 Victorian state election: Coburg
PartyCandidateVotes%±%
Labor Charlie Mutton 11,65858.8-3.6
Democratic Labor John Livingstone4,14920.9+5.9
Liberal and Country Bryce Pyatt4,03620.3-2.2
Total formal votes19,84397.0-1.1
Informal votes6173.0+1.1
Turnout 20,46095.2-0.2
Two-party-preferred result
Labor Charlie Mutton 12,28061.9-2.8
Liberal and Country Bryce Pyatt7,56338.1+2.8
Labor hold Swing -2.8
  • The two candidate preferred vote was not counted between the Labor and DLP candidates for Coburg.

Elections in the 1950s

1958

1958 Victorian state election: Coburg
PartyCandidateVotes%±%
Labor Charlie Mutton 12,80162.4
Liberal and Country Peter Robertson4,62322.5
Democratic Labor Kevin O'Dea3,07815.0
Total formal votes20,50298.1
Informal votes3991.9
Turnout 20,90195.4
Two-party-preferred result
Labor Charlie Mutton 13,26364.7
Liberal and Country Peter Robertson7,23935.3
Labor gain from Independent Swing N/A
  • Mutton was elected as an Independent in the 1955 election, but joined the Labor party in 1956.
  • Two party preferred vote was estimated.

1955

1955 Victorian state election: Coburg
PartyCandidateVotes%±%
Progressive Labor Charlie Mutton 11,80953.2
Liberal and Country Donald Abernethy5,71125.7
Labor (A-C) Kevin Hayes4,66521.0
Total formal votes22,18598.2
Informal votes4151.8
Turnout 22,60094.8
Two-candidate-preferred result
Progressive Labor Charlie Mutton 12,97558.5
Liberal and Country Donald Abernethy9,21041.5
Progressive Labor hold Swing

1952

1952 Victorian state election: Coburg
PartyCandidateVotes%±%
Progressive Labor Charlie Mutton 12,61753.6+20.8
Labor Kevin Hayes10,92746.4+7.4
Total formal votes23,54498.3-0.7
Informal votes4041.7+0.7
Turnout 23,94894.1-1.6
Progressive Labor hold Swing -4.4

1950

1950 Victorian state election: Coburg
PartyCandidateVotes%±%
Labor Kevin Hayes9,46239.0+10.4
Blackburn-Mutton Labor Charlie Mutton 7,97732.8-5.7
Liberal and Country John Morris6,85228.2-4.6
Total formal votes24,29199.0+0.3
Informal votes2361.0-0.3
Turnout 24,52795.7+1.0
Two-candidate-preferred result
Blackburn-Mutton Labor Charlie Mutton 14,08558.0-7.3
Labor Kevin Hayes10,20642.0+7.3
Blackburn-Mutton Labor hold Swing -7.3

Elections in the 1940s

1947

1947 Victorian state election: Coburg
PartyCandidateVotes%±%
Blackburn-Mutton Labor Charlie Mutton 9,22338.5-13.6
Liberal Walter Perse7,85932.8+9.6
Labor George Henderson6,85028.6+5.4
Total formal votes23,93298.7+0.3
Informal votes3251.3-0.3
Turnout 24,25794.7+7.0
Two-candidate-preferred result
Blackburn-Mutton Labor Charlie Mutton 15,63065.3
Liberal Walter Perse8,30234.7
Blackburn-Mutton Labor hold Swing N/A

1945

1945 Victorian state election: Coburg
PartyCandidateVotes%±%
Independent Labor Charlie Mutton 10,98652.1
Labor Arthur Lewis 5,21324.7
Liberal Allen Bateman 4,89923.2
Total formal votes21,09898.4
Informal votes3411.6
Turnout 21,43987.7
Independent Labor hold Swing
  • Preferences were not distributed.

1943

1943 Victorian state election: Coburg
PartyCandidateVotes%±%
Independent Charlie Mutton 13,99650.8+50.8
Labor Jessie Satchell 5,80621.1-46.0
United Australia Herbert Rusmussen3,56412.9-20.0
Independent Charles Hosken2,80110.2+10.2
Independent Donald McDonald1,3685.0+5.0
Total formal votes27,53595.6-3.0
Informal votes1,2724.4+3.0
Turnout 28,80787.5-5.7
Independent gain from Labor Swing N/A
  • Preferences were not distributed.

1940 by-election

1940 Coburg state by-election
PartyCandidateVotes%±%
Labor Roy Cameron10,03639.3-27.8
Independent Labor Charlie Mutton 8,17232.0+32.0
Independent Herbert Rasmussen7,33928.7+28.7
Total formal votes26,25496.7-1.9
Informal votes8653.3+1.9
Turnout 27,11993.20.0
Two-candidate-preferred result
Independent Labor Charlie Mutton 14,08255.1
Labor Roy Cameron11,46544.9
Independent Labor gain from Labor Swing N/A
1940 Victorian state election: Coburg
PartyCandidateVotes%±%
Labor Frank Keane 17,92767.1+4.3
United Australia Richard Griffiths8,81032.9-4.3
Total formal votes26,73798.6-0.4
Informal votes3821.4+0.4
Turnout 27,11993.2-2.0
Labor hold Swing +4.3

Elections in the 1930s

1937

1937 Victorian state election: Coburg
PartyCandidateVotes%±%
Labor Frank Keane 16,21862.8+1.6
United Australia Henry Richards9,61337.2-1.6
Total formal votes25,83199.0+0.7
Informal votes2681.0-0.7
Turnout 26,09995.2+1.2
Labor hold Swing +1.6

1935

1935 Victorian state election: Coburg
PartyCandidateVotes%±%
Labor Frank Keane 14,63361.2+8.4
United Australia Henry Stubbs9,29438.8+3.4
Total formal votes23,92798.4+0.9
Informal votes3841.6-0.9
Turnout 24,31194.0-1.9
Labor hold Swing +4.9

1932

1932 Victorian state election: Coburg
PartyCandidateVotes%±%
Labor Frank Keane 12,03052.8-47.2
United Australia Alfred Carter8,05935.4+35.4
Independent Henry Richards2,69813.8+13.8
Total formal votes22,78797.5
Informal votes5862.5
Turnout 23,37395.9
Two-party-preferred result
Labor Frank Keane 56.3-43.7
United Australia Alfred Carter43.7+43.7
Labor hold Swing N/A
  • Two party preferred vote was estimated.

Elections in the 1920s

1929

1927

1927 Victorian state election: Coburg
PartyCandidateVotes%±%
Labor Frank Keane 13,00567.5
Nationalist Henry Richards6,25632.5
Total formal votes19,26199.1
Informal votes1830.9
Turnout 19,44494.7
Labor hold Swing

Related Research Articles

<span class="mw-page-title-main">1998 Australian federal election</span> Election for the 39th Parliament of Australia

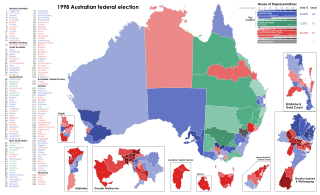
The 1998 Australian federal election was held to determine the members of the 39th Parliament of Australia. It was held on 3 October 1998. All 148 seats of the House of Representatives and 40 seats of the 76-seat Senate were up for election. The incumbent centre-right Liberal/National Coalition government led by Prime Minister John Howard of the Liberal Party and coalition partner Tim Fischer of the National Party defeated the centre-left Australian Labor Party opposition led by Opposition Leader Kim Beazley, despite losing the nationwide popular and two-party preferred vote. However, the Australian Labor Party gained seats from the previous election.

<span class="mw-page-title-main">Two-party-preferred vote</span> Result of election after distribution of preferences

In Australian politics, the two-party-preferred vote is the result of an election or opinion poll after preferences have been distributed to the highest two candidates, who in some cases can be independents. For the purposes of TPP, the Liberal/National Coalition is usually considered a single party, with Labor being the other major party. Typically the TPP is expressed as the percentages of votes attracted by each of the two major parties, e.g. "Coalition 50%, Labor 50%", where the values include both primary votes and preferences. The TPP is an indicator of how much swing has been attained/is required to change the result, taking into consideration preferences, which may have a significant effect on the result.

This is a list of electoral results for the Electoral district of Albert Park in Victorian state elections from 1889 to the present.

Rockdale, an electoral district of the Legislative Assembly in the Australian state of New South Wales, has had two incarnations, the first from 1927 to 1930, the second from in 1941 to the present.

This is a list of electoral results for the Electoral district of Broadmeadows in Victorian state elections.

This is a list of electoral results for the Electoral district of Melbourne in Victorian state elections.

This is a list of electoral results for the Electoral district of Northcote in Victorian state elections.

This is a list of electoral results for the Electoral district of Richmond in Victorian state elections.

This is a list of electoral results for the Electoral district of Rodney in Victorian state elections.

This is a list of electoral results for the Electoral district of Swan Hill in Victorian state elections.

This is a list of electoral results for the Electoral district of Williamstown in Victorian state elections.

This is a list of electoral results for the electoral district of Albany in Western Australian state elections.

This is a list of House of Assembly results for the 1959 South Australian state election.

Elections were held in the Australian state of Victoria on Saturday 18 June 1955 to elect 17 of the 34 members of the state's Legislative Council for six year terms. MLCs were elected in single-member provinces using preferential voting.

This is a list of electoral district results for the Victorian 1935 election.

This is a list of electoral district results for the Victorian 1932 election.

This is a list of electoral district results for the Victorian 1940 election.

This is a list of electoral district results for the 1911 Victorian state election.

This is a list of electoral results for the electoral district of Brunswick East in Victorian state elections.

This is a list of electoral results for the electoral district of Gippsland North in Victorian state elections.

References