This is a list of electoral results for the Electoral district of Mitcham in Victorian state elections.
Member | Party | Term | |
---|---|---|---|
Dorothy Goble | Liberal | 1967–1976 | |
George Cox | Liberal | 1976–1982 | |
John Harrowfield | Labor | 1982–1992 | |
Roger Pescott | Liberal | 1992–1997 | |
Tony Robinson | Labor | 1997–2010 | |
Dee Ryall | Liberal | 2010–2014 | |
Party | Candidate | Votes | % | ±% | |
---|---|---|---|---|---|
Liberal | Dee Ryall | 15,717 | 46.55 | +7.09 | |
Labor | Tony Robinson | 11,669 | 34.56 | -5.56 | |
Greens | Sheridan Lewis | 4,024 | 11.92 | +0.33 | |
Sex Party | Paul Elliott | 963 | 2.85 | +2.85 | |
Family First | Daniel Ha | 758 | 2.25 | -2.28 | |
Democratic Labor | Barry O'Shea | 632 | 1.87 | +1.87 | |
Total formal votes | 33,763 | 96.55 | +0.06 | ||
Informal votes | 1,208 | 3.45 | −0.06 | ||
Turnout | 34,971 | 94.38 | −0.10 | ||
Two-party-preferred result | |||||
Liberal | Dee Ryall | 17,852 | 52.90 | +4.77 | |
Labor | Tony Robinson | 15,895 | 47.10 | -4.77 | |
Liberal gain from Labor | Swing | +4.77 |
Party | Candidate | Votes | % | ±% | |
---|---|---|---|---|---|
Labor | Tony Robinson | 13,305 | 40.1 | -7.7 | |
Liberal | Philip Daw | 13,085 | 39.5 | +1.6 | |
Greens | Rob Redman | 3,843 | 11.6 | +1.0 | |
Family First | Miriam Rawson | 1,501 | 4.5 | +4.5 | |
Independent | Peter Allan | 936 | 2.8 | +2.8 | |
People Power | Sharon Partridge | 490 | 1.5 | +1.5 | |
Total formal votes | 33,160 | 96.5 | −0.9 | ||
Informal votes | 1,205 | 3.5 | +0.9 | ||
Turnout | 34,365 | 94.5 | |||
Two-party-preferred result | |||||
Labor | Tony Robinson | 17,234 | 52.0 | -5.7 | |
Liberal | Philip Daw | 15,926 | 48.0 | +5.7 | |
Labor hold | Swing | -5.7 |
Party | Candidate | Votes | % | ±% | |
---|---|---|---|---|---|
Labor | Tony Robinson | 16,097 | 47.8 | +3.0 | |
Liberal | Russell Hannan | 12,735 | 37.9 | -9.9 | |
Greens | Bill Pemberton | 3,559 | 10.6 | +10.6 | |
Independent | Kaele Way | 946 | 2.8 | +2.8 | |
Independent | Liz Turner | 307 | 0.9 | +0.9 | |
Total formal votes | 33,644 | 97.4 | −0.4 | ||
Informal votes | 906 | 2.6 | +0.4 | ||
Turnout | 34,550 | 94.2 | |||
Two-party-preferred result | |||||
Labor | Tony Robinson | 19,405 | 57.7 | +7.7 | |
Liberal | Russell Hannan | 14,239 | 42.3 | -7.7 | |
Labor hold | Swing | +7.7 |
Party | Candidate | Votes | % | ±% | |
---|---|---|---|---|---|
Liberal | Andrew Munroe | 15,043 | 47.2 | -6.4 | |
Labor | Tony Robinson | 14,411 | 45.2 | +4.7 | |
Independent | Chris Aubrey | 1,529 | 4.8 | +4.8 | |
Hope | Tim Petherbridge | 894 | 2.8 | +2.8 | |
Total formal votes | 31,877 | 97.8 | −0.3 | ||
Informal votes | 729 | 2.2 | +0.3 | ||
Turnout | 32,606 | 94.6 | |||
Two-party-preferred result | |||||
Labor | Tony Robinson | 16,110 | 50.5 | +5.8 | |
Liberal | Andrew Munroe | 15,767 | 49.5 | -5.8 | |
Labor gain from Liberal | Swing | +5.8 |
Party | Candidate | Votes | % | ±% | |
---|---|---|---|---|---|
Labor | Tony Robinson | 13,206 | 46.3 | +5.8 | |
Liberal | Andrew Munroe | 8,764 | 30.7 | -22.9 | |
Democrats | John McLaren | 1,857 | 6.5 | +6.5 | |
Independent | Peter Stokes | 1,356 | 4.7 | +4.7 | |
Greens | Robyn Evans | 1,021 | 3.6 | +3.6 | |
Independent | Tim Petherbridge | 551 | 1.9 | +1.9 | |
Independent | Rob Wootton | 498 | 1.7 | +1.7 | |
Independent | Adam Kliska | 257 | 0.9 | +0.9 | |
Shooters | David McDermott | 245 | 0.9 | +0.9 | |
Reform | Mike Dunn | 204 | 0.7 | +0.7 | |
Independent | Steve Raskovy | 88 | 0.3 | +0.3 | |
Abolish Child Support | Abolish Child Support | 69 | 0.2 | +0.2 | |
Independent | Adrian Stagg | 55 | 0.2 | +0.2 | |
Independent | Basil Smith | 48 | 0.2 | +0.2 | |
Independent | Neville Ford | 42 | 0.1 | +0.1 | |
Independent | Shalam Kalinkara | 42 | 0.1 | +0.1 | |
Total formal votes | 28,549 | 96.5 | −1.6 | ||
Informal votes | 1,040 | 3.5 | +1.6 | ||
Turnout | 29,589 | 87.2 | |||
Two-party-preferred result | |||||
Labor | Tony Robinson | 17,214 | 60.5 | +15.8 | |
Liberal | Andrew Munroe | 11,247 | 39.5 | -15.8 | |
Labor gain from Liberal | Swing | +15.8 |
Party | Candidate | Votes | % | ±% | |
---|---|---|---|---|---|
Liberal | Roger Pescott | 16,951 | 53.6 | -0.8 | |
Labor | Julie Warren | 12,791 | 40.5 | +3.1 | |
Independent | Howard Tankey | 1,539 | 4.9 | +4.9 | |
Natural Law | Andrew Stenberg | 333 | 1.1 | +1.1 | |
Total formal votes | 31,614 | 98.1 | +1.1 | ||
Informal votes | 620 | 1.9 | −1.1 | ||
Turnout | 32,234 | 95.2 | |||
Two-party-preferred result | |||||
Liberal | Roger Pescott | 17,446 | 55.3 | -3.2 | |
Labor | Julie Warren | 14,088 | 44.7 | +3.2 | |
Liberal hold | Swing | -3.2 |
Party | Candidate | Votes | % | ±% | |
---|---|---|---|---|---|
Liberal | Roger Pescott | 16,735 | 54.4 | +11.6 | |
Labor | John Harrowfield | 11,504 | 37.4 | -8.9 | |
Independent | Gilbert Boffa | 2,516 | 8.2 | +8.2 | |
Total formal votes | 30,755 | 97.0 | −0.2 | ||
Informal votes | 962 | 3.0 | +0.2 | ||
Turnout | 31,717 | 95.8 | |||
Two-party-preferred result | |||||
Liberal | Roger Pescott | 17,966 | 58.5 | +10.8 | |
Labor | John Harrowfield | 12,726 | 41.5 | -10.8 | |
Liberal gain from Labor | Swing | +10.8 |
Party | Candidate | Votes | % | ±% | |
---|---|---|---|---|---|
Labor | John Harrowfield | 12,380 | 45.98 | -7.73 | |
Liberal | Matthew Starr | 11,548 | 42.89 | -3.40 | |
Democrats | Louise Enders | 1,830 | 6.80 | +6.80 | |
Call to Australia | Johan Elsmann | 1,164 | 4.32 | +4.32 | |
Total formal votes | 26,922 | 97.10 | −0.42 | ||
Informal votes | 805 | 2.90 | +0.42 | ||
Turnout | 27,727 | 93.72 | −0.71 | ||
Two-party-preferred result | |||||
Labor | John Harrowfield | 14,247 | 52.95 | -0.76 | |
Liberal | Matthew Starr | 12,661 | 47.05 | +0.76 | |
Labor hold | Swing | -0.76 |
Party | Candidate | Votes | % | ±% | |
---|---|---|---|---|---|
Labor | John Harrowfield | 14,928 | 53.7 | +4.9 | |
Liberal | Bruce Camfield | 12,868 | 46.3 | +5.6 | |
Total formal votes | 27,796 | 97.5 | |||
Informal votes | 708 | 2.5 | |||
Turnout | 28,504 | 94.4 | |||
Labor hold | Swing | +0.1 |
Party | Candidate | Votes | % | ±% | |
---|---|---|---|---|---|
Labor | John Harrowfield | 13,581 | 50.0 | +5.7 | |
Liberal | George Cox | 11,075 | 40.8 | -3.5 | |
Democrats | Ross Roberts | 1,702 | 6.3 | -2.1 | |
Democratic Labor | Ada Kowal | 785 | 2.9 | +2.9 | |
Total formal votes | 27,143 | 97.9 | +0.1 | ||
Informal votes | 573 | 2.1 | −0.1 | ||
Turnout | 27,716 | 95.3 | +0.8 | ||
Two-party-preferred result | |||||
Labor | John Harrowfield | 14,638 | 53.9 | +4.6 | |
Liberal | George Cox | 12,505 | 46.1 | -4.6 | |
Labor gain from Liberal | Swing | +4.6 |
Party | Candidate | Votes | % | ±% | |
---|---|---|---|---|---|
Liberal | George Cox | 11,807 | 44.3 | -11.2 | |
Labor | Michael Shatin | 11,799 | 44.3 | -0.2 | |
Democrats | Frank Andrewartha | 2,227 | 8.4 | +8.4 | |
Australia | Peter Allan | 801 | 3.0 | +3.0 | |
Total formal votes | 26,634 | 97.8 | +0.4 | ||
Informal votes | 607 | 2.2 | −0.4 | ||
Turnout | 27,241 | 94.5 | +0.9 | ||
Two-party-preferred result | |||||
Liberal | George Cox | 13,512 | 50.7 | -4.8 | |
Labor | Michael Shatin | 13,122 | 49.3 | +4.8 | |
Liberal hold | Swing | -4.8 |
Party | Candidate | Votes | % | ±% | |
---|---|---|---|---|---|
Liberal | George Cox | 14,294 | 55.5 | +9.7 | |
Labor | Gordon Henderson | 11,444 | 44.5 | +2.4 | |
Total formal votes | 25,738 | 97.4 | |||
Informal votes | 693 | 2.6 | |||
Turnout | 26,431 | 93.6 | |||
Liberal hold | Swing | +1.7 |
Party | Candidate | Votes | % | ±% | |
---|---|---|---|---|---|
Liberal | Dorothy Goble | 14,278 | 47.3 | +7.7 | |
Labor | John Hyslop | 12,156 | 40.3 | -1.0 | |
Democratic Labor | Marianne Crowe | 1,637 | 5.4 | -6.8 | |
Australia | Ethel Beaumont | 1,619 | 5.4 | +5.4 | |
Defence of Government Schools | Ray Nilsen | 503 | 1.7 | -5.2 | |
Total formal votes | 30,193 | 97.8 | +0.6 | ||
Informal votes | 692 | 2.2 | −0.6 | ||
Turnout | 30,885 | 93.3 | −1.5 | ||
Two-party-preferred result | |||||
Liberal | Dorothy Goble | 16,661 | 55.2 | +2.9 | |
Labor | John Hyslop | 13,532 | 44.8 | -2.9 | |
Liberal hold | Swing | +2.9 |
Party | Candidate | Votes | % | ±% | |
---|---|---|---|---|---|
Labor | John Hyslop | 11,146 | 41.3 | +0.1 | |
Liberal | Dorothy Goble | 10,693 | 39.6 | -6.2 | |
Democratic Labor | Marianne Crowe | 3,294 | 12.2 | -0.8 | |
Defence of Government Schools | Ray Nilsen | 1,870 | 6.9 | +6.9 | |
Total formal votes | 27,003 | 97.2 | −0.7 | ||
Informal votes | 774 | 2.8 | +0.7 | ||
Turnout | 27,777 | 94.8 | −0.4 | ||
Two-party-preferred result | |||||
Liberal | Dorothy Goble | 14,122 | 52.3 | -4.7 | |
Labor | John Hyslop | 12,881 | 47.7 | +4.7 | |
Liberal hold | Swing | -4.7 |
Party | Candidate | Votes | % | ±% | |
---|---|---|---|---|---|
Liberal | Dorothy Goble | 11,329 | 45.7 | -4.2 | |
Labor | Graham Walsh | 10,203 | 41.2 | +5.8 | |
Democratic Labor | Gerald Shinnick | 3,231 | 13.1 | -1.6 | |
Total formal votes | 24,763 | 97.9 | |||
Informal votes | 534 | 2.1 | |||
Turnout | 25,297 | 95.2 | |||
Two-party-preferred result | |||||
Liberal | Dorothy Goble | 14,116 | 57.0 | -5.5 | |
Labor | Graham Walsh | 10,647 | 43.0 | +5.5 | |
Liberal hold | Swing | -5.5 |
The Division of Deakin is an Australian Electoral Division in Victoria.
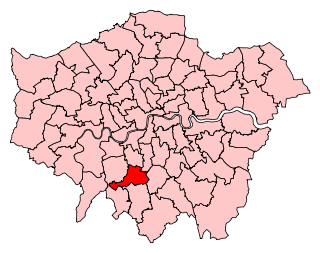
Mitcham and Morden is a constituency in Greater London represented in the House of Commons of the UK Parliament since 1997 by Dame Siobhain McDonagh of the Labour Party.
The electoral district of Box Hill is an electoral district of the Victorian Legislative Assembly, covering an area of 29 square kilometres (11 sq mi) in eastern Melbourne. It contains the suburbs of Box Hill, Box Hill North, Box Hill South, Mont Albert, Mont Albert North, most of Blackburn, Blackburn North, and Blackburn South, and parts of Balwyn North, Burwood, Burwood East, and Surrey Hills.
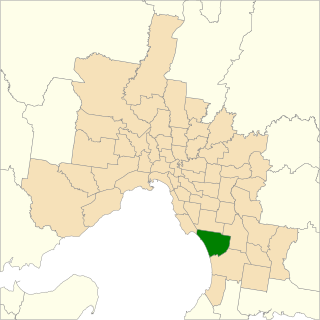
The electoral district of Mordialloc is an electorate of the Victorian Legislative Assembly including the suburbs of Braeside, Mordialloc, Aspendale, Aspendale Gardens, Edithvale, Chelsea, Chelsea Heights and Parkdale; and parts of Keysborough and Mentone. The current member is Tim Richardson.
Netherby is an inner-southern suburb of Adelaide, South Australia which lies within the City of Mitcham. It is bordered by the suburbs of Springfield, Kingswood, Mitcham and Malvern.
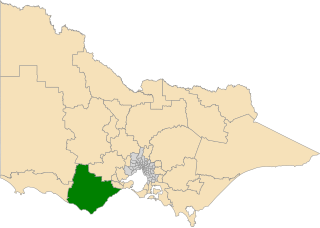
The electoral district of Polwarth is an electoral district of the Victorian Legislative Assembly. It is located in south-west rural Victoria, west of Geelong, and covers the Colac and Corangamite local government areas (LGA), parts of the Moyne, Golden Plains and Surf Coast LGAs, and slivers of the Ararat and Greater Geelong LGAs, running along the Great Ocean Road taking in Anglesea, Cape Otway, Peterborough, Aireys Inlet, Lorne, Wye River, Apollo Bay and Port Campbell, covering the inland towns of Winchelsea, Colac, Camperdown and Terang along the Princes Highway, and Inverleigh, Cressy, Lismore and Mortlake on the Hamilton Highway, and finally, includes the Otway Ranges and Lake Corangamite.
The electoral district of Essendon is an electoral district of the Victorian Legislative Assembly. It was first created in 1904 after the abolition of the larger Essendon and Flemington electorate, and covers some of the north-western suburbs of Melbourne, including Essendon, Moonee Ponds and Ascot Vale.
The Electoral district of Mitcham was an electoral district of the Victorian Legislative Assembly. It was centered on Mitcham and Blackburn in the eastern suburbs of Melbourne.
The electoral district of Kew is an electoral district of the Victorian Legislative Assembly. Located in eastern Melbourne, a few kilometres from the city centre, it is centred on the suburbs of Kew and Kew East. It also contains Balwyn, Balwyn North, Deepdene, and parts of Canterbury, Mont Albert, and Surrey Hills.
The electoral district of Shepparton is a rural Lower House electoral district of the Victorian Parliament. It is located within the Northern Victoria Region of the Legislative Council.
Stephen John Baker was an Australian politician and 7th Deputy Premier of South Australia from 1993 to 1996. Baker represented the Liberal Party in the electoral district of Waite, formerly Mitcham in the House of Assembly.
Mitcham was an electoral district of the House of Assembly in the Australian state of South Australia from 1938 to 1993. The district was based in the south-eastern suburbs of Adelaide.
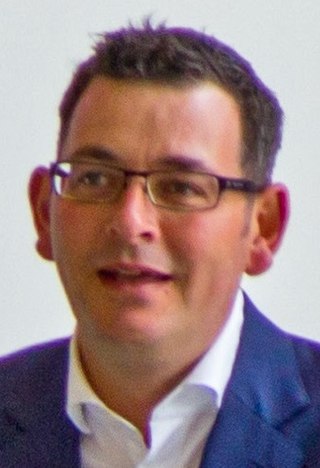
The 2014 Victorian state election, held on Saturday, 29 November 2014, was for the 58th Parliament of Victoria. All 88 seats in the Victorian Legislative Assembly and 40 seats in the Victorian Legislative Council were up for election. The incumbent centre-right Coalition minority government, led by Liberal Party leader and Premier Denis Napthine and National Party leader and Deputy Premier Peter Ryan, was defeated by the centre-left Labor Party opposition, led by Daniel Andrews. The Greens won two lower house seats, their first Legislative Assembly seats in a Victorian state election, whilst increasing their share of upper house seats. The new Andrews Ministry was sworn in on 4 December 2014.
This is a list of electoral results for the Electoral district of Benalla in Victorian state elections.
This is a list of electoral results for the Electoral district of Burwood in Victorian state elections.
This is a list of electoral results for the Electoral district of Cranbourne in Victorian state elections.
This is a list of electoral results for the district of Mulgrave in Victorian state elections.
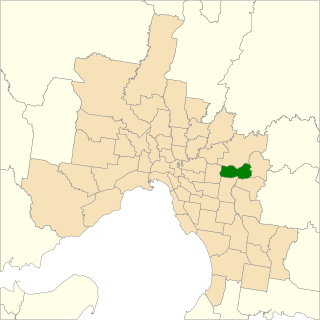
The electoral district of Ringwood is an electoral district of the Victorian Legislative Assembly, located in the east of Melbourne. It was first proclaimed in 1958 and was abolished in 1992. Some of Ringwood was included in the new electoral district of Bayswater that year. Kay Setches, who was at the time the last member for Ringwood, contested and lost Bayswater at the 1992 election.
The electoral district of Murray Plains is an electoral district of the Victorian Legislative Assembly in Australia. It was created in the redistribution of electoral boundaries in 2013, and came into effect at the 2014 state election.
This is a list of electoral district results for the 2022 Victorian state election for the Legislative Assembly.