This is a list of electoral results for the Electoral district of Murray Valley in Victorian state elections.
Member | Party | Term | |
---|---|---|---|
George Moss | Country | 1945–1973 | |
Bill Baxter | Country | 1973–1975 | |
National Country | 1975–1976 | ||
Ken Jasper | National Country | 1976–1982 | |
National | 1982–2010 | ||
Tim McCurdy | National | 2010–2014 | |
Party | Candidate | Votes | % | ±% | |
---|---|---|---|---|---|
National | Tim McCurdy | 18,357 | 53.83 | +2.92 | |
Labor | Lachlan Enshaw | 7,065 | 20.72 | −1.20 | |
Independent | Roberto Paino | 3,339 | 9.79 | +9.79 | |
Country Alliance | Peter Watson | 2,668 | 7.82 | +7.82 | |
Greens | Doug Ralph | 1,598 | 4.69 | −0.75 | |
Family First | Ray Hungerford | 1,073 | 3.15 | −1.00 | |
Total formal votes | 34,100 | 94.87 | −1.43 | ||
Informal votes | 1,845 | 5.13 | +1.43 | ||
Turnout | 35,945 | 93.75 | +0.59 | ||
Two-party-preferred result | |||||
National | Tim McCurdy | 23,604 | 69.04 | −2.72 | |
Labor | Lachlan Enshaw | 10,587 | 30.96 | +2.72 | |
National hold | Swing | -2.72 | |||
Party | Candidate | Votes | % | ±% | |
---|---|---|---|---|---|
National | Ken Jasper | 16,781 | 50.9 | +7.8 | |
Labor | Lauren O'Neill | 7,224 | 21.9 | −8.9 | |
Liberal | Nick McHugh | 5,795 | 17.6 | −2.9 | |
Greens | Carol Kunert | 1,794 | 5.4 | −0.1 | |
Family First | Garry Duke | 1,368 | 4.2 | +4.2 | |
Total formal votes | 32,962 | 96.3 | −0.8 | ||
Informal votes | 1,265 | 3.7 | +0.8 | ||
Turnout | 34,227 | 93.2 | |||
Two-party-preferred result | |||||
National | Ken Jasper | 23,637 | 71.8 | +7.9 | |
Labor | Lauren O'Neill | 9,302 | 28.2 | −7.9 | |
National hold | Swing | +7.9 | |||
Party | Candidate | Votes | % | ±% | |
---|---|---|---|---|---|
National | Ken Jasper | 13,778 | 43.1 | −22.3 | |
Labor | Lauren O'Neill | 9,846 | 30.8 | −3.5 | |
Liberal | Don Joyce | 6,565 | 20.5 | +20.2 | |
Greens | Trisha Scott | 1,764 | 5.5 | +5.5 | |
Total formal votes | 31,953 | 97.1 | +0.1 | ||
Informal votes | 964 | 2.9 | −0.1 | ||
Turnout | 32,917 | 93.8 | |||
Two-party-preferred result | |||||
National | Ken Jasper | 20,416 | 63.9 | −1.8 | |
Labor | Lauren O'Neill | 11,537 | 36.1 | +1.8 | |
National hold | Swing | -1.8 | |||
Party | Candidate | Votes | % | ±% | |
---|---|---|---|---|---|
National | Ken Jasper | 20,899 | 65.9 | −5.3 | |
Labor | Zuvele Leschen | 10,811 | 34.1 | +8.4 | |
Total formal votes | 31,710 | 97.0 | −1.4 | ||
Informal votes | 990 | 3.0 | +1.4 | ||
Turnout | 32,700 | 94.0 | |||
National hold | Swing | -6.5 | |||
Party | Candidate | Votes | % | ±% | |
---|---|---|---|---|---|
National | Ken Jasper | 22,774 | 71.2 | −2.8 | |
Labor | Michelle MacDonald | 8,230 | 25.7 | −0.3 | |
Natural Law | Patricia Jackson | 974 | 3.0 | +3.0 | |
Total formal votes | 31,978 | 98.4 | +0.9 | ||
Informal votes | 530 | 1.6 | −0.9 | ||
Turnout | 32,508 | 94.4 | |||
Two-party-preferred result | |||||
National | Ken Jasper | 23,154 | 72.4 | −1.6 | |
Labor | Michelle MacDonald | 8,809 | 27.6 | +1.6 | |
National hold | Swing | -1.6 | |||
Party | Candidate | Votes | % | ±% | |
---|---|---|---|---|---|
National | Ken Jasper | 22,744 | 74.0 | +15.3 | |
Labor | Maria Keller | 7,999 | 26.0 | +0.2 | |
Total formal votes | 30,743 | 97.4 | −0.6 | ||
Informal votes | 806 | 2.6 | +0.6 | ||
Turnout | 31,549 | 95.1 | |||
National hold | Swing | +2.2 | |||
Party | Candidate | Votes | % | ±% | |
---|---|---|---|---|---|
National | Ken Jasper | 17,354 | 58.17 | −0.84 | |
Labor | Jill Milthorpe | 7,813 | 26.19 | −0.49 | |
Liberal | Diane Mathieson | 4,664 | 15.63 | +1.32 | |
Total formal votes | 29,831 | 98.09 | −0.10 | ||
Informal votes | 581 | 1.91 | +0.10 | ||
Turnout | 30,412 | 92.53 | −1.57 | ||
Two-party-preferred result | |||||
National | Ken Jasper | 21,286 | 71.37 | −0.76 | |
Labor | Jill Milthorpe | 8,539 | 28.63 | +0.76 | |
National hold | Swing | -0.76 | |||
Party | Candidate | Votes | % | ±% | |
---|---|---|---|---|---|
National | Ken Jasper | 16,880 | 59.0 | +5.3 | |
Labor | Jill Milthorpe | 7,633 | 26.7 | −3.8 | |
Liberal | Bill Hunter | 4,093 | 14.3 | −1.3 | |
Total formal votes | 28,606 | 98.2 | |||
Informal votes | 526 | 1.8 | |||
Turnout | 29,132 | 94.1 | |||
Two-party-preferred result | |||||
National | Ken Jasper | 20,654 | 72.2 | +3.9 | |
Labor | Jill Milthorpe | 7,952 | 27.8 | −3.9 | |
National hold | Swing | +3.9 | |||
Party | Candidate | Votes | % | ±% | |
---|---|---|---|---|---|
National | Ken Jasper | 14,347 | 56.7 | +6.9 | |
Labor | Jill Millthorpe | 7,685 | 30.4 | +2.0 | |
Liberal | William Scott | 3,278 | 13.0 | −8.9 | |
Total formal votes | 25,310 | 98.0 | +1.6 | ||
Informal votes | 512 | 2.0 | −1.6 | ||
Turnout | 25,822 | 95.0 | +0.4 | ||
Two-party-preferred result | |||||
National | Ken Jasper | 17,462 | 69.0 | −1.5 | |
Labor | Jill Millthorpe | 7,848 | 31.0 | +1.5 | |
National hold | Swing | -1.5 | |||
Party | Candidate | Votes | % | ±% | |
---|---|---|---|---|---|
National | Ken Jasper | 11,936 | 49.8 | +3.4 | |
Labor | Abigail Donlon | 6,802 | 28.4 | +2.9 | |
Liberal | Brian Lumsden | 5,242 | 21.9 | +0.7 | |
Total formal votes | 23,980 | 96.4 | −1.2 | ||
Informal votes | 889 | 3.6 | +1.2 | ||
Two-party-preferred result | |||||
National | Ken Jasper | 16,895 | 70.5 | −1.6 | |
Labor | Abigail Donlon | 7,085 | 29.5 | +1.6 | |
National hold | Swing | -1.6 | |||
Party | Candidate | Votes | % | ±% | |
---|---|---|---|---|---|
National | Ken Jasper | 10,812 | 46.4 | +2.0 | |
Labor | Abigail Donlon | 5,934 | 25.5 | −3.9 | |
Liberal | Brian Lumsden | 4,942 | 21.2 | +4.0 | |
Democratic Labor | Patrick Payne | 1,590 | 6.8 | −2.1 | |
Total formal votes | 23,278 | 97.6 | |||
Informal votes | 561 | 2.4 | |||
Turnout | 23,839 | 94.9 | |||
Two-party-preferred result | |||||
National | Ken Jasper | 16,776 | 72.1 | +3.6 | |
Labor | Abigail Donlon | 6,502 | 27.9 | −3.6 | |
National hold | Swing | +3.6 | |||
Party | Candidate | Votes | % | ±% | |
---|---|---|---|---|---|
Country | Bill Baxter | 7,927 | 40.1 | +3.3 | |
Labor | Donald Boag | 5,463 | 27.6 | +3.9 | |
Liberal | Robert Crosby | 4,808 | 24.3 | −3.2 | |
Democratic Labor | David Kane | 1,591 | 7.9 | −4.1 | |
Total formal votes | 19,789 | 97.5 | +0.5 | ||
Informal votes | 496 | 2.5 | −0.5 | ||
Turnout | 20,285 | 92.9 | −1.6 | ||
Two-party-preferred result | |||||
Country | Bill Baxter | 13,717 | 69.3 | −3.6 | |
Labor | Donald Boag | 6,072 | 30.7 | +3.6 | |
Country hold | Swing | -3.6 | |||
Party | Candidate | Votes | % | ±% | |
---|---|---|---|---|---|
Country | George Moss | 6,583 | 36.8 | −16.8 | |
Liberal | Robert Crosby | 4,909 | 27.5 | +12.6 | |
Labor | Valda Reid | 4,231 | 23.7 | +4.8 | |
Democratic Labor | John Patterson | 2,139 | 12.0 | −0.6 | |
Total formal votes | 17,862 | 97.0 | +0.1 | ||
Informal votes | 557 | 3.0 | −0.1 | ||
Turnout | 18,419 | 94.5 | 0.0 | ||
Two-party-preferred result | |||||
Country | George Moss | 13,016 | 72.9 | −4.8 | |
Labor | Valda Reid | 4,846 | 27.1 | +4.8 | |
Country hold | Swing | -4.8 | |||
Two-candidate-preferred result | |||||
Country | George Moss | 11,041 | 61.8 | −15.9 | |
Liberal | Robert Crosby | 6,821 | 38.2 | +38.2 | |
Country hold | Swing | -15.9 | |||
Party | Candidate | Votes | % | ±% | |
---|---|---|---|---|---|
Country | George Moss | 9,255 | 53.6 | −7.4 | |
Labor | Robert Cross | 3,265 | 18.9 | +12.5 | |
Liberal | Albert Baker | 2,580 | 14.9 | +0.4 | |
Democratic Labor | John Patterson | 2,167 | 12.6 | −5.5 | |
Total formal votes | 17,267 | 96.9 | |||
Informal votes | 543 | 3.1 | |||
Turnout | 17,810 | 94.5 | |||
Two-party-preferred result | |||||
Country | George Moss | 13,419 | 77.7 | +7.2 | |
Labor | Robert Cross | 3,848 | 22.3 | +22.3 | |
Country hold | Swing | +7.2 | |||
Party | Candidate | Votes | % | ±% | |
---|---|---|---|---|---|
Country | George Moss | 13,612 | 60.0 | +11.4 | |
Liberal and Country | Thomas Gribben | 5,112 | 22.5 | +12.7 | |
Democratic Labor | John Patterson | 3,978 | 17.5 | +2.6 | |
Total formal votes | 22,702 | 97.2 | −0.2 | ||
Informal votes | 645 | 2.8 | +0.2 | ||
Turnout | 23,347 | 95.2 | −0.6 | ||
Two-candidate-preferred result | |||||
Country | George Moss | 14,408 | 63.5 | −6.6 | |
Liberal and Country | Thomas Gribben | 8,294 | 36.5 | +36.5 | |
Country hold | Swing | -6.6 | |||
Party | Candidate | Votes | % | ±% | |
---|---|---|---|---|---|
Country | George Moss | 10,437 | 48.6 | −10.2 | |
Labor | Ronald Kirby | 5,750 | 26.8 | +0.1 | |
Democratic Labor | John Patterson | 3,194 | 14.9 | +0.4 | |
Liberal and Country | Bruno Marmo | 2,116 | 9.8 | +9.8 | |
Total formal votes | 21,497 | 97.4 | −0.9 | ||
Informal votes | 584 | 2.6 | +0.9 | ||
Turnout | 22,081 | 95.8 | +0.7 | ||
Two-party-preferred result | |||||
Country | George Moss | 15,078 | 70.1 | −1.0 | |
Labor | Ronald Kirby | 6,419 | 29.9 | +1.0 | |
Country hold | Swing | -1.0 | |||
Party | Candidate | Votes | % | ±% | |
---|---|---|---|---|---|
Country | George Moss | 12,036 | 58.8 | ||
Labor | Neil Frankland | 5,471 | 26.7 | ||
Democratic Labor | John Patterson | 2,974 | 14.5 | ||
Total formal votes | 20,481 | 98.3 | |||
Informal votes | 345 | 1.7 | |||
Turnout | 20,826 | 95.1 | |||
Two-party-preferred result | |||||
Country | George Moss | 14,564 | 71.1 | ||
Labor | Neil Frankland | 5,917 | 28.9 | ||
Country hold | Swing | ||||
Party | Candidate | Votes | % | ±% | |
---|---|---|---|---|---|
Country | George Moss | 11,386 | 57.7 | ||
Labor | Kenneth Lenne | 5,001 | 25.3 | ||
Labor (A-C) | Stewart Morvell | 3,344 | 16.9 | ||
Total formal votes | 19,731 | 98.6 | |||
Informal votes | 278 | 1.4 | |||
Turnout | 20,009 | 95.0 | |||
Two-party-preferred result | |||||
Country | George Moss | 14,395 | 73.0 | ||
Labor | Kenneth Lenne | 5,336 | 27.0 | ||
Country hold | Swing | ||||
Party | Candidate | Votes | % | ±% | |
---|---|---|---|---|---|
Labor | William Findlay | 6,846 | 44.8 | +7.5 | |
Country | George Moss | 6,617 | 43.3 | +4.1 | |
Liberal and Country | James Mosbey | 1,820 | 11.9 | −11.6 | |
Total formal votes | 15,283 | 98.9 | −0.3 | ||
Informal votes | 171 | 1.1 | +0.3 | ||
Turnout | 15,454 | 93.9 | −1.6 | ||
Two-party-preferred result | |||||
Country | George Moss | 7,996 | 52.3 | −6.9 | |
Labor | William Findlay | 7,287 | 47.7 | +6.9 | |
Country hold | Swing | -6.9 | |||
Party | Candidate | Votes | % | ±% | |
---|---|---|---|---|---|
Country | George Moss | 5,697 | 39.2 | −21.8 | |
Labor | Neil Stewart | 5,418 | 37.3 | −1.7 | |
Liberal and Country | James Tilson | 3,423 | 23.5 | +23.5 | |
Total formal votes | 14,538 | 99.2 | 0.0 | ||
Informal votes | 113 | 0.8 | 0.0 | ||
Turnout | 14,651 | 95.5 | +2.5 | ||
Two-party-preferred result | |||||
Country | George Moss | 8,609 | 59.2 | −1.8 | |
Labor | Neil Stewart | 5,929 | 40.8 | +1.8 | |
Country hold | Swing | -1.8 | |||
Party | Candidate | Votes | % | ±% | |
---|---|---|---|---|---|
Country | George Moss | 8,003 | 61.0 | +24.1 | |
Labor | Neil Stewart | 5,117 | 39.0 | −1.9 | |
Total formal votes | 13,120 | 99.2 | +0.4 | ||
Informal votes | 104 | 0.8 | −0.4 | ||
Turnout | 13,224 | 93.0 | +7.5 | ||
Country hold | Swing | +6.3 | |||
Party | Candidate | Votes | % | ±% | |
---|---|---|---|---|---|
Labor | John McCabe | 4,679 | 40.9 | ||
Country | George Moss | 4,224 | 36.9 | ||
Independent Country | Percy Snowden | 2,551 | 22.3 | ||
Total formal votes | 11,454 | 98.8 | |||
Informal votes | 137 | 1.2 | |||
Turnout | 11,591 | 85.5 | |||
Two-party-preferred result | |||||
Country | George Moss | 6,263 | 54.7 | ||
Labor | John McCabe | 5,191 | 45.3 | ||
Country hold | Swing | ||||
The Goulburn Valley is a sub-region, part of the Hume region of the Australian state of Victoria. The sub-region consists of those areas in the catchment of the Goulburn River and other nearby streams, and is part of the Murray-Darling Basin. The Goulburn Valley is bordered on the south by the Great Dividing Range and to the north by the Murray River, the state border with New South Wales. The sub-region is one of Australia's most productive and intensively farmed areas and is predominantly irrigated.
The Electoral district of Rodney was a Victorian Legislative Assembly electorate in Northern Victoria.
The electoral district of Kew is an electoral district of the Victorian Legislative Assembly. Located in eastern Melbourne, a few kilometres from the city centre, it is centred on the suburbs of Kew and Kew East. It also contains Balwyn, Balwyn North, Deepdene, and parts of Canterbury, Mont Albert, and Surrey Hills.
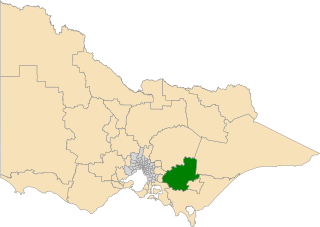
The electoral district of Narracan is an electoral district of the Victorian Legislative Assembly in Australia. It was first proclaimed in 1967 and has usually been held by the Liberal Party.
The electoral district of Gembrook was an electoral district of the Victorian Legislative Assembly. It was situated on the edge of metropolitan Melbourne. Included within its boundaries were Emerald, Cockatoo, Gembrook, Beaconsfield, and sizeable parts of Berwick and Pakenham. The district formerly extended north to Yarra Valley communities such as Warburton and Launching Place prior to the seat's redistribution at the 2014 election.
The Electoral district of Murray Valley was an electoral district of the Victorian Legislative Assembly.
Northern Victoria Region is one of the eight electoral regions of Victoria, Australia, which elects five members to the Victorian Legislative Council by proportional representation. The region was created in 2006 following the 2005 reform of the Victorian Legislative Council.
The Electoral district of Swan Hill was a rural Lower House electoral district of the Victorian Parliament. It was located within the Northern Victoria Region of the Legislative Council.
Ripon is a single member electoral district of the Victorian Legislative Assembly. It is a rural electorate based in western Victoria. In 1946 the electoral district of Ripon was first contested but then abolished in the 1955 election after being held by Labor for seven of these years. Ripon was re-created in 1976, essentially as a replacement for Hampden and Kara Kara.
The Electoral district of Murray is a state electoral district of the New South Wales Legislative Assembly.
This is a list of electoral results for the district of Hawthorn in Victorian state elections.
This is a list of electoral results for the Electoral district of Kew in Victorian state elections.
The Murray was an electoral district of the Legislative Assembly in the Australian colony of Victoria from 1856 to 1877.
Murray Boroughs was an electoral district of the Legislative Assembly in the Australian state of Victoria from 1856 to 1877. It was based in northern Victoria, and included the towns of Benalla Avenel Euroa Seymour, Wodonga and Wangaratta. The district of Murray Boroughs was one of the initial districts of the first Victorian Legislative Assembly, 1856.
The electoral district of Murray Plains is an electoral district of the Victorian Legislative Assembly in Australia. It was created in the redistribution of electoral boundaries in 2013, and came into effect at the 2014 state election.
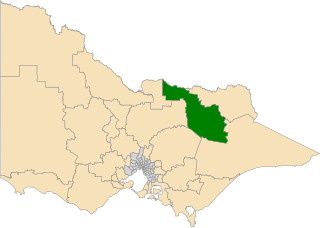
The electoral district of Ovens Valley is an electoral district of the Victorian Legislative Assembly in Australia. It was created in the redistribution of electoral boundaries in 2013, and came into effect at the 2014 state election.
This is a list of electoral results for the Electoral district of Murray Plains in Victorian state elections.
This is a list of electoral results for the Electoral district of Ovens Valley in Victorian state elections.
This is a list of electoral district results for the 2022 Victorian state election for the Legislative Assembly.