This is a list of electoral district results for the 1992 Victorian state election.
Party | Candidate | Votes | % | ±% | |
---|---|---|---|---|---|
Labor | John Thwaites | 13,764 | 46.3 | −6.5 | |
Liberal | Wendy Smith | 11,702 | 39.4 | +6.9 | |
Independent | Shane Tonks | 1,505 | 5.1 | +5.1 | |
Independent | Anne Fahey | 1,358 | 4.6 | −4.4 | |
Independent | Jill Rothwell | 772 | 2.6 | +2.6 | |
Natural Law | Caroline Hockley | 602 | 2.0 | +2.0 | |
Total formal votes | 29,703 | 95.8 | +0.4 | ||
Informal votes | 1,293 | 4.2 | −0.4 | ||
Turnout | 30,996 | 91.7 | |||
Two-party-preferred result | |||||
Labor | John Thwaites | 16,539 | 55.8 | −4.6 | |
Liberal | Wendy Smith | 13,098 | 44.2 | +4.6 | |
Labor hold | Swing | -4.6 | |||
Party | Candidate | Votes | % | ±% | |
---|---|---|---|---|---|
Labor | Carole Marple | 14,651 | 52.9 | −8.0 | |
Liberal | Timothy Warner | 9,268 | 33.5 | +2.2 | |
Independent | Peter Haberecht | 2,196 | 7.9 | +7.9 | |
Natural Law | Leon Staropoli | 1,564 | 5.7 | +5.7 | |
Total formal votes | 27,679 | 95.4 | +1.1 | ||
Informal votes | 1,334 | 4.6 | −1.1 | ||
Turnout | 29,013 | 95.9 | |||
Two-party-preferred result | |||||
Labor | Carole Marple | 16,810 | 60.9 | −3.9 | |
Liberal | Timothy Warner | 10,807 | 39.1 | +3.9 | |
Labor hold | Swing | -3.9 | |||
Party | Candidate | Votes | % | ±% | |
---|---|---|---|---|---|
Liberal | Barry Traynor | 14,133 | 50.1 | +5.9 | |
Labor | Frank Sheehan | 12,818 | 45.5 | −0.5 | |
Independent | Petra Krjutschkow | 1,242 | 4.4 | +4.4 | |
Total formal votes | 28,193 | 97.5 | +0.0 | ||
Informal votes | 716 | 2.5 | −0.0 | ||
Turnout | 28,909 | 95.8 | |||
Two-party-preferred result | |||||
Liberal | Barry Traynor | 14,529 | 51.6 | +1.1 | |
Labor | Frank Sheehan | 13,654 | 48.4 | −1.1 | |
Liberal hold | Swing | +1.1 | |||
Party | Candidate | Votes | % | ±% | |
---|---|---|---|---|---|
Liberal | Paul Jenkins | 14,091 | 48.8 | +2.9 | |
Labor | Karen Overington | 12,204 | 42.3 | −3.4 | |
Independent | Joan Chambers | 1,456 | 5.0 | +5.0 | |
Independent | David White | 721 | 2.5 | +2.5 | |
Independent | Noel Vodden | 410 | 1.4 | +1.4 | |
Total formal votes | 28,882 | 97.2 | −0.9 | ||
Informal votes | 833 | 2.8 | +0.9 | ||
Turnout | 29,715 | 96.6 | |||
Two-party-preferred result | |||||
Liberal | Paul Jenkins | 15,210 | 52.7 | +1.0 | |
Labor | Karen Overington | 13,640 | 47.3 | −1.0 | |
Liberal hold | Swing | +1.0 | |||
Party | Candidate | Votes | % | ±% | |
---|---|---|---|---|---|
Liberal | Gordon Ashley | 16,806 | 53.8 | +11.0 | |
Labor | Kay Setches | 11,586 | 37.1 | −11.3 | |
Independent | Norma Corr | 2,844 | 9.1 | +9.1 | |
Total formal votes | 31,236 | 96.8 | −0.2 | ||
Informal votes | 1,039 | 3.2 | +0.2 | ||
Turnout | 32,275 | 95.2 | |||
Two-party-preferred result | |||||
Liberal | Gordon Ashley | 17,807 | 57.1 | +10.1 | |
Labor | Kay Setches | 13,365 | 42.9 | −10.1 | |
Liberal gain from Labor | Swing | +10.1 | |||
Party | Candidate | Votes | % | ±% | |
---|---|---|---|---|---|
Liberal | Garry Spry | 14,333 | 50.1 | +7.3 | |
Labor | Graham Ernst | 10,402 | 36.3 | −7.8 | |
Geelong Community | Malcolm Brough | 2,651 | 9.3 | +9.3 | |
Independent | Gary MacNeill | 1,241 | 4.3 | +4.3 | |
Total formal votes | 28,627 | 97.6 | −0.1 | ||
Informal votes | 706 | 2.4 | +0.1 | ||
Turnout | 29,333 | 95.9 | |||
Two-party-preferred result | |||||
Liberal | Garry Spry | 16,533 | 57.9 | +6.8 | |
Labor | Graham Ernst | 12,026 | 42.1 | −6.8 | |
Liberal hold | Swing | +6.8 | |||
Party | Candidate | Votes | % | ±% | |
---|---|---|---|---|---|
National | Pat McNamara | 20,306 | 68.2 | +25.8 | |
Labor | Anne Cox | 7,984 | 26.8 | −0.3 | |
Independent | Brian Lumsden | 1,491 | 5.0 | +5.0 | |
Total formal votes | 29,781 | 97.7 | −0.2 | ||
Informal votes | 686 | 2.3 | +0.2 | ||
Turnout | 30,467 | 95.8 | |||
Two-party-preferred result | |||||
National | Pat McNamara | 21,085 | 70.8 | +0.2 | |
Labor | Anne Cox | 8,687 | 29.2 | −0.2 | |
National hold | Swing | +0.2 | |||
Party | Candidate | Votes | % | ±% | |
---|---|---|---|---|---|
Liberal | Tony Plowman | 12,737 | 44.3 | −11.5 | |
Labor | Phil Burrows | 8,251 | 28.7 | +2.5 | |
Independent | Nelson McIntosh | 5,105 | 17.8 | +17.8 | |
Independent | Kevin Smith | 1,760 | 6.1 | +6.1 | |
Independent | Rosslyn Murtagh | 893 | 3.1 | +3.1 | |
Total formal votes | 28,746 | 96.9 | −0.7 | ||
Informal votes | 924 | 3.1 | +0.7 | ||
Turnout | 29,670 | 94.3 | |||
Two-party-preferred result | |||||
Liberal | Tony Plowman | 18,572 | 64.7 | −7.1 | |
Labor | Phil Burrows | 10,113 | 35.3 | +7.1 | |
Liberal hold | Swing | -7.1 | |||
Party | Candidate | Votes | % | ±% | |
---|---|---|---|---|---|
Liberal | Michael John | 15,755 | 53.9 | +13.6 | |
Labor | Bill Murray | 10,760 | 36.8 | −4.9 | |
Independent | Michael Carty | 1,651 | 5.7 | +5.7 | |
Independent | Gayle Joyberry | 1,042 | 3.6 | +3.6 | |
Total formal votes | 29,208 | 97.8 | −0.1 | ||
Informal votes | 649 | 2.2 | +0.1 | ||
Turnout | 29,857 | 96.3 | |||
Two-party-preferred result | |||||
Liberal | Michael John | 17,245 | 59.1 | +4.0 | |
Labor | Bill Murray | 11,959 | 40.9 | −4.0 | |
Liberal hold | Swing | +4.0 | |||
Party | Candidate | Votes | % | ±% | |
---|---|---|---|---|---|
Labor | David Kennedy | 13,763 | 45.5 | −0.1 | |
Liberal | Max Turner | 10,788 | 35.7 | +5.3 | |
National | Tony Southcombe | 3,995 | 13.2 | −1.2 | |
Independent | Brian Keogh | 1,683 | 5.6 | +5.6 | |
Total formal votes | 30,229 | 97.7 | +0.3 | ||
Informal votes | 703 | 2.3 | −0.3 | ||
Turnout | 30,932 | 96.1 | |||
Two-party-preferred result | |||||
Liberal | Max Turner | 15,433 | 51.1 | +2.7 | |
Labor | David Kennedy | 14,760 | 48.9 | −2.7 | |
Liberal gain from Labor | Swing | +2.7 | |||
Party | Candidate | Votes | % | ±% | |
---|---|---|---|---|---|
Liberal | Geoff Coleman | 17,256 | 56.8 | +6.0 | |
Labor | Jan Kennedy | 10,306 | 33.9 | −7.7 | |
Natural Law | Denis Quinlan | 1,066 | 3.5 | +3.5 | |
Independent | David Veitch | 973 | 3.2 | +3.2 | |
Independent | Douglas Johnston | 801 | 2.6 | +2.6 | |
Total formal votes | 30,402 | 96.3 | −0.7 | ||
Informal votes | 1,172 | 3.7 | +0.7 | ||
Turnout | 31,574 | 95.2 | |||
Two-party-preferred result | |||||
Liberal | Geoff Coleman | 18,756 | 61.8 | +8.5 | |
Labor | Jan Kennedy | 11,594 | 38.2 | −8.5 | |
Liberal hold | Swing | +8.5 | |||
Party | Candidate | Votes | % | ±% | |
---|---|---|---|---|---|
Liberal | Inga Peulich | 16,197 | 52.6 | +9.4 | |
Labor | Ann Barker | 11,316 | 36.8 | −8.8 | |
Independent | John Little | 2,037 | 6.6 | +6.6 | |
Independent | Greg Alabaster | 1,036 | 3.4 | +3.4 | |
Independent | David James | 184 | 0.6 | +0.6 | |
Total formal votes | 30,770 | 96.5 | +0.6 | ||
Informal votes | 1,115 | 3.5 | −0.6 | ||
Turnout | 31,885 | 95.0 | |||
Two-party-preferred result | |||||
Liberal | Inga Peulich | 17,856 | 58.2 | +9.7 | |
Labor | Ann Barker | 12,843 | 41.8 | −9.7 | |
Liberal gain from Labor | Swing | +9.7 | |||
Party | Candidate | Votes | % | ±% | |
---|---|---|---|---|---|
Liberal | Robert Dean | 14,750 | 50.5 | +5.5 | |
Labor | Rob Jolly | 10,786 | 36.9 | −16.7 | |
Independent | John Hastie | 1,877 | 6.4 | +6.4 | |
Independent | Lynne Dickson | 1,295 | 4.4 | +4.4 | |
Independent | Steve Maloney | 491 | 1.7 | +1.7 | |
Total formal votes | 29,199 | 95.8 | +1.1 | ||
Informal votes | 1,284 | 4.2 | −1.1 | ||
Turnout | 30,483 | 95.9 | |||
Two-party-preferred result | |||||
Liberal | Robert Dean | 16,512 | 57.0 | +11.6 | |
Labor | Rob Jolly | 12,459 | 43.0 | −11.6 | |
Liberal gain from Labor | Swing | +11.6 | |||
Party | Candidate | Votes | % | ±% | |
---|---|---|---|---|---|
Liberal | Robert Clark | 18,547 | 60.3 | +5.1 | |
Labor | Margaret Ray | 10,066 | 32.7 | −8.7 | |
Independent | John Baird | 1,843 | 6.0 | +6.0 | |
Independent | David Shimmins | 307 | 1.0 | +1.0 | |
Total formal votes | 30,763 | 97.3 | +0.2 | ||
Informal votes | 850 | 2.7 | −0.2 | ||
Turnout | 31,613 | 95.3 | |||
Two-party-preferred result | |||||
Liberal | Robert Clark | 19,423 | 63.2 | +6.2 | |
Labor | Margaret Ray | 11,298 | 36.8 | −6.2 | |
Liberal hold | Swing | +6.2 | |||
Party | Candidate | Votes | % | ±% | |
---|---|---|---|---|---|
Liberal | Alan Stockdale | 20,936 | 70.3 | +8.8 | |
Labor | Leigh Jones | 7,016 | 23.5 | −12.4 | |
Natural Law | Keith Pryor | 1,491 | 5.0 | +5.0 | |
Pensioner and CIR | John Casley | 355 | 1.2 | +1.2 | |
Total formal votes | 29,798 | 96.7 | −0.4 | ||
Informal votes | 1,004 | 3.3 | +0.4 | ||
Turnout | 30,802 | 94.0 | |||
Two-party-preferred result | |||||
Liberal | Alan Stockdale | 21,686 | 72.8 | +10.2 | |
Labor | Leigh Johns | 8,092 | 27.2 | −10.2 | |
Liberal hold | Swing | +10.2 | |||
Party | Candidate | Votes | % | ±% | |
---|---|---|---|---|---|
Labor | Jim Kennan | 16,380 | 59.8 | +1.8 | |
Liberal | Geoff Lutz | 7,259 | 26.5 | +4.6 | |
Independent | Lynda Blundell | 3,768 | 13.7 | +13.7 | |
Total formal votes | 27,407 | 94.7 | +0.9 | ||
Informal votes | 1,523 | 5.3 | −0.9 | ||
Turnout | 28,930 | 93.8 | |||
Two-party-preferred result | |||||
Labor | Jim Kennan | 18,995 | 69.4 | +6.8 | |
Liberal | Geoff Lutz | 8,369 | 30.6 | −6.8 | |
Labor hold | Swing | +6.8 | |||
Party | Candidate | Votes | % | ±% | |
---|---|---|---|---|---|
Liberal | David Perrin | 20,200 | 68.2 | +9.0 | |
Labor | Peter De Angelis | 9,399 | 31.8 | −9.0 | |
Total formal votes | 29,599 | 95.8 | +0.3 | ||
Informal votes | 1,300 | 4.2 | −0.3 | ||
Turnout | 30,899 | 95.3 | |||
Liberal hold | Swing | +9.0 | |||
Party | Candidate | Votes | % | ±% | |
---|---|---|---|---|---|
Labor | Sherryl Garbutt | 15,230 | 47.4 | −11.3 | |
Liberal | Olga Venables | 14,832 | 46.2 | +5.4 | |
Natural Law | Santo Consolino | 1,174 | 3.7 | +3.7 | |
Independent | Roman Klis | 878 | 2.7 | +2.7 | |
Total formal votes | 32,114 | 96.3 | +0.1 | ||
Informal votes | 1,245 | 3.7 | −0.1 | ||
Turnout | 33,359 | 96.2 | |||
Two-party-preferred result | |||||
Labor | Sherryl Garbutt | 16,390 | 51.1 | −8.0 | |
Liberal | Olga Venables | 15,671 | 48.9 | +8.0 | |
Labor hold | Swing | -8.0 | |||
Party | Candidate | Votes | % | ±% | |
---|---|---|---|---|---|
Liberal | Jeff Kennett | 17,560 | 57.2 | +7.7 | |
Labor | Frank Dempsey | 10,098 | 32.9 | −11.8 | |
Natural Law | Richard Aldous | 1,265 | 4.1 | +4.1 | |
Independent | Jon Sonnberg | 950 | 3.1 | +3.1 | |
Independent | Geoff Dreschler | 800 | 2.6 | +2.6 | |
Total formal votes | 30,673 | 96.8 | −0.4 | ||
Informal votes | 1,023 | 3.2 | +0.4 | ||
Turnout | 31,696 | 95.0 | |||
Two-party-preferred result | |||||
Liberal | Jeff Kennett | 18,157 | 59.3 | +7.1 | |
Labor | Frank Dempsey | 12,452 | 40.7 | −7.1 | |
Liberal hold | Swing | +7.1 | |||
Party | Candidate | Votes | % | ±% | |
---|---|---|---|---|---|
Liberal | John Robinson | 14,374 | 46.7 | +4.2 | |
Labor | Mal Sandon | 13,708 | 44.6 | −11.2 | |
Independent | Merran Jones | 1,046 | 3.4 | +3.4 | |
Natural Law | Bev Nelson | 931 | 3.0 | +3.0 | |
Independent | Mark Dunn | 478 | 1.6 | +1.6 | |
Independent | Mark Williams | 213 | 0.7 | +0.7 | |
Total formal votes | 30,750 | 96.4 | +0.0 | ||
Informal votes | 1,163 | 3.6 | −0.0 | ||
Turnout | 31,913 | 95.4 | |||
Two-party-preferred result | |||||
Labor | Mal Sandon | 15,598 | 50.9 | −5.7 | |
Liberal | John Robinson | 15,058 | 49.1 | +5.7 | |
Labor hold | Swing | -5.7 | |||
Party | Candidate | Votes | % | ±% | |
---|---|---|---|---|---|
Liberal | Ted Tanner | 19,842 | 63.9 | +9.8 | |
Labor | Valerie Nicholls | 11,194 | 36.1 | −9.8 | |
Total formal votes | 31,036 | 95.8 | +0.4 | ||
Informal votes | 1,365 | 4.2 | −0.4 | ||
Turnout | 32,401 | 93.1 | |||
Liberal hold | Swing | +9.8 | |||
Party | Candidate | Votes | % | ±% | |
---|---|---|---|---|---|
Labor | Gerard Vaughan | 15,377 | 51.5 | −6.7 | |
Liberal | George Emmanouil | 11,285 | 37.8 | +3.6 | |
Independent | Sue Phillips | 1,132 | 3.8 | +3.8 | |
Independent | Bryan Rogerson | 907 | 3.0 | +3.0 | |
Independent | Philip Kelada | 611 | 2.0 | +2.0 | |
Independent | Jimmy Emmanuel | 558 | 1.9 | +1.9 | |
Total formal votes | 29,870 | 93.3 | +0.3 | ||
Informal votes | 2,158 | 6.7 | −0.3 | ||
Turnout | 32,028 | 93.8 | |||
Two-party-preferred result | |||||
Labor | Gerard Vaughan | 17,391 | 58.4 | −2.6 | |
Liberal | George Emmanouil | 12,400 | 41.6 | +2.6 | |
Labor hold | Swing | -2.6 | |||
Party | Candidate | Votes | % | ±% | |
---|---|---|---|---|---|
Labor | Tom Roper | 14,662 | 50.8 | −11.6 | |
Liberal | Ross Lazzaro | 8,394 | 29.1 | +2.2 | |
Independent | Norma Willoughby | 2,396 | 8.3 | +2.8 | |
Pensioner and CIR | Katheryne Savage | 1,506 | 5.2 | +5.2 | |
Independent | Jeff Sullivan | 1,165 | 4.0 | +4.0 | |
Natural Law | Byron Rigby | 725 | 2.5 | +2.5 | |
Total formal votes | 28,848 | 94.1 | +1.0 | ||
Informal votes | 1,813 | 5.9 | −1.0 | ||
Turnout | 30,661 | 92.3 | |||
Two-party-preferred result | |||||
Labor | Tom Roper | 17,569 | 61.2 | −4.5 | |
Liberal | Ross Lazzaro | 11,142 | 38.8 | +4.5 | |
Labor hold | Swing | -4.5 | |||
Party | Candidate | Votes | % | ±% | |
---|---|---|---|---|---|
Liberal | Gary Rowe | 15,949 | 51.8 | +6.1 | |
Labor | Ray Bastin | 11,271 | 36.6 | −10.6 | |
Independent | Donald Brooke | 763 | 2.5 | +2.5 | |
Independent | Lorelle O'Riley | 703 | 2.3 | +2.3 | |
Independent | Bill McCluskey | 652 | 2.1 | +2.1 | |
Natural Law | Gary Nelson | 558 | 1.8 | +1.8 | |
Independent | Carol Fisher | 542 | 1.8 | +1.8 | |
Independent | Eddy Van Eck | 336 | 1.1 | +1.1 | |
Total formal votes | 30,774 | 96.0 | −0.7 | ||
Informal votes | 1,267 | 4.0 | +0.7 | ||
Turnout | 32,041 | 96.8 | |||
Two-party-preferred result | |||||
Liberal | Gary Rowe | 16,771 | 54.7 | +6.1 | |
Labor | Ray Bastin | 13,886 | 45.3 | −6.1 | |
Liberal gain from Labor | Swing | +6.1 | |||
Party | Candidate | Votes | % | ±% | |
---|---|---|---|---|---|
Labor | John Pandazopoulos | 13,386 | 45.6 | −15.2 | |
Liberal | Rodney Lavin | 12,110 | 41.3 | +2.6 | |
Independent | Christine Ware | 1,824 | 6.2 | +6.2 | |
Independent | Rob Wilson | 1,584 | 5.4 | +5.4 | |
Independent | Ron Coomber | 435 | 1.5 | +1.5 | |
Total formal votes | 29,339 | 93.4 | −0.7 | ||
Informal votes | 2,060 | 6.6 | +0.7 | ||
Turnout | 31,399 | 94.9 | |||
Two-party-preferred result | |||||
Labor | John Pandazopoulos | 15,436 | 53.1 | −8.1 | |
Liberal | Rodney Lavin | 13,661 | 46.9 | +8.1 | |
Labor hold | Swing | -8.1 | |||
Party | Candidate | Votes | % | ±% | |
---|---|---|---|---|---|
Labor | Jan Wilson | 14,673 | 50.1 | −8.0 | |
Liberal | Maree Luckins | 14,637 | 49.9 | +8.0 | |
Total formal votes | 29,310 | 94.5 | +1.3 | ||
Informal votes | 1,690 | 5.5 | −1.3 | ||
Turnout | 31,000 | 95.3 | |||
Labor hold | Swing | -8.0 | |||
Party | Candidate | Votes | % | ±% | |
---|---|---|---|---|---|
Liberal | Victor Perton | 20,997 | 68.1 | +10.6 | |
Labor | Chris Nisiforou | 9,848 | 31.9 | −10.6 | |
Total formal votes | 30,845 | 96.1 | −0.3 | ||
Informal votes | 1,248 | 3.9 | +0.3 | ||
Turnout | 32,093 | 95.6 | |||
Liberal hold | Swing | +10.6 | |||
Party | Candidate | Votes | % | ±% | |
---|---|---|---|---|---|
Liberal | Tony Hyams | 17,487 | 58.2 | +8.1 | |
Labor | Kenneth Templar | 10,222 | 34.0 | −11.5 | |
Natural Law | Irenee Orr | 2,331 | 7.8 | +7.8 | |
Total formal votes | 30,040 | 97.0 | −0.4 | ||
Informal votes | 936 | 3.0 | +0.4 | ||
Turnout | 30,976 | 95.2 | |||
Two-party-preferred result | |||||
Liberal | Tony Hyams | 18,587 | 62.0 | +10.8 | |
Labor | Kenneth Templar | 11,409 | 38.0 | −10.8 | |
Liberal hold | Swing | +10.8 | |||
Party | Candidate | Votes | % | ±% | |
---|---|---|---|---|---|
Liberal | Wayne Phillips | 18,823 | 57.0 | +11.9 | |
Labor | Alan Baker | 11,514 | 34.9 | −19.0 | |
Independent | Bob West | 1,504 | 4.6 | +4.6 | |
Natural Law | Steve Davies | 1,185 | 3.6 | +3.6 | |
Total formal votes | 33,026 | 97.3 | +0.2 | ||
Informal votes | 915 | 2.7 | −0.2 | ||
Turnout | 33,941 | 96.2 | |||
Two-party-preferred result | |||||
Liberal | Wayne Phillips | 19,794 | 60.0 | +14.6 | |
Labor | Alan Baker | 13,175 | 40.0 | −14.6 | |
Liberal gain from Labor | Swing | +14.6 | |||
Party | Candidate | Votes | % | ±% | |
---|---|---|---|---|---|
Labor | Judy Maddigan | 13,046 | 44.0 | −10.0 | |
Liberal | Ian Davis | 12,757 | 43.0 | +1.0 | |
Independent | Rowena Allsop | 2,341 | 7.9 | +7.9 | |
Independent | Geoff Ireland | 875 | 3.0 | +3.0 | |
Natural Law | John Bell | 628 | 2.1 | +2.1 | |
Total formal votes | 29,647 | 96.3 | +0.7 | ||
Informal votes | 1,145 | 3.7 | −0.7 | ||
Turnout | 30,792 | 93.8 | |||
Two-party-preferred result | |||||
Liberal | Ian Davis | 15,159 | 51.2 | +6.7 | |
Labor | Judy Maddigan | 14,429 | 48.8 | −6.7 | |
Liberal gain from Labor | Swing | +6.7 | |||
Party | Candidate | Votes | % | ±% | |
---|---|---|---|---|---|
Liberal | Jim Plowman | 17,445 | 58.3 | +6.6 | |
Labor | Lydia MacMichael | 9,003 | 30.1 | −14.3 | |
Independent | Rick Houlihan | 3,473 | 11.6 | +11.6 | |
Total formal votes | 29,921 | 96.7 | −0.5 | ||
Informal votes | 1,016 | 3.3 | +0.5 | ||
Turnout | 30,937 | 95.6 | |||
Two-party-preferred result | |||||
Liberal | Jim Plowman | 19,485 | 65.2 | +12.0 | |
Labor | Lydia MacMichael | 10,382 | 34.8 | −12.0 | |
Liberal hold | Swing | +12.0 | |||
Party | Candidate | Votes | % | ±% | |
---|---|---|---|---|---|
Labor | Bruce Mildenhall | 16,408 | 57.9 | −9.5 | |
Liberal | Chris MacGregor | 7,606 | 26.8 | +1.0 | |
Independent | Libby Krepp | 2,123 | 7.5 | +7.5 | |
Independent | Hans Paas | 1,060 | 3.7 | +3.7 | |
Independent | David Connolly | 680 | 2.4 | +2.4 | |
Independent | Colleen Hartland | 486 | 1.7 | +1.7 | |
Total formal votes | 28,363 | 92.8 | +0.8 | ||
Informal votes | 2,207 | 7.2 | −0.8 | ||
Turnout | 30,570 | 93.7 | |||
Two-party-preferred result | |||||
Labor | Bruce Mildenhall | 18,719 | 66.2 | −6.1 | |
Liberal | Chris MacGregor | 9,562 | 33.8 | +6.1 | |
Labor hold | Swing | -6.1 | |||
Party | Candidate | Votes | % | ±% | |
---|---|---|---|---|---|
Liberal | John Richardson | 19,989 | 65.3 | +11.9 | |
Labor | Helen Zenkis | 10,600 | 34.7 | −11.9 | |
Total formal votes | 30,589 | 96.0 | −0.2 | ||
Informal votes | 1,287 | 4.0 | +0.2 | ||
Turnout | 31,876 | 95.5 | |||
Liberal hold | Swing | +11.9 | |||
Party | Candidate | Votes | % | ±% | |
---|---|---|---|---|---|
Liberal | Graeme Weideman | 18,447 | 63.2 | +7.9 | |
Labor | Rohan Cresp | 8,192 | 28.1 | −14.7 | |
Natural Law | Margaret Dawson | 1,217 | 4.2 | +4.2 | |
Independent | Judy Hale | 903 | 3.1 | +3.1 | |
Independent | Richard Hargrave | 411 | 1.4 | +1.4 | |
Total formal votes | 29,170 | 97.2 | +0.2 | ||
Informal votes | 850 | 2.8 | −0.2 | ||
Turnout | 30,020 | 94.5 | |||
Two-party-preferred result | |||||
Liberal | Graeme Weideman | 19,661 | 67.5 | +11.4 | |
Labor | Rohan Cresp | 9,451 | 32.5 | −11.4 | |
Liberal hold | Swing | +11.4 | |||
Party | Candidate | Votes | % | ±% | |
---|---|---|---|---|---|
Liberal | Peter McLellan | 12,470 | 46.6 | +5.9 | |
Labor | Jane Hill | 11,661 | 43.6 | −11.1 | |
Pensioner and CIR | Ray Stirling | 770 | 2.9 | +2.9 | |
Independent | David Taylor | 669 | 2.5 | +2.5 | |
Independent | Mike Toldy | 657 | 2.5 | −2.1 | |
Independent | Greg Graham | 542 | 2.0 | +2.0 | |
Total formal votes | 26,769 | 95.7 | −0.6 | ||
Informal votes | 1,197 | 4.3 | +0.6 | ||
Turnout | 27,966 | 96.2 | |||
Two-party-preferred result | |||||
Liberal | Peter McLellan | 13,407 | 50.2 | +6.7 | |
Labor | Jane Hill | 13,276 | 49.8 | −6.7 | |
Liberal gain from Labor | Swing | +6.7 | |||
Party | Candidate | Votes | % | ±% | |
---|---|---|---|---|---|
Liberal | Ann Henderson | 14,388 | 45.8 | +1.9 | |
Labor | Hayden Shell | 12,848 | 40.9 | −8.9 | |
Geelong Community | Roger Kent | 4,201 | 13.4 | +13.4 | |
Total formal votes | 31,437 | 97.2 | +0.3 | ||
Informal votes | 914 | 2.8 | −0.3 | ||
Turnout | 32,351 | 94.9 | |||
Two-party-preferred result | |||||
Liberal | Ann Henderson | 15,890 | 50.7 | +3.3 | |
Labor | Hayden Shell | 15,478 | 49.3 | −3.3 | |
Liberal gain from Labor | Swing | +3.3 | |||
Party | Candidate | Votes | % | ±% | |
---|---|---|---|---|---|
Labor | Peter Loney | 15,653 | 52.2 | −9.5 | |
Liberal | Jim Fidge | 10,965 | 36.6 | +2.9 | |
Geelong Community | Mae Dunstan | 3,360 | 11.2 | +11.2 | |
Total formal votes | 29,978 | 95.1 | 0.0 | ||
Informal votes | 1,541 | 4.9 | 0.0 | ||
Turnout | 31,519 | 95.8 | |||
Two-party-preferred result | |||||
Labor | Peter Loney | 17,826 | 59.6 | −4.6 | |
Liberal | Jim Fidge | 12,102 | 40.4 | +4.6 | |
Labor hold | Swing | -4.6 | |||
Party | Candidate | Votes | % | ±% | |
---|---|---|---|---|---|
National | David Treasure | 16,225 | 56.5 | +8.9 | |
Labor | John Halloran | 5,869 | 20.4 | −9.1 | |
Independent | Bruce Ellett | 3,099 | 10.8 | +10.8 | |
Independent | Roger Steedman | 1,732 | 6.0 | +6.0 | |
Independent | Ian Honey | 1,274 | 4.4 | +4.4 | |
Independent | Bob Lansbury | 526 | 1.8 | +1.8 | |
Total formal votes | 28,725 | 97.8 | −0.1 | ||
Informal votes | 659 | 2.2 | +0.1 | ||
Turnout | 29,384 | 95.1 | |||
Two-party-preferred result | |||||
National | David Treasure | 21,053 | 73.4 | +4.2 | |
Labor | John Halloran | 7,639 | 26.6 | −4.2 | |
National hold | Swing | +4.2 | |||
Party | Candidate | Votes | % | ±% | |
---|---|---|---|---|---|
National | Peter Ryan | 19,879 | 65.3 | +17.2 | |
Labor | Brian Burleigh | 7,035 | 23.1 | −3.1 | |
Independent | Roger Stephens | 2,596 | 8.5 | +8.5 | |
Independent | Vaughan Wareham | 934 | 3.1 | +3.1 | |
Total formal votes | 30,444 | 97.7 | −0.3 | ||
Informal votes | 706 | 2.3 | +0.3 | ||
Turnout | 31,150 | 95.2 | |||
Two-party-preferred result | |||||
National | Peter Ryan | 22,490 | 73.9 | +2.9 | |
Labor | Brian Burleigh | 7,937 | 26.1 | −2.9 | |
National hold | Swing | +2.9 | |||
Party | Candidate | Votes | % | ±% | |
---|---|---|---|---|---|
Liberal | Alan Brown | 18,000 | 65.3 | +13.6 | |
Labor | Anwyn Martin | 8,158 | 29.6 | −6.9 | |
Natural Law | Trevor Witt | 1,424 | 5.2 | +5.2 | |
Total formal votes | 27,582 | 97.4 | −0.5 | ||
Informal votes | 738 | 2.6 | +0.5 | ||
Turnout | 28,320 | 96.0 | |||
Two-party-preferred result | |||||
Liberal | Alan Brown | 18,700 | 67.9 | +5.5 | |
Labor | Anwyn Martin | 8,847 | 32.1 | −5.5 | |
Liberal hold | Swing | +5.5 | |||
Party | Candidate | Votes | % | ±% | |
---|---|---|---|---|---|
Liberal | Tom Reynolds | 18,478 | 62.9 | +7.7 | |
Labor | Barry Rowe | 10,905 | 37.1 | −5.5 | |
Total formal votes | 29,383 | 97.1 | −0.4 | ||
Informal votes | 865 | 2.9 | +0.4 | ||
Turnout | 30,248 | 95.6 | |||
Liberal hold | Swing | +5.5 | |||
Party | Candidate | Votes | % | ±% | |
---|---|---|---|---|---|
Liberal | Ross Smith | 19,774 | 67.0 | +13.0 | |
Labor | Ben Moon | 8,081 | 27.4 | −12.2 | |
Independent | Peter Olney | 1,652 | 5.6 | +2.8 | |
Total formal votes | 29,507 | 96.8 | +0.1 | ||
Informal votes | 991 | 3.2 | −0.1 | ||
Turnout | 30,498 | 95.8 | |||
Two-party-preferred result | |||||
Liberal | Ross Smith | 20,477 | 69.5 | +12.3 | |
Labor | Ben Moon | 8,969 | 30.5 | −12.3 | |
Liberal hold | Swing | +12.3 | |||
Party | Candidate | Votes | % | ±% | |
---|---|---|---|---|---|
Liberal | Phil Gude | 20,571 | 65.0 | +6.4 | |
Labor | Gordon McCaskie | 8,096 | 25.6 | −15.5 | |
Natural Law | Lorna Scurfield | 2,983 | 9.4 | +9.4 | |
Total formal votes | 31,650 | 97.1 | +0.2 | ||
Informal votes | 933 | 2.9 | −0.2 | ||
Turnout | 32,583 | 94.0 | |||
Two-party-preferred result | |||||
Liberal | Phil Gude | 21,619 | 68.4 | +9.6 | |
Labor | Gordon McCaskie | 9,984 | 31.6 | −9.6 | |
Liberal hold | Swing | +9.6 | |||
Party | Candidate | Votes | % | ±% | |
---|---|---|---|---|---|
Liberal | Vin Heffernan | 15,318 | 50.9 | +6.3 | |
Labor | Chris Watson | 12,226 | 40.6 | −9.3 | |
Natural Law | Steve Griffith | 1,315 | 4.4 | +4.4 | |
Independent | K.H. Schuller | 858 | 2.8 | +2.8 | |
Independent | Steriani Vassis | 406 | 1.3 | +1.3 | |
Total formal votes | 30,123 | 96.4 | +0.1 | ||
Informal votes | 1,138 | 3.6 | −0.1 | ||
Turnout | 31,261 | 95.4 | |||
Two-party-preferred result | |||||
Liberal | Vin Heffernan | 16,330 | 54.3 | +8.2 | |
Labor | Chris Watson | 13,743 | 45.7 | −8.2 | |
Liberal gain from Labor | Swing | +8.2 | |||
Party | Candidate | Votes | % | ±% | |
---|---|---|---|---|---|
Labor | George Seitz | 16,154 | 52.8 | −4.9 | |
Liberal | Stephen Carter | 11,319 | 37.0 | +3.4 | |
Independent | Vanessa Wheeler | 2,114 | 6.9 | +6.9 | |
Independent | Jim Miller | 1,032 | 3.4 | +3.4 | |
Total formal votes | 30,619 | 94.4 | +2.4 | ||
Informal votes | 1,809 | 5.6 | −2.4 | ||
Turnout | 32,428 | 95.5 | |||
Two-party-preferred result | |||||
Labor | George Seitz | 18,015 | 58.9 | −1.6 | |
Liberal | Stephen Carter | 12,548 | 41.1 | +1.6 | |
Labor hold | Swing | -1.6 | |||
Party | Candidate | Votes | % | ±% | |
---|---|---|---|---|---|
Liberal | Jan Wade | 20,484 | 67.9 | +5.6 | |
Labor | Wayne Clarke | 7,115 | 23.6 | −14.2 | |
Independent | Jonathan Shepherd | 2,570 | 8.5 | +8.5 | |
Total formal votes | 30,169 | 97.0 | +0.3 | ||
Informal votes | 946 | 3.0 | −0.3 | ||
Turnout | 31,115 | 94.1 | |||
Two-party-preferred result | |||||
Liberal | Jan Wade | 21,553 | 71.5 | +9.3 | |
Labor | Wayne Clarke | 8,578 | 28.5 | −9.3 | |
Liberal hold | Swing | +9.3 | |||
Party | Candidate | Votes | % | ±% | |
---|---|---|---|---|---|
Liberal | Hurtle Lupton | 15,281 | 50.2 | +9.2 | |
Labor | Carolyn Hirsh | 11,081 | 36.4 | −16.6 | |
Independent | Peter Herbert | 2,350 | 7.7 | +7.7 | |
Independent | Bill Johnson | 1,725 | 5.7 | +5.7 | |
Total formal votes | 30,437 | 97.0 | +0.7 | ||
Informal votes | 926 | 3.0 | −0.7 | ||
Turnout | 31,363 | 95.9 | |||
Two-party-preferred result | |||||
Liberal | Hurtle Lupton | 17,005 | 56.1 | +11.1 | |
Labor | Carolyn Hirsh | 13,292 | 43.9 | −11.1 | |
Liberal gain from Labor | Swing | +11.1 | |||
Party | Candidate | Votes | % | ±% | |
---|---|---|---|---|---|
Liberal | Robert Doyle | 21,065 | 68.7 | +5.6 | |
Labor | Anthony van der Craats | 7,342 | 24.0 | −12.5 | |
Natural Law | Lesley Mendelson | 2,243 | 7.3 | +7.3 | |
Total formal votes | 30,650 | 97.2 | +0.4 | ||
Informal votes | 876 | 2.8 | −0.4 | ||
Turnout | 31,526 | 93.3 | |||
Two-party-preferred result | |||||
Liberal | Robert Doyle | 22,196 | 72.5 | +9.2 | |
Labor | Anthony van der Craats | 8,426 | 27.5 | −9.2 | |
Liberal hold | Swing | +9.2 | |||
Party | Candidate | Votes | % | ±% | |
---|---|---|---|---|---|
Labor | Neil Cole | 14,731 | 51.5 | −15.9 | |
Liberal | Kate Nunan | 9,391 | 32.8 | +1.5 | |
Democrats | Bryce Vissel | 2,319 | 8.1 | +8.1 | |
Independent | Dean Reynolds | 824 | 2.9 | +2.9 | |
Independent | Dave Holmes | 658 | 2.3 | +2.3 | |
Natural Law | Tony Botsman | 517 | 1.8 | +1.8 | |
Independent | John Dobinson | 156 | 0.5 | +0.5 | |
Total formal votes | 28,596 | 94.0 | +0.7 | ||
Informal votes | 1,826 | 6.0 | −0.7 | ||
Turnout | 30,422 | 90.6 | |||
Two-party-preferred result | |||||
Labor | Neil Cole | 17,721 | 62.1 | −5.8 | |
Liberal | Kate Nunan | 10,807 | 37.9 | +5.8 | |
Labor hold | Swing | -5.8 | |||
Party | Candidate | Votes | % | ±% | |
---|---|---|---|---|---|
Labor | David Cunningham | 15,184 | 53.0 | −3.7 | |
Liberal | Therese Samson | 10,159 | 35.5 | +3.9 | |
Independent | Peter Taylor | 1,903 | 6.6 | +6.6 | |
Independent | David Toms | 1,377 | 4.8 | +4.8 | |
Total formal votes | 28,623 | 95.1 | +0.2 | ||
Informal votes | 1,462 | 4.9 | −0.2 | ||
Turnout | 30,085 | 95.3 | |||
Two-party-preferred result | |||||
Labor | David Cunningham | 16,883 | 60.0 | −2.1 | |
Liberal | Therese Samson | 11,236 | 40.0 | +2.1 | |
Labor hold | Swing | -2.1 | |||
Party | Candidate | Votes | % | ±% | |
---|---|---|---|---|---|
Liberal | Craig Bildstien | 19,141 | 65.9 | +33.6 | |
Labor | John Zigouras | 7,130 | 24.6 | +2.9 | |
Independent | Tom Campbell | 2,763 | 9.5 | +9.5 | |
Total formal votes | 29,034 | 97.5 | +0.0 | ||
Informal votes | 735 | 2.5 | −0.0 | ||
Turnout | 29,769 | 96.2 | |||
Two-party-preferred result | |||||
Liberal | Craig Bildstien | 20,579 | 70.9 | +1.1 | |
Labor | John Zigouras | 8,455 | 29.1 | −1.1 | |
Liberal hold | Swing | +1.1 | |||
Party | Candidate | Votes | % | ±% | |
---|---|---|---|---|---|
Labor | Alex Andrianopoulos | 14,722 | 50.0 | −18.4 | |
Liberal | Anthony Fernandez | 8,265 | 28.1 | +0.1 | |
Independent | Christine Craik | 4,267 | 14.5 | +14.5 | |
Independent | Janko Georgievski | 2,199 | 7.5 | +7.5 | |
Total formal votes | 29,453 | 94.9 | +1.7 | ||
Informal votes | 1,567 | 5.1 | +1.7 | ||
Turnout | 31,020 | 96.1 | |||
Two-party-preferred result | |||||
Labor | Alex Andrianopoulos | 18,318 | 62.3 | −8.4 | |
Liberal | Anthony Fernandez | 11,065 | 37.7 | +8.4 | |
Labor hold | Swing | -8.4 | |||
Party | Candidate | Votes | % | ±% | |
---|---|---|---|---|---|
Liberal | Roger Pescott | 16,735 | 54.4 | +11.6 | |
Labor | John Harrowfield | 11,504 | 37.4 | −8.9 | |
Independent | Gilbert Boffa | 2,516 | 8.2 | +8.2 | |
Total formal votes | 30,755 | 97.0 | −0.2 | ||
Informal votes | 962 | 3.0 | +0.2 | ||
Turnout | 31,717 | 95.8 | |||
Two-party-preferred result | |||||
Liberal | Roger Pescott | 17,966 | 58.5 | +10.8 | |
Labor | John Harrowfield | 12,726 | 41.5 | −10.8 | |
Liberal gain from Labor | Swing | +10.8 | |||
Party | Candidate | Votes | % | ±% | |
---|---|---|---|---|---|
Liberal | Steve McArthur | 14,584 | 50.8 | +8.4 | |
Labor | Neil Pope | 10,368 | 36.1 | −16.0 | |
Independent | Jenny Saulwick | 1,646 | 5.7 | +5.7 | |
Democrats | John McLaren | 1,568 | 5.5 | +5.2 | |
Natural Law | Bill Watson | 542 | 1.9 | +1.9 | |
Total formal votes | 28,708 | 96.9 | −0.3 | ||
Informal votes | 907 | 3.1 | +0.3 | ||
Turnout | 29,615 | 95.6 | |||
Two-party-preferred result | |||||
Liberal | Steve McArthur | 15,814 | 55.3 | +9.6 | |
Labor | Neil Pope | 12,771 | 44.7 | −9.6 | |
Liberal gain from Labor | Swing | +9.6 | |||
Party | Candidate | Votes | % | ±% | |
---|---|---|---|---|---|
Liberal | Lorraine Elliott | 16,114 | 55.3 | +11.1 | |
Labor | Mike Welsh | 9,880 | 33.9 | −13.4 | |
Independent | George Moran | 1,422 | 4.9 | +4.9 | |
Natural Law | Robert Kendi | 994 | 3.4 | +3.4 | |
Independent | Steve Raskovy | 741 | 2.5 | +2.5 | |
Total formal votes | 29,151 | 96.7 | −0.3 | ||
Informal votes | 987 | 3.3 | +0.3 | ||
Turnout | 30,138 | 98.0 | |||
Two-party-preferred result | |||||
Liberal | Lorraine Elliott | 17,469 | 60.1 | +12.0 | |
Labor | Mike Welsh | 11,596 | 39.9 | −12.0 | |
Liberal gain from Labor | Swing | +12.0 | |||
Party | Candidate | Votes | % | ±% | |
---|---|---|---|---|---|
Liberal | Geoff Leigh | 15,828 | 54.3 | +9.1 | |
Labor | Peter Spyker | 11,308 | 38.8 | −10.3 | |
Independent | Declan Stephenson | 1,157 | 4.0 | +4.0 | |
Independent | Klara Mitchell | 876 | 3.0 | +3.0 | |
Total formal votes | 29,169 | 96.4 | −0.1 | ||
Informal votes | 1,093 | 3.6 | +0.1 | ||
Turnout | 30,262 | 95.2 | |||
Two-party-preferred result | |||||
Liberal | Geoff Leigh | 16,696 | 57.3 | +9.5 | |
Labor | Peter Spyker | 12,418 | 42.7 | −9.5 | |
Liberal gain from Labor | Swing | +9.5 | |||
Party | Candidate | Votes | % | ±% | |
---|---|---|---|---|---|
Liberal | Robin Cooper | 16,760 | 59.8 | +10.4 | |
Labor | Carlyle La'Brooy | 9,262 | 33.0 | −10.8 | |
Natural Law | Jan Charlwood | 2,015 | 7.2 | +7.2 | |
Total formal votes | 28,037 | 96.7 | +0.0 | ||
Informal votes | 944 | 3.3 | −0.0 | ||
Turnout | 28,981 | 95.2 | |||
Two-party-preferred result | |||||
Liberal | Robin Cooper | 17,620 | 62.9 | +11.6 | |
Labor | Carlyle La'Brooy | 10,406 | 37.1 | −11.6 | |
Liberal hold | Swing | +11.6 | |||
Party | Candidate | Votes | % | ±% | |
---|---|---|---|---|---|
Labor | Keith Hamilton | 13,524 | 43.1 | +1.3 | |
Liberal | Martin Hill | 8,177 | 26.0 | +5.9 | |
National | Tom Wallace | 5,169 | 16.5 | +2.4 | |
Independent | Barry Murphy | 3,694 | 11.8 | −0.7 | |
Independent | Bill Mele | 642 | 2.0 | +2.0 | |
Natural Law | Martin Kirsch | 195 | 0.6 | +0.6 | |
Total formal votes | 31,401 | 97.2 | +0.6 | ||
Informal votes | 889 | 2.8 | −0.6 | ||
Turnout | 32,290 | 96.4 | |||
Two-party-preferred result | |||||
Labor | Keith Hamilton | 16,906 | 54.0 | +1.8 | |
Liberal | Martin Hill | 14,428 | 46.0 | −1.8 | |
Labor hold | Swing | +1.8 | |||
Party | Candidate | Votes | % | ±% | |
---|---|---|---|---|---|
National | Ken Jasper | 22,744 | 74.0 | +15.3 | |
Labor | Maria Keller | 7,999 | 26.0 | +0.2 | |
Total formal votes | 30,743 | 97.4 | −0.6 | ||
Informal votes | 806 | 2.6 | +0.6 | ||
Turnout | 31,549 | 95.1 | |||
National hold | Swing | +2.2 | |||
Party | Candidate | Votes | % | ±% | |
---|---|---|---|---|---|
Liberal | John Delzoppo | 15,352 | 52.3 | +10.6 | |
Labor | Brendan Jenkins | 11,794 | 40.2 | −3.9 | |
Independent | Trisha Taig | 1,456 | 5.0 | +5.0 | |
Independent | John Cross | 731 | 2.5 | +2.5 | |
Total formal votes | 29,333 | 97.6 | +0.1 | ||
Informal votes | 712 | 2.4 | −0.1 | ||
Turnout | 30,045 | 96.4 | |||
Two-party-preferred result | |||||
Liberal | John Delzoppo | 16,219 | 55.4 | +3.7 | |
Labor | Brendan Jenkins | 13,080 | 44.6 | −3.7 | |
Liberal hold | Swing | +3.7 | |||
Party | Candidate | Votes | % | ±% | |
---|---|---|---|---|---|
Labor | Bob Sercombe | 13,827 | 47.4 | −6.8 | |
Liberal | David Davis | 11,799 | 40.5 | +2.3 | |
Independent | Sam Ortisi | 2,021 | 6.9 | +6.9 | |
Independent | Dorothy Costa | 961 | 3.3 | +3.3 | |
Independent | Maria Ferrigno | 551 | 1.9 | +1.9 | |
Total formal votes | 29,159 | 94.8 | +0.4 | ||
Informal votes | 1,597 | 5.2 | −0.4 | ||
Turnout | 30,756 | 96.0 | |||
Two-party-preferred result | |||||
Labor | Bob Sercombe | 15,594 | 53.6 | −4.4 | |
Liberal | David Davis | 13,503 | 46.4 | +4.4 | |
Labor hold | Swing | -4.4 | |||
Party | Candidate | Votes | % | ±% | |
---|---|---|---|---|---|
Labor | Tony Sheehan | 16,288 | 55.1 | −16.5 | |
Liberal | Nicholas Kotsiras | 8,212 | 27.8 | −0.6 | |
Independent | Carolyn Purdue | 2,337 | 7.9 | +7.9 | |
Independent | Frank Ryan | 1,228 | 4.2 | +4.2 | |
Natural Law | Michael Dickins | 473 | 1.6 | +1.6 | |
Independent | Joe Kenwright | 320 | 1.1 | +1.1 | |
Call to Australia | Ken Cook | 257 | 0.9 | +0.9 | |
Independent | John Graham | 236 | 0.8 | +0.8 | |
Independent | Dimitrios Karmis | 201 | 0.7 | +0.7 | |
Total formal votes | 29,552 | 93.0 | +0.1 | ||
Informal votes | 2,234 | 7.0 | −0.1 | ||
Turnout | 31,786 | 93.8 | |||
Two-party-preferred result | |||||
Labor | Tony Sheehan | 19,213 | 65.2 | −6.5 | |
Liberal | Nicholas Kotsiras | 10,271 | 34.8 | +6.5 | |
Labor hold | Swing | -6.5 | |||
Party | Candidate | Votes | % | ±% | |
---|---|---|---|---|---|
Liberal | Denise McGill | 15,485 | 52.9 | +13.3 | |
Labor | Race Mathews | 13,783 | 47.1 | −2.0 | |
Total formal votes | 29,268 | 95.5 | +0.0 | ||
Informal votes | 1,376 | 4.5 | −0.0 | ||
Turnout | 30,644 | 94.1 | |||
Liberal gain from Labor | Swing | +8.6 | |||
Party | Candidate | Votes | % | ±% | |
---|---|---|---|---|---|
Liberal | Rob Maclellan | 16,251 | 57.8 | +7.2 | |
Labor | Roy Ashcroft | 8,161 | 29.0 | −12.9 | |
Independent | Gary Hipworth | 2,825 | 10.0 | +10.0 | |
Natural Law | John Hannon | 882 | 3.1 | +3.1 | |
Total formal votes | 28,119 | 97.2 | −0.2 | ||
Informal votes | 813 | 2.8 | +0.2 | ||
Turnout | 28,932 | 95.1 | |||
Two-party-preferred result | |||||
Liberal | Rob Maclellan | 18,047 | 64.4 | +11.0 | |
Labor | Roy Ashcroft | 9,975 | 35.6 | −11.0 | |
Liberal hold | Swing | +11.0 | |||
Party | Candidate | Votes | % | ±% | |
---|---|---|---|---|---|
Labor | Kelvin Thomson | 14,332 | 51.7 | −2.2 | |
Liberal | Con Karavitis | 10,374 | 37.4 | +6.7 | |
Independent | Cath Price | 1,979 | 7.1 | +0.7 | |
Independent | Anne Petrou | 1,031 | 3.7 | +3.7 | |
Total formal votes | 27,716 | 95.8 | +0.4 | ||
Informal votes | 1,224 | 4.2 | −0.4 | ||
Turnout | 28,940 | 93.7 | |||
Two-party-preferred result | |||||
Labor | Kelvin Thomson | 16,054 | 58.0 | −0.1 | |
Liberal | Con Karavitis | 11,605 | 42.0 | +0.1 | |
Labor hold | Swing | -0.1 | |||
Party | Candidate | Votes | % | ±% | |
---|---|---|---|---|---|
Liberal | Ian Smith | 19,764 | 65.8 | +12.7 | |
Labor | Fran Lehmann | 10,252 | 34.2 | +1.7 | |
Total formal votes | 30,016 | 96.9 | −1.0 | ||
Informal votes | 971 | 3.1 | +1.0 | ||
Turnout | 30,987 | 95.9 | |||
Liberal hold | Swing | +1.7 | |||
Party | Candidate | Votes | % | ±% | |
---|---|---|---|---|---|
Liberal | Denis Napthine | 19,409 | 67.1 | +20.5 | |
Labor | Bill Sharrock | 9,522 | 32.9 | −0.6 | |
Total formal votes | 28,931 | 97.3 | −1.1 | ||
Informal votes | 789 | 2.7 | +1.1 | ||
Turnout | 29,720 | 96.1 | |||
Liberal hold | Swing | +4.5 | |||
Party | Candidate | Votes | % | ±% | |
---|---|---|---|---|---|
Liberal | Don Hayward | 16,502 | 54.8 | +6.4 | |
Labor | Cynthia Levey | 10,682 | 35.4 | −11.3 | |
Greens | Francesca Davidson | 1,863 | 6.2 | +6.2 | |
Natural Law | Greg Broszczyk | 1,086 | 3.6 | +3.6 | |
Total formal votes | 30,133 | 95.9 | +0.6 | ||
Informal votes | 1,291 | 4.1 | −0.6 | ||
Turnout | 31,424 | 89.5 | |||
Two-party-preferred result | |||||
Liberal | Don Hayward | 17,387 | 57.8 | +7.5 | |
Labor | Cynthia Levey | 12,678 | 42.2 | −7.5 | |
Liberal hold | Swing | +7.5 | |||
Party | Candidate | Votes | % | ±% | |
---|---|---|---|---|---|
Labor | Michael Leighton | 17,403 | 59.6 | −3.1 | |
Liberal | George Prillwitz | 9,382 | 32.1 | +3.9 | |
Independent | Rose-Marie Celestin | 1,148 | 3.9 | +3.9 | |
Independent | Justin Armstrong | 824 | 2.8 | +2.8 | |
Natural Law | Richard Barnes | 427 | 1.5 | +1.5 | |
Total formal votes | 29,184 | 93.7 | +0.3 | ||
Informal votes | 1,958 | 6.3 | −0.3 | ||
Turnout | 31,142 | 94.0 | |||
Two-party-preferred result | |||||
Labor | Michael Leighton | 19,278 | 66.2 | −2.4 | |
Liberal | George Prillwitz | 9,854 | 33.8 | +2.4 | |
Labor hold | Swing | -2.4 | |||
Party | Candidate | Votes | % | ±% | |
---|---|---|---|---|---|
Labor | Demetri Dollis | 15,945 | 53.3 | −7.8 | |
Liberal | Peter Graham | 8,554 | 28.6 | +5.5 | |
Independent | Geoff Millman | 1,322 | 4.4 | +4.4 | |
Democrats | Gordon McQuilten | 1,193 | 4.0 | +4.0 | |
Independent | Sunny Seau | 691 | 2.3 | +2.3 | |
Natural Law | Larry Clarke | 464 | 1.6 | +1.6 | |
Independent | Barry Gration | 452 | 1.5 | +1.5 | |
Independent | Jason Maher | 409 | 1.4 | +1.4 | |
Independent | Bill Hampson | 396 | 1.3 | −3.7 | |
Independent | Steve Florin | 373 | 1.2 | −2.8 | |
Independent | Ray Fulcher | 127 | 0.4 | +0.4 | |
Total formal votes | 29,926 | 93.1 | +0.6 | ||
Informal votes | 2,224 | 6.9 | −0.6 | ||
Turnout | 32,150 | 91.5 | |||
Two-party-preferred result | |||||
Labor | Demetri Dollis | 18,858 | 63.3 | −4.1 | |
Liberal | Peter Graham | 10,939 | 36.7 | +4.1 | |
Labor hold | Swing | -4.1 | |||
Party | Candidate | Votes | % | ±% | |
---|---|---|---|---|---|
Liberal | Steve Elder | 16,028 | 53.7 | −0.3 | |
Labor | Hilary Hunt | 10,922 | 36.6 | −6.7 | |
Independent | Gwenda Allgood | 2,902 | 9.7 | +9.7 | |
Total formal votes | 29,852 | 97.8 | +0.0 | ||
Informal votes | 664 | 2.2 | −0.0 | ||
Turnout | 30,516 | 96.5 | |||
Two-party-preferred result | |||||
Liberal | Steve Elder | 17,057 | 57.1 | +1.1 | |
Labor | Hilary Hunt | 12,795 | 42.9 | −1.1 | |
Liberal hold | Swing | +1.1 | |||
Party | Candidate | Votes | % | ±% | |
---|---|---|---|---|---|
National | Noel Maughan | 21,404 | 72.0 | +5.8 | |
Labor | Jason Price | 6,137 | 20.6 | +0.4 | |
Independent | Dennis Lacey | 2,202 | 7.4 | +7.4 | |
Total formal votes | 29,743 | 97.7 | −0.7 | ||
Informal votes | 710 | 2.3 | +0.7 | ||
Turnout | 30,453 | 96.4 | |||
Two-party-preferred result | |||||
National | Noel Maughan | 22,612 | 76.0 | −2.3 | |
Labor | Jason Price | 7,128 | 24.0 | +2.3 | |
National hold | Swing | -2.3 | |||
Party | Candidate | Votes | % | ±% | |
---|---|---|---|---|---|
Liberal | Murray Thompson | 20,069 | 65.6 | +11.8 | |
Labor | Roland Lindell | 7,715 | 25.2 | −17.8 | |
Natural Law | Brian Gale | 2,804 | 9.2 | +9.2 | |
Total formal votes | 30,588 | 97.1 | −0.4 | ||
Informal votes | 907 | 2.9 | +0.4 | ||
Turnout | 31,495 | 94.8 | |||
Two-party-preferred result | |||||
Liberal | Murray Thompson | 21,342 | 69.9 | +14.3 | |
Labor | Roland Lindell | 9,207 | 30.1 | −14.3 | |
Liberal hold | Swing | +14.3 | |||
Party | Candidate | Votes | % | ±% | |
---|---|---|---|---|---|
Liberal | Marie Tehan | 13,869 | 47.3 | +4.4 | |
Labor | Ian Rogers | 9,723 | 33.1 | −12.8 | |
National | Rod Henderson | 3,332 | 11.4 | +2.4 | |
Pensioner and CIR | Jim McKinnon | 1,213 | 4.1 | +4.1 | |
Independent | Maurie Smith | 1,207 | 4.1 | +4.1 | |
Total formal votes | 29,344 | 96.9 | −0.3 | ||
Informal votes | 944 | 3.1 | +0.3 | ||
Turnout | 30,288 | 95.6 | |||
Two-party-preferred result | |||||
Liberal | Marie Tehan | 17,821 | 61.0 | +8.1 | |
Labor | Ian Rogers | 11,415 | 39.0 | −8.1 | |
Liberal hold | Swing | +8.1 | |||
Party | Candidate | Votes | % | ±% | |
---|---|---|---|---|---|
National | Don Kilgour | 20,385 | 69.5 | +14.8 | |
Labor | John Sheen | 8,962 | 30.5 | +3.9 | |
Total formal votes | 29,347 | 96.8 | −0.8 | ||
Informal votes | 974 | 3.2 | +0.8 | ||
Turnout | 30,321 | 95.8 | |||
National hold | Swing | -2.0 | |||
Party | Candidate | Votes | % | ±% | |
---|---|---|---|---|---|
Liberal | Alister Paterson | 13,970 | 48.4 | −2.9 | |
Labor | Frances Patrick | 8,392 | 29.1 | −13.2 | |
Independent | Harley Dickinson | 3,589 | 12.4 | +12.4 | |
Geelong Community | Karan Dawson | 2,035 | 7.0 | +7.0 | |
Call to Australia | Gary Lyons | 886 | 3.1 | −3.3 | |
Total formal votes | 28,872 | 97.4 | −0.1 | ||
Informal votes | 758 | 2.6 | +0.1 | ||
Turnout | 29,630 | 95.9 | |||
Two-party-preferred result | |||||
Liberal | Alister Paterson | 17,521 | 60.8 | +6.7 | |
Labor | Frances Patrick | 11,280 | 39.2 | −6.7 | |
Liberal gain from Independent | Swing | N/A | |||
Party | Candidate | Votes | % | ±% | |
---|---|---|---|---|---|
Labor | Eddie Micallef | 15,569 | 51.7 | −7.6 | |
Liberal | Mario Dodic | 11,902 | 39.5 | +2.5 | |
Independent | Lorna Stevenson | 2,656 | 8.8 | +8.8 | |
Total formal votes | 30,127 | 94.2 | +1.3 | ||
Informal votes | 1,842 | 5.8 | −1.3 | ||
Turnout | 31,969 | 95.2 | |||
Two-party-preferred result | |||||
Labor | Eddie Micallef | 17,420 | 58.0 | −3.0 | |
Liberal | Mario Dodic | 12,603 | 42.0 | +3.0 | |
Labor hold | Swing | -3.0 | |||
Party | Candidate | Votes | % | ±% | |
---|---|---|---|---|---|
Labor | Ian Baker | 17,918 | 58.7 | −2.3 | |
Liberal | Bernard Reilly | 8,795 | 28.8 | +0.9 | |
Independent | Marion Martin | 1,628 | 5.3 | +5.3 | |
Independent | Charles Skidmore | 1,507 | 4.9 | +4.9 | |
Independent | Z. A. Derwinski | 684 | 2.2 | +2.2 | |
Total formal votes | 30,532 | 92.2 | +1.7 | ||
Informal votes | 2,583 | 7.8 | −1.7 | ||
Turnout | 33,115 | 94.4 | |||
Two-party-preferred result | |||||
Labor | Ian Baker | 19,296 | 63.3 | −1.7 | |
Liberal | Bernard Reilly | 11,172 | 36.7 | +1.7 | |
Labor hold | Swing | -1.7 | |||
Party | Candidate | Votes | % | ±% | |
---|---|---|---|---|---|
National | Barry Steggall | 22,361 | 75.4 | +16.3 | |
Labor | Vera Alcock | 4,981 | 16.8 | −3.4 | |
Independent | Geoff Burnside | 2,306 | 7.8 | +7.8 | |
Total formal votes | 29,648 | 97.6 | −0.6 | ||
Informal votes | 731 | 2.4 | +0.6 | ||
Turnout | 30,379 | 96.3 | |||
Two-party-preferred result | |||||
National | Barry Steggall | 23,551 | 79.4 | +1.9 | |
Labor | Vera Alcock | 6,092 | 20.6 | −1.9 | |
National hold | Swing | +1.9 | |||
Party | Candidate | Votes | % | ±% | |
---|---|---|---|---|---|
Labor | Peter Batchelor | 16,592 | 57.4 | −8.3 | |
Liberal | Riza Kozanoglu | 6,929 | 24.0 | −1.6 | |
Independent | Jim Thomev | 3,097 | 10.7 | +10.7 | |
Independent | Christos Karamoshos | 1,014 | 3.5 | +3.5 | |
Independent | Marianna Cuni | 849 | 2.9 | +2.9 | |
Independent | Ken Mantell | 428 | 1.5 | +1.5 | |
Total formal votes | 28,909 | 91.9 | +0.8 | ||
Informal votes | 2,541 | 8.1 | −0.8 | ||
Turnout | 31,450 | 95.0 | |||
Two-party-preferred result | |||||
Labor | Peter Batchelor | 20,172 | 70.0 | +0.9 | |
Liberal | Riza Kozanoglu | 8,648 | 30.0 | −0.9 | |
Labor hold | Swing | +0.9 | |||
Party | Candidate | Votes | % | ±% | |
---|---|---|---|---|---|
Liberal | Bernie Finn | 13,032 | 44.2 | +2.3 | |
Labor | Peter Gavin | 11,823 | 40.1 | −11.9 | |
Independent | Jack Ogilvie | 1,511 | 5.1 | +5.1 | |
Independent | Veronica Burgess | 1,235 | 4.2 | +4.2 | |
Independent | Cheryl Hildebrandt | 1,207 | 4.1 | +4.1 | |
Independent | Andy Govanstone | 703 | 2.4 | +2.4 | |
Total formal votes | 29,511 | 95.5 | −0.3 | ||
Informal votes | 1,385 | 4.5 | +0.3 | ||
Turnout | 30,896 | 96.0 | |||
Two-party-preferred result | |||||
Liberal | Bernie Finn | 15,158 | 51.5 | +6.4 | |
Labor | Peter Gavin | 14,264 | 48.5 | −6.4 | |
Liberal gain from Labor | Swing | +6.4 | |||
Party | Candidate | Votes | % | ±% | |
---|---|---|---|---|---|
Liberal | Kim Wells | 17,683 | 59.4 | +11.4 | |
Labor | Peter Lockwood | 9,313 | 31.3 | −17.8 | |
Independent | John Le Fevre | 2,789 | 9.4 | +9.4 | |
Total formal votes | 29,784 | 96.5 | 0.0 | ||
Informal votes | 1,076 | 3.5 | 0.0 | ||
Turnout | 30,860 | 96.0 | |||
Two-party-preferred result | |||||
Liberal | Kim Wells | 19,046 | 64.1 | +14.2 | |
Labor | Peter Lockwood | 10,653 | 35.9 | −14.2 | |
Liberal gain from Labor | Swing | +14.2 | |||
Party | Candidate | Votes | % | ±% | |
---|---|---|---|---|---|
Liberal | Phil Honeywood | 18,108 | 63.3 | +15.5 | |
Labor | Philip Moran | 7,664 | 26.8 | −16.2 | |
Independent | Neil Macdonald | 2,828 | 9.9 | +9.9 | |
Total formal votes | 28,600 | 97.7 | +0.3 | ||
Informal votes | 677 | 2.3 | −0.3 | ||
Turnout | 29,277 | 95.8 | |||
Two-party-preferred result | |||||
Liberal | Phil Honeywood | 19,041 | 66.7 | +14.7 | |
Labor | Philip Moran | 9,491 | 33.3 | −14.7 | |
Liberal hold | Swing | +14.7 | |||
Party | Candidate | Votes | % | ±% | |
---|---|---|---|---|---|
National | John McGrath | 23,400 | 75.8 | +25.8 | |
Labor | William Thompson | 7,454 | 24.2 | +2.5 | |
Total formal votes | 30,854 | 97.9 | −0.6 | ||
Informal votes | 649 | 2.1 | +0.6 | ||
Turnout | 31,503 | 97.1 | |||
National hold | Swing | -1.4 | |||
Party | Candidate | Votes | % | ±% | |
---|---|---|---|---|---|
Labor | Ken Coghill | 14,857 | 48.6 | −6.8 | |
Liberal | Anne Canterbury | 10,632 | 34.8 | +3.3 | |
Independent | Shane Bourke | 5,102 | 16.7 | +16.7 | |
Total formal votes | 30,591 | 97.1 | +0.5 | ||
Informal votes | 927 | 2.9 | −0.5 | ||
Turnout | 31,518 | 96.5 | |||
Two-party-preferred result | |||||
Labor | Ken Coghill | 17,797 | 58.3 | −1.7 | |
Liberal | Anne Canterbury | 12,729 | 41.7 | +1.7 | |
Labor hold | Swing | -1.7 | |||
Party | Candidate | Votes | % | ±% | |
---|---|---|---|---|---|
Labor | Joan Kirner | 17,167 | 58.7 | −7.5 | |
Liberal | Jeff Bird | 8,543 | 29.2 | +2.2 | |
Independent | Vern Hughes | 1,299 | 4.4 | +4.4 | |
Independent | Paul Holmes | 1,218 | 4.2 | +4.2 | |
Independent | Daniel Cumming | 1,038 | 3.5 | +3.5 | |
Total formal votes | 29,265 | 94.3 | +1.0 | ||
Informal votes | 1,755 | 5.7 | −1.0 | ||
Turnout | 31,020 | 94.6 | |||
Two-party-preferred result | |||||
Labor | Joan Kirner | 18,734 | 64.2 | −7.0 | |
Liberal | Jeff Bird | 10,465 | 35.8 | +7.0 | |
Labor hold | Swing | -7.0 | |||
Party | Candidate | Votes | % | ±% | |
---|---|---|---|---|---|
National | Bill McGrath | 25,325 | 79.6 | +30.0 | |
Labor | Felix Blatt | 6,485 | 20.4 | −0.9 | |
Total formal votes | 31,810 | 97.6 | −0.7 | ||
Informal votes | 794 | 2.4 | +0.7 | ||
Turnout | 32,604 | 97.3 | |||
National hold | Swing | +2.0 | |||
Party | Candidate | Votes | % | ±% | |
---|---|---|---|---|---|
Liberal | Bill Willis | 12,567 | 44.1 | +1.6 | |
Labor | Andre Haermeyer | 12,113 | 42.5 | −14.9 | |
Natural Law | Julie Nihill | 1,515 | 5.3 | +5.3 | |
Independent | Nazio Mancini | 1,411 | 5.0 | +5.0 | |
Independent | Eleonora Cichello | 430 | 1.5 | +1.5 | |
Independent | Trevor Goodwin | 257 | 0.9 | +0.9 | |
Independent | Peter Brambilla | 210 | 0.7 | +0.7 | |
Total formal votes | 28,503 | 95.4 | −0.6 | ||
Informal votes | 1,359 | 4.6 | +0.6 | ||
Turnout | 29,862 | 96.5 | |||
Two-party-preferred result | |||||
Labor | Andre Haermeyer | 14,754 | 51.9 | −5.5 | |
Liberal | Bill Willis | 13,665 | 48.1 | +5.5 | |
Labor hold | Swing | -5.5 | |||
Cranbourne is an electoral district of the Victorian Legislative Assembly. It is located south-east of Melbourne and includes the suburbs of Botanic Ridge, Cranbourne, Cranbourne East, Cranbourne North, Cranbourne West, Junction Village, as well as parts of Clyde, Clyde North, Cranbourne South, Devon Meadows, Lynbrook and Lyndhurst. It was created prior to the 1992 state election.
The 1996 Victorian state election, held on Saturday, 30 March 1996, was for the 53rd Parliament of Victoria. It was held in the Australian state of Victoria to elect all 88 members of the state's Legislative Assembly and 22 members of the 44-member Legislative Council. The election took place four weeks after the 1996 federal election which swept the Labor Party from power nationally.
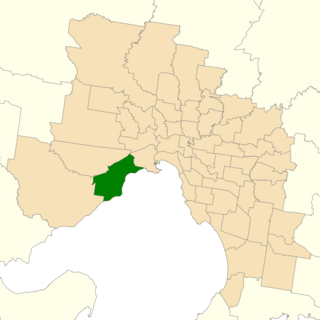
The electoral district of Altona was one of the electoral districts of Victoria, Australia, for the Victorian Legislative Assembly. It covered an area of 79 square kilometres (31 sq mi) in western Melbourne, and included the suburbs of Altona, Altona Meadows, Laverton, Point Cook, Seabrook and Seaholme. It also included the RAAF Williams airbase and the Point Cook Coastal Park. It lay within the Western Metropolitan Region of the upper house, the Legislative Council.
The electoral district of Bayswater is one of the electoral districts of Victoria, Australia, for the Victorian Legislative Assembly. It covers an area of 39 square kilometres (15 sq mi) in outer eastern Melbourne, and includes the suburbs of Bayswater, Heathmont, Kilsyth South and The Basin, and parts of Bayswater North, Boronia, Ringwood and Wantirna. It lies within the Eastern Metropolitan Region of the upper house, the Legislative Council.
The 1992 Victoria state election, held on Saturday, October 3. was for the 52nd Parliament of Victoria. It was held in the Australian state of Victoria to elect all 88 members of the state's Legislative Assembly and 22 members of the 44-member Legislative Council.
The electoral district of Essendon is an electoral district of the Victorian Legislative Assembly. It was first created in 1904 after the abolition of the larger Essendon and Flemington electorate, and covers some of the north-western suburbs of Melbourne, including Essendon, Moonee Ponds and Ascot Vale.
The electoral district of Eltham is an electoral district of the Victorian Legislative Assembly. It is an outer metropolitan electorate and contains Eltham, Lower Plenty as well as parts of Greensborough and Kangaroo Ground.
The electoral district of Yan Yean is an electoral district of the Victorian Legislative Assembly. It is located on the fringes of Melbourne's northern suburbs and contains the towns of Hurstbridge, Plenty, Whittlesea and Yan Yean.
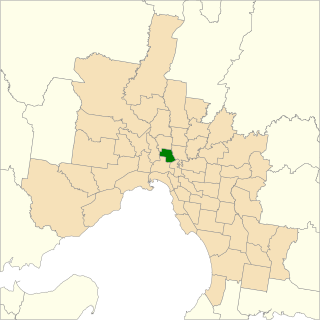
The electoral district of Brunswick is an electorate of the Victorian Legislative Assembly. It covers an area of 14 square kilometres (5.4 sq mi) in inner northern Melbourne, and includes the suburbs of Brunswick, Brunswick East, Carlton North, Fitzroy North, Princes Hill and parts of Brunswick West. It lies within the Northern Metropolitan Region of the upper house, the Legislative Council.
The electoral district of Ivanhoe is an electoral district of the Victorian Legislative Assembly. It is located in the north-eastern suburbs of Melbourne and includes the suburbs of Heidelberg, Heidelberg Heights, Heidelberg West, Bellfield, Ivanhoe, Ivanhoe East, Eaglemont, Rosanna, Viewbank, Yallambie and Macleod.
The electoral district of Broadmeadows is an electorate of the Victorian Legislative Assembly. It covers an area of 47 square kilometres (18 sq mi) in outer northern Melbourne, and includes the suburbs of Broadmeadows, Campbellfield, Coolaroo, Dallas, Fawkner, Jacana and Meadow Heights. It also includes parts of Glenroy, Roxburgh Park, Somerton, and Westmeadows. It lies within the Northern Metropolitan Region of the upper house, the Legislative Council.
This is a list of members of the Victorian Legislative Council between 1992 and 1996. As half of the Legislative Council's terms expired at each periodic election, half of these members were elected at the 1988 state election with terms expiring in 1996, while the other half were elected at the 1992 state election with terms intended to expire in 2000, but which lapsed at the 1999 state election.
This is a list of members of the Victorian Legislative Council between 1985 and 1988. As half of the Legislative Council's terms expired at each periodic election, half of these members were elected at the 1982 state election with terms expiring in 1988, while the other half were elected at the 1985 state election with terms expiring in 1992.
Bendigo West is an electoral district of the Legislative Assembly in the Australian state of Victoria. It is a 1,524 square kilometres (588 sq mi) electorate centred on the city of Bendigo west of the Yungera railway line, and including surrounding rural towns to the west and south-west. It encompasses the localities of Bendigo City, California Gully, Castlemaine, Harcourt, Long Gully, Maldon, Marong, Newstead and West Bendigo. It also includes parts of the Bendigo suburbs of Eaglehawk, Golden Square and Kangaroo Flat. It lies within the Northern Victoria Region of the upper house, the Legislative Council.
The electoral district of St Albans is an electoral district of the Victorian Legislative Assembly. It has existed in 2 incarnations, first from 1985 to 1992, and was created again in the 2013 redistribution and came into effect at the 2014 state election.
This is a list of electoral results for the Electoral district of Altona in Victorian state elections from 1992 to the present.
This is a list of electoral results for the electoral district of Bennettswood in Victorian state elections.
This is a list of electoral results for the Electoral district of Sunshine in Victorian state elections.
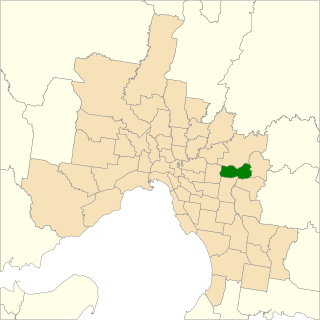
The electoral district of Ringwood is an electoral district of the Victorian Legislative Assembly, located in the east of Melbourne. It was first proclaimed in 1958 and was abolished in 1992. Some of Ringwood was included in the new electoral district of Bayswater that year. Kay Setches, who was at the time the last member for Ringwood, contested and lost Bayswater at the 1992 election.
The Victorian Labor Party, officially known as the Australian Labor Party and commonly referred to simply as Victorian Labor, is the Victorian state branch of the Australian Labor Party (ALP). Victorian Labor forms the incumbent government in the state of Victoria and is led by Jacinta Allan, who has served concurrently as Premier of Victoria since 2023.