This is a list of electoral district results for the Victorian 1988 election for the Legislative Assembly.
Party | Candidate | Votes | % | ±% | |
---|---|---|---|---|---|
Labor | Bunna Walsh | 11,939 | 51.15 | −11.04 | |
Liberal | Andrew Lindsay | 7,542 | 32.31 | −5.50 | |
Independent | Anne Fahey | 2,785 | 11.93 | +11.93 | |
Independent | Kathleen Brown | 1,076 | 4.61 | +4.61 | |
Total formal votes | 23,342 | 95.66 | −1.07 | ||
Informal votes | 1,060 | 4.34 | +1.07 | ||
Turnout | 24,402 | 85.47 | −2.69 | ||
Two-party-preferred result | |||||
Labor | Bunna Walsh | 13,733 | 58.88 | −3.31 | |
Liberal | Andrew Lindsay | 9,589 | 41.12 | +3.31 | |
Labor hold | Swing | -3.31 | |||
Party | Candidate | Votes | % | ±% | |
---|---|---|---|---|---|
Liberal | Steve Elder | 14,183 | 47.50 | −9.63 | |
Labor | Steve Bracks | 13,123 | 43.95 | +1.08 | |
National | Geoffrey Mark | 1,903 | 6.37 | +6.37 | |
Independent | John Blanchard | 653 | 2.19 | +2.19 | |
Total formal votes | 29,862 | 98.21 | −0.03 | ||
Informal votes | 544 | 1.79 | +0.03 | ||
Turnout | 30,406 | 94.45 | 0.00 | ||
Two-party-preferred result | |||||
Liberal | Steve Elder | 15,921 | 53.55 | −3.58 | |
Labor | Steve Bracks | 13,810 | 46.45 | +3.58 | |
Liberal hold | Swing | -3.58 | |||
Party | Candidate | Votes | % | ±% | |
---|---|---|---|---|---|
Labor | Frank Sheehan | 14,320 | 46.47 | −4.90 | |
Liberal | Joan Chambers | 13,385 | 43.44 | −5.19 | |
National | Donald Phelan | 1,993 | 6.47 | +6.47 | |
Democrats | Phil Henseleit | 1,116 | 3.62 | +3.62 | |
Total formal votes | 30,814 | 97.55 | −0.67 | ||
Informal votes | 775 | 2.45 | +0.67 | ||
Turnout | 31,589 | 94.32 | −0.40 | ||
Two-party-preferred result | |||||
Labor | Frank Sheehan | 15,457 | 50.17 | −1.20 | |
Liberal | Joan Chambers | 15,353 | 49.83 | +1.20 | |
Labor hold | Swing | -1.20 | |||
Party | Candidate | Votes | % | ±% | |
---|---|---|---|---|---|
Liberal | Robert Clark | 16,816 | 64.28 | −1.15 | |
Labor | George Theodoridis | 9,344 | 35.72 | +1.15 | |
Total formal votes | 26,160 | 97.41 | −0.65 | ||
Informal votes | 696 | 2.59 | +0.65 | ||
Turnout | 26,856 | 90.98 | −1.51 | ||
Liberal hold | Swing | -1.15 | |||
Party | Candidate | Votes | % | ±% | |
---|---|---|---|---|---|
Labor | Graham Ernst | 13,865 | 46.07 | −6.88 | |
Liberal | Margaret Byrne | 12,360 | 41.07 | −5.98 | |
National | John Foster | 2,400 | 7.98 | +7.98 | |
Democrats | Laurie Levy | 1,469 | 4.88 | +4.88 | |
Total formal votes | 30,094 | 97.53 | −0.62 | ||
Informal votes | 763 | 2.47 | +0.62 | ||
Turnout | 30,857 | 93.51 | −1.16 | ||
Two-party-preferred result | |||||
Labor | Graham Ernst | 15,264 | 50.73 | −2.22 | |
Liberal | Margaret Byrne | 14,822 | 49.27 | +2.22 | |
Labor hold | Swing | -2.22 | |||
Party | Candidate | Votes | % | ±% | |
---|---|---|---|---|---|
National | Pat McNamara | 12,004 | 42.54 | −4.88 | |
Labor | Barbara Stepan | 8,394 | 29.75 | −2.71 | |
Liberal | Margaret Stribling | 6,333 | 22.44 | +2.32 | |
Independent | Grant Triffett | 909 | 3.22 | +3.22 | |
Call to Australia | Win Wise | 576 | 2.04 | +2.04 | |
Total formal votes | 28,216 | 97.76 | −0.59 | ||
Informal votes | 646 | 2.24 | +0.59 | ||
Turnout | 28,862 | 92.36 | −0.25 | ||
Two-party-preferred result | |||||
National | Pat McNamara | 19,173 | 67.95 | +1.86 | |
Labor | Barbara Stepan | 9,043 | 32.05 | −1.86 | |
National hold | Swing | +1.86 | |||
Party | Candidate | Votes | % | ±% | |
---|---|---|---|---|---|
Liberal | Lou Lieberman | 16,424 | 56.54 | −13.02 | |
Labor | Julie Nelson | 7,670 | 26.40 | −4.04 | |
National | Judith Brewer | 4,955 | 17.06 | +17.06 | |
Total formal votes | 29,049 | 97.66 | −0.38 | ||
Informal votes | 696 | 2.34 | +0.38 | ||
Turnout | 29,745 | 90.87 | −0.38 | ||
Two-party-preferred result | |||||
Liberal | Lou Lieberman | 20,788 | 71.59 | +2.03 | |
Labor | Julie Nelson | 8,250 | 28.41 | −2.03 | |
Liberal hold | Swing | +2.03 | |||
Party | Candidate | Votes | % | ±% | |
---|---|---|---|---|---|
Labor | Bob Cameron | 12,179 | 41.09 | −3.15 | |
Liberal | Michael John | 12,010 | 40.52 | +1.82 | |
National | Leon Waddington | 3,908 | 13.19 | −3.87 | |
Call to Australia | Vic Upson | 1,541 | 5.20 | +5.20 | |
Total formal votes | 29,638 | 97.97 | −0.45 | ||
Informal votes | 614 | 2.03 | +0.45 | ||
Turnout | 30,252 | 93.75 | −1.47 | ||
Two-party-preferred result | |||||
Liberal | Michael John | 16,505 | 55.70 | +1.81 | |
Labor | Bob Cameron | 13,127 | 44.30 | −1.81 | |
Liberal hold | Swing | +1.81 | |||
Party | Candidate | Votes | % | ±% | |
---|---|---|---|---|---|
Labor | David Kennedy | 13,881 | 44.97 | −8.75 | |
Liberal | William Maltby | 9,534 | 30.89 | −1.20 | |
National | Peter McNaught | 4,549 | 14.74 | +0.55 | |
Democrats | Peter Shaw-Truex | 1,138 | 3.69 | +3.69 | |
Independent | Harold Hall | 891 | 2.89 | +2.89 | |
Call to Australia | Graeme Furlong | 876 | 2.84 | +2.84 | |
Total formal votes | 30,869 | 97.39 | −0.86 | ||
Informal votes | 828 | 2.61 | +0.86 | ||
Turnout | 31,697 | 94.15 | −0.80 | ||
Two-party-preferred result | |||||
Labor | David Kennedy | 15,697 | 50.88 | −8.76 | |
Liberal | William Maltby | 15,155 | 49.12 | +8.76 | |
Labor hold | Swing | -8.76 | |||
Party | Candidate | Votes | % | ±% | |
---|---|---|---|---|---|
Liberal | Roger Pescott | 14,159 | 50.25 | +1.01 | |
Labor | Nigel De Kretser | 12,089 | 42.91 | −5.38 | |
Democrats | Geoff Carr | 1,927 | 6.84 | +6.84 | |
Total formal votes | 28,175 | 96.80 | −0.88 | ||
Informal votes | 931 | 3.20 | +0.88 | ||
Turnout | 29,106 | 93.88 | −0.50 | ||
Two-party-preferred result | |||||
Liberal | Roger Pescott | 14,710 | 52.22 | +1.42 | |
Labor | Nigel De Kretser | 13,461 | 47.78 | −1.42 | |
Liberal hold | Swing | +1.42 | |||
Party | Candidate | Votes | % | ±% | |
---|---|---|---|---|---|
Labor | Ann Barker | 11,444 | 44.60 | −5.51 | |
Liberal | Peter Norman | 11,130 | 43.41 | −6.48 | |
Democrats | Anne Martin | 902 | 3.52 | +3.52 | |
Weekend Trading Party | Frank Penhalluriack | 830 | 3.23 | +3.23 | |
Independent | Alan Salter | 536 | 2.09 | +2.09 | |
Call to Australia | Phillip McGibbony | 480 | 1.87 | +1.87 | |
Independent | Janette de San Sinforiano | 329 | 1.28 | +1.28 | |
Total formal votes | 25,660 | 95.88 | −1.59 | ||
Informal votes | 1,103 | 4.12 | +1.59 | ||
Turnout | 26,763 | 93.57 | −0.70 | ||
Two-party-preferred result | |||||
Labor | Ann Barker | 13,175 | 51.36 | +1.25 | |
Liberal | Peter Norman | 12,475 | 48.64 | −1.25 | |
Labor hold | Swing | +1.25 | |||
Party | Candidate | Votes | % | ±% | |
---|---|---|---|---|---|
Liberal | Rob Maclellan | 16,777 | 49.49 | −3.61 | |
Labor | Philip Huggins | 14,593 | 43.05 | −3.85 | |
Democrats | Jyan Mayfield | 2,530 | 7.46 | +7.46 | |
Total formal votes | 33,900 | 97.37 | −0.29 | ||
Informal votes | 915 | 2.63 | +0.29 | ||
Turnout | 34,815 | 93.21 | −0.78 | ||
Two-party-preferred result | |||||
Liberal | Rob Maclellan | 17,425 | 51.40 | −1.70 | |
Labor | Philip Huggins | 16,475 | 48.60 | +1.70 | |
Liberal hold | Swing | -1.70 | |||
Party | Candidate | Votes | % | ±% | |
---|---|---|---|---|---|
Labor | Margaret Ray | 12,460 | 47.46 | −3.32 | |
Liberal | Helen Shardey | 11,142 | 42.44 | −2.26 | |
Democrats | George Demetriou | 1,128 | 4.30 | +4.30 | |
Call to Australia | William Watson | 974 | 3.71 | +3.71 | |
Independent | Peter Allan | 551 | 2.10 | −2.42 | |
Total formal votes | 26,255 | 97.00 | −1.08 | ||
Informal votes | 812 | 3.00 | +1.08 | ||
Turnout | 27,067 | 92.90 | −0.43 | ||
Two-party-preferred result | |||||
Labor | Margaret Ray | 13,669 | 52.09 | +0.24 | |
Liberal | Helen Shardey | 12,574 | 47.91 | −0.24 | |
Labor hold | Swing | +0.24 | |||
Party | Candidate | Votes | % | ±% | |
---|---|---|---|---|---|
Liberal | Alan Stockdale | 16,651 | 61.88 | −0.22 | |
Labor | Jennifer Huppert | 9,642 | 35.83 | −2.07 | |
Independent | John Casley | 617 | 2.29 | +2.29 | |
Total formal votes | 26,910 | 97.14 | −0.28 | ||
Informal votes | 792 | 2.86 | +0.28 | ||
Turnout | 27,702 | 92.08 | +0.14 | ||
Two-party-preferred result | |||||
Liberal | Alan Stockdale | 16,968 | 63.05 | +0.95 | |
Labor | Jennifer Huppert | 9,942 | 36.95 | −0.95 | |
Liberal hold | Swing | +0.95 | |||
Party | Candidate | Votes | % | ±% | |
---|---|---|---|---|---|
Labor | Jim Kennan | 12,489 | 55.17 | −14.86 | |
Independent | Jack Culpin | 5,256 | 23.22 | +23.22 | |
Liberal | Carol Lutz | 4,892 | 21.61 | +21.61 | |
Total formal votes | 22,637 | 93.50 | −1.62 | ||
Informal votes | 1,573 | 6.50 | +1.62 | ||
Turnout | 24,210 | 91.44 | −1.79 | ||
Two-party-preferred result | |||||
Labor | Jim Kennan | 13,541 | 59.85 | −10.18 | |
Liberal | Carol Lutz | 9,085 | 40.15 | +10.18 | |
Labor hold | Swing | -10.18 | |||
Party | Candidate | Votes | % | ±% | |
---|---|---|---|---|---|
Labor | Tom Roper | 15,521 | 63.95 | −6.93 | |
Liberal | Louise Joyce | 6,885 | 28.37 | −1.05 | |
Democratic Labor | Michael Rowe | 1,863 | 7.68 | +7.68 | |
Total formal votes | 24,269 | 92.88 | −2.05 | ||
Informal votes | 1,861 | 7.12 | +2.05 | ||
Turnout | 26,130 | 87.58 | −2.24 | ||
Two-party-preferred result | |||||
Labor | Tom Roper | 16,172 | 66.67 | −3.91 | |
Liberal | Louise Joyce | 8,083 | 33.33 | +3.91 | |
Labor hold | Swing | -3.91 | |||
Party | Candidate | Votes | % | ±% | |
---|---|---|---|---|---|
Liberal | David Perrin | 16,588 | 59.22 | +1.43 | |
Labor | David Redfearn | 11,424 | 40.78 | −1.43 | |
Total formal votes | 28,012 | 95.54 | −1.77 | ||
Informal votes | 1,308 | 4.46 | +1.77 | ||
Turnout | 29,320 | 92.86 | −1.23 | ||
Liberal hold | Swing | +1.43 | |||
Party | Candidate | Votes | % | ±% | |
---|---|---|---|---|---|
Labor | John Cain | 16,255 | 60.21 | −0.35 | |
Liberal | John Goodfellow | 10,741 | 39.79 | +7.18 | |
Total formal votes | 26,996 | 96.08 | −1.92 | ||
Informal votes | 1,100 | 3.92 | +1.92 | ||
Turnout | 28,096 | 93.13 | −1.35 | ||
Labor hold | Swing | -2.69 | |||
Party | Candidate | Votes | % | ±% | |
---|---|---|---|---|---|
Liberal | Jeff Kennett | 13,759 | 52.90 | −2.68 | |
Labor | Eric Hobsbawn | 10,938 | 42.06 | −2.36 | |
Call to Australia | Barbara McCrohan | 1,310 | 5.04 | +5.04 | |
Total formal votes | 26,007 | 97.58 | −0.18 | ||
Informal votes | 644 | 2.42 | +0.18 | ||
Turnout | 26,651 | 92.32 | −0.81 | ||
Two-party-preferred result | |||||
Liberal | Jeff Kennett | 14,458 | 55.59 | +0.01 | |
Labor | Eric Hobsbawn | 11,549 | 44.41 | −0.01 | |
Liberal hold | Swing | +0.01 | |||
Party | Candidate | Votes | % | ±% | |
---|---|---|---|---|---|
Labor | Mal Sandon | 15,308 | 57.49 | −1.94 | |
Liberal | Marie McIntosh | 11,320 | 42.51 | +1.94 | |
Total formal votes | 26,628 | 95.94 | −1.29 | ||
Informal votes | 1,127 | 4.06 | +1.29 | ||
Turnout | 27,755 | 91.64 | −1.47 | ||
Labor hold | Swing | -1.94 | |||
Party | Candidate | Votes | % | ±% | |
---|---|---|---|---|---|
Liberal | Ted Tanner | 13,531 | 55.10 | −2.19 | |
Labor | David Jackson | 11,026 | 44.90 | +2.19 | |
Total formal votes | 24,557 | 95.21 | −1.64 | ||
Informal votes | 1,235 | 4.79 | +1.64 | ||
Turnout | 25,792 | 89.30 | −1.29 | ||
Liberal hold | Swing | -2.19 | |||
Party | Candidate | Votes | % | ±% | |
---|---|---|---|---|---|
Labor | Gerard Vaughan | 14,794 | 56.56 | −3.27 | |
Liberal | Lauris White | 9,401 | 35.94 | −4.23 | |
Call to Australia | Daryl Esmore | 1,482 | 5.67 | +5.67 | |
Independent | Stephen Bingle | 477 | 1.82 | +1.82 | |
Total formal votes | 26,154 | 94.36 | −1.82 | ||
Informal votes | 1,564 | 5.64 | +1.82 | ||
Turnout | 27,718 | 92.23 | −1.73 | ||
Two-party-preferred result | |||||
Labor | Gerard Vaughan | 15,412 | 58.94 | −0.89 | |
Liberal | Lauris White | 10,737 | 41.06 | +0.89 | |
Labor hold | Swing | -0.89 | |||
Party | Candidate | Votes | % | ±% | |
---|---|---|---|---|---|
Labor | Peter Gavin | 15,353 | 61.27 | −9.17 | |
Liberal | Erdem Aydin | 5,911 | 23.59 | −5.97 | |
Independent | Norma Willoughby | 3,793 | 15.14 | +15.14 | |
Total formal votes | 25,057 | 93.70 | −2.35 | ||
Informal votes | 1,685 | 6.30 | +2.35 | ||
Turnout | 26,742 | 91.16 | −1.48 | ||
Two-party-preferred result | |||||
Labor | Peter Gavin | 16,364 | 65.31 | −5.13 | |
Liberal | Erdem Aydin | 8,691 | 34.69 | +5.13 | |
Labor hold | Swing | -5.13 | |||
Party | Candidate | Votes | % | ±% | |
---|---|---|---|---|---|
Labor | Terry Norris | 14,996 | 62.57 | +1.50 | |
Liberal | Poh Loh | 8,971 | 37.43 | −1.50 | |
Total formal votes | 23,967 | 93.12 | −3.03 | ||
Informal votes | 1,772 | 6.88 | +3.03 | ||
Turnout | 25,739 | 89.46 | −2.52 | ||
Labor hold | Swing | +1.50 | |||
Party | Candidate | Votes | % | ±% | |
---|---|---|---|---|---|
Labor | Jan Wilson | 14,824 | 58.05 | −1.06 | |
Liberal | Peter McNeil | 10,713 | 41.95 | +1.06 | |
Total formal votes | 25,537 | 93.14 | −3.38 | ||
Informal votes | 1,882 | 6.86 | +3.38 | ||
Turnout | 27,419 | 92.16 | −2.21 | ||
Labor hold | Swing | -1.06 | |||
Party | Candidate | Votes | % | ±% | |
---|---|---|---|---|---|
Labor | David Cunningham | 16,239 | 57.74 | −7.88 | |
Liberal | Helen Hurley | 8,534 | 30.35 | −4.03 | |
Independent | Michael Newman | 3,349 | 11.91 | +11.91 | |
Total formal votes | 28,122 | 93.73 | −2.66 | ||
Informal votes | 1,880 | 6.27 | +2.66 | ||
Turnout | 30,002 | 93.01 | −0.93 | ||
Two-party-preferred result | |||||
Labor | David Cunningham | 17,759 | 63.27 | −2.35 | |
Liberal | Helen Hurley | 10,310 | 36.73 | +2.35 | |
Labor hold | Swing | -2.35 | |||
Party | Candidate | Votes | % | ±% | |
---|---|---|---|---|---|
Liberal | Victor Perton | 14,885 | 52.95 | −2.69 | |
Labor | Steven Tsitas | 11,163 | 39.71 | −4.65 | |
Independent | Wayne Wright | 1,084 | 3.86 | +3.86 | |
Call to Australia | Guy Salthouse | 977 | 3.48 | +3.48 | |
Total formal votes | 28,109 | 96.41 | −1.36 | ||
Informal votes | 1,048 | 3.59 | +1.36 | ||
Turnout | 29,157 | 93.56 | −0.93 | ||
Two-party-preferred result | |||||
Liberal | Victor Perton | 16,143 | 57.43 | +1.79 | |
Labor | Steven Tsitas | 11,964 | 42.57 | −1.79 | |
Liberal hold | Swing | +1.79 | |||
Party | Candidate | Votes | % | ±% | |
---|---|---|---|---|---|
Labor | Rob Jolly | 20,697 | 58.28 | −6.60 | |
Liberal | Rodney Lavin | 14,816 | 41.72 | +6.60 | |
Total formal votes | 35,513 | 94.41 | −2.40 | ||
Informal votes | 2,101 | 5.59 | +2.40 | ||
Turnout | 37,614 | 93.56 | −0.39 | ||
Labor hold | Swing | -6.60 | |||
Party | Candidate | Votes | % | ±% | |
---|---|---|---|---|---|
Liberal | Ron Wells | 15,857 | 50.81 | −1.62 | |
Labor | Robert Reilly | 14,013 | 44.90 | −2.67 | |
Independent | Cecil Gill | 799 | 2.56 | +2.56 | |
Independent | Florence Bubb | 541 | 1.73 | +1.73 | |
Total formal votes | 31,210 | 97.48 | −0.79 | ||
Informal votes | 807 | 2.52 | +0.79 | ||
Turnout | 32,017 | 93.09 | −0.55 | ||
Two-party-preferred result | |||||
Liberal | Ron Wells | 16,175 | 51.83 | −0.60 | |
Labor | Robert Reilly | 15,032 | 48.17 | +0.60 | |
Liberal hold | Swing | -0.60 | |||
Party | Candidate | Votes | % | ±% | |
---|---|---|---|---|---|
Labor | Barry Rowe | 13,862 | 55.55 | −6.53 | |
Liberal | Thomas Hilbert | 10,404 | 41.70 | +3.78 | |
Call to Australia | Karl Benden | 686 | 2.75 | +2.75 | |
Total formal votes | 24,952 | 95.43 | −1.26 | ||
Informal votes | 1,194 | 4.57 | +1.26 | ||
Turnout | 26,146 | 89.57 | −2.21 | ||
Two-party-preferred result | |||||
Labor | Barry Rowe | 14,156 | 56.74 | −5.34 | |
Liberal | Thomas Hilbert | 10,404 | 43.26 | +5.34 | |
Labor hold | Swing | -5.34 | |||
Party | Candidate | Votes | % | ±% | |
---|---|---|---|---|---|
Liberal | Jim Plowman | 16,393 | 52.78 | +2.88 | |
Labor | Geoff Cooper | 13,690 | 44.07 | −1.15 | |
Independent | Earle Keegel | 978 | 3.15 | +3.15 | |
Total formal votes | 31,061 | 97.30 | −0.59 | ||
Informal votes | 863 | 2.70 | +0.59 | ||
Turnout | 31,924 | 93.51 | −0.24 | ||
Two-party-preferred result | |||||
Liberal | Jim Plowman | 16,774 | 54.00 | +1.17 | |
Labor | Geoffrey Cooper | 14,287 | 46.00 | −1.17 | |
Liberal hold | Swing | +1.17 | |||
Party | Candidate | Votes | % | ±% | |
---|---|---|---|---|---|
Labor | Robert Fordham | 17,635 | 68.52 | −4.83 | |
Liberal | Ernest Zanatta | 6,370 | 24.75 | −1.90 | |
Independent | Elizabeth Doughney | 1,732 | 6.73 | +6.73 | |
Total formal votes | 25,737 | 91.77 | −3.46 | ||
Informal votes | 2,307 | 8.23 | +3.46 | ||
Turnout | 28,044 | 89.16 | −2.24 | ||
Two-party-preferred result | |||||
Labor | Robert Fordham | 18,967 | 73.70 | +0.35 | |
Liberal | Ernest Zanatta | 6,767 | 26.30 | −0.35 | |
Labor hold | Swing | +0.35 | |||
Party | Candidate | Votes | % | ±% | |
---|---|---|---|---|---|
Liberal | John Richardson | 14,557 | 52.88 | −0.99 | |
Labor | John Madden | 12,971 | 47.12 | +0.99 | |
Total formal votes | 27,528 | 96.07 | −1.48 | ||
Informal votes | 1,127 | 3.93 | +1.48 | ||
Turnout | 28,655 | 93.81 | −0.90 | ||
Liberal hold | Swing | -0.99 | |||
Party | Candidate | Votes | % | ±% | |
---|---|---|---|---|---|
Labor | Jane Hill | 15,770 | 56.48 | −1.41 | |
Liberal | Olga Venables | 10,379 | 37.17 | −0.18 | |
Independent | Mike Toldy | 1,772 | 6.35 | +6.35 | |
Total formal votes | 27,921 | 96.18 | −1.34 | ||
Informal votes | 1,110 | 3.82 | +1.34 | ||
Turnout | 29,031 | 92.58 | −0.64 | ||
Two-party-preferred result | |||||
Labor | Jane Hill | 16,427 | 58.83 | −0.69 | |
Liberal | Olga Venables | 11,494 | 41.17 | +0.69 | |
Labor hold | Swing | -0.69 | |||
Party | Candidate | Votes | % | ±% | |
---|---|---|---|---|---|
Liberal | Graeme Weideman | 15,415 | 54.91 | +1.29 | |
Labor | Tony Moore | 12,656 | 45.09 | −1.29 | |
Total formal votes | 28,071 | 96.88 | −0.81 | ||
Informal votes | 903 | 3.12 | +0.81 | ||
Turnout | 28,974 | 92.16 | −0.95 | ||
Liberal hold | Swing | +1.29 | |||
Party | Candidate | Votes | % | ±% | |
---|---|---|---|---|---|
Labor | Hayden Shell | 13,276 | 50.01 | −6.05 | |
Liberal | Ann Henderson | 11,876 | 44.74 | +0.80 | |
Call to Australia | Ian Winter | 1,394 | 5.25 | +5.25 | |
Total formal votes | 26,546 | 97.15 | −0.54 | ||
Informal votes | 778 | 2.85 | +0.54 | ||
Turnout | 27,324 | 91.80 | −0.97 | ||
Two-party-preferred result | |||||
Labor | Hayden Shell | 13,941 | 52.52 | −3.54 | |
Liberal | Ann Henderson | 12,601 | 47.48 | +3.54 | |
Labor hold | Swing | -3.54 | |||
Party | Candidate | Votes | % | ±% | |
---|---|---|---|---|---|
Labor | Neil Trezise | 16,802 | 61.61 | −4.14 | |
Liberal | Michael King | 9,230 | 33.84 | −0.41 | |
Call to Australia | Ernest Andrews | 1,240 | 4.55 | +4.55 | |
Total formal votes | 27,272 | 94.81 | −1.80 | ||
Informal votes | 1,493 | 5.19 | +1.80 | ||
Turnout | 28,765 | 93.23 | −0.51 | ||
Two-party-preferred result | |||||
Labor | Neil Trezise | 17,457 | 64.02 | −1.73 | |
Liberal | Michael King | 9,810 | 35.98 | +1.73 | |
Labor hold | Swing | -1.73 | |||
Party | Candidate | Votes | % | ±% | |
---|---|---|---|---|---|
National | Bruce Evans | 13,218 | 46.99 | −2.63 | |
Labor | Jan Devink | 8,232 | 29.26 | −1.40 | |
Liberal | William Young | 6,162 | 21.91 | +2.19 | |
Call to Australia | Robert Watson | 518 | 1.84 | +1.84 | |
Total formal votes | 28,130 | 97.91 | −0.57 | ||
Informal votes | 601 | 2.09 | +0.57 | ||
Turnout | 28,713 | 92.44 | −0.27 | ||
Two-party-preferred result | |||||
National | Bruce Evans | 19,384 | 69.42 | +1.90 | |
Labor | Jan Devink | 8,538 | 30.58 | −1.90 | |
National hold | Swing | +1.90 | |||
Party | Candidate | Votes | % | ±% | |
---|---|---|---|---|---|
National | Tom Wallace | 13,951 | 48.00 | −0.93 | |
Labor | Keith Vardy | 7,845 | 26.99 | +1.57 | |
Liberal | Anne-Marie McBeath | 6,562 | 22.58 | −3.07 | |
Call to Australia | Leslie Howlett | 709 | 2.44 | +2.44 | |
Total formal votes | 29,067 | 97.99 | −0.47 | ||
Informal votes | 596 | 2.01 | +0.47 | ||
Turnout | 29,663 | 93.18 | +0.12 | ||
Two-party-preferred result | |||||
National | Tom Wallace | 20,375 | 70.17 | +1.90 | |
Labor | Keith Vardy | 8,662 | 29.83 | +29.83 | |
National hold | Swing | +1.90 | |||
Party | Candidate | Votes | % | ±% | |
---|---|---|---|---|---|
Liberal | Alan Brown | 16,670 | 52.57 | +3.28 | |
Labor | Anwyn Martin | 11,539 | 36.39 | +0.47 | |
National | Philip Westwood | 3,500 | 11.04 | −3.75 | |
Total formal votes | 31,709 | 97.65 | −0.59 | ||
Informal votes | 762 | 2.35 | +0.59 | ||
Turnout | 32,471 | 93.74 | −1.03 | ||
Two-party-preferred result | |||||
Liberal | Alan Brown | 19,832 | 62.58 | +0.48 | |
Labor | Anwyn Martin | 11,859 | 37.42 | −0.48 | |
Liberal hold | Swing | +0.48 | |||
Party | Candidate | Votes | % | ±% | |
---|---|---|---|---|---|
Liberal | Tom Reynolds | 18,061 | 54.46 | −3.06 | |
Labor | Eric Dearricott | 13,964 | 42.11 | −0.37 | |
Independent | Glenn Torney | 1,138 | 3.43 | +3.43 | |
Total formal votes | 33,163 | 97.46 | −0.83 | ||
Informal votes | 866 | 2.54 | +0.83 | ||
Turnout | 34,029 | 93.46 | −1.28 | ||
Two-party-preferred result | |||||
Liberal | Tom Reynolds | 18,697 | 56.38 | −1.14 | |
Labor | Eric Dearricott | 14,466 | 43.62 | +1.14 | |
Liberal hold | Swing | -1.14 | |||
Party | Candidate | Votes | % | ±% | |
---|---|---|---|---|---|
Liberal | Ross Smith | 16,045 | 55.88 | −4.20 | |
Labor | Ronald Kirkwood | 11,415 | 39.75 | −0.17 | |
Call to Australia | Peter Olney | 1,254 | 4.37 | +4.37 | |
Total formal votes | 28,714 | 96.53 | −1.01 | ||
Informal votes | 1,032 | 3.47 | +1.01 | ||
Turnout | 29,746 | 94.58 | −0.95 | ||
Two-party-preferred result | |||||
Liberal | Ross Smith | 16,787 | 58.46 | −1.62 | |
Labor | Ronald Kirkwood | 11,927 | 41.54 | +1.62 | |
Liberal hold | Swing | -1.62 | |||
Party | Candidate | Votes | % | ±% | |
---|---|---|---|---|---|
Labor | Pauline Toner | 16,622 | 56.07 | +0.98 | |
Liberal | Robert Manuell | 13,022 | 43.93 | −0.98 | |
Total formal votes | 29,644 | 96.76 | −1.05 | ||
Informal votes | 992 | 3.24 | +1.05 | ||
Turnout | 30,636 | 93.92 | +0.17 | ||
Labor hold | Swing | +0.98 | |||
Party | Candidate | Votes | % | ±% | |
---|---|---|---|---|---|
Liberal | Phil Gude | 15,213 | 58.03 | +2.28 | |
Labor | Bridget Groves | 11,001 | 41.97 | −2.28 | |
Total formal votes | 26,214 | 96.82 | −0.61 | ||
Informal votes | 861 | 3.18 | +0.61 | ||
Turnout | 27,075 | 89.33 | −1.15 | ||
Liberal hold | Swing | +2.28 | |||
Party | Candidate | Votes | % | ±% | |
---|---|---|---|---|---|
Liberal | Vin Heffernan | 13,931 | 50.33 | −1.30 | |
Labor | Patricia Moynihan | 11,671 | 42.16 | −6.21 | |
Democrats | Howard McCallum | 2,079 | 7.51 | +7.51 | |
Total formal votes | 27,681 | 97.26 | −0.48 | ||
Informal votes | 780 | 2.74 | +0.48 | ||
Turnout | 28,461 | 92.94 | −0.61 | ||
Two-party-preferred result | |||||
Liberal | Vin Heffernan | 14,505 | 52.40 | +0.77 | |
Labor | Patricia Moynihan | 13,176 | 47.60 | −0.77 | |
Liberal hold | Swing | +0.77 | |||
Party | Candidate | Votes | % | ±% | |
---|---|---|---|---|---|
Labor | George Seitz | 18,601 | 57.86 | −3.60 | |
Liberal | Chris Dimitrijevic | 11,346 | 35.30 | −3.24 | |
Democratic Labor | Shane McCarthy | 1,274 | 3.96 | +3.96 | |
Independent | Charles Campagnac | 925 | 2.88 | +2.88 | |
Total formal votes | 32,146 | 94.22 | −2.35 | ||
Informal votes | 1,972 | 5.78 | +2.35 | ||
Turnout | 34,118 | 92.34 | −2.13 | ||
Two-party-preferred result | |||||
Labor | George Seitz | 19,726 | 61.39 | −0.07 | |
Liberal | Chris Dimitrijevic | 12,404 | 38.61 | +0.07 | |
Labor hold | Swing | -0.07 | |||
Party | Candidate | Votes | % | ±% | |
---|---|---|---|---|---|
Liberal | Jan Wade | 15,715 | 61.00 | +0.80 | |
Labor | Tim Muffet | 10,048 | 39.00 | −0.80 | |
Total formal votes | 25,763 | 96.51 | −0.58 | ||
Informal votes | 932 | 3.49 | +0.58 | ||
Turnout | 26,695 | 90.37 | −1.54 | ||
Liberal hold | Swing | +0.80 | |||
Party | Candidate | Votes | % | ±% | |
---|---|---|---|---|---|
Labor | Steve Crabb | 14,173 | 53.27 | −6.05 | |
Liberal | Bruce Bingham | 10,311 | 38.75 | +1.84 | |
Call to Australia | Kenneth Morgan | 1,077 | 4.05 | +4.05 | |
Independent | Stephen Gillies | 1,047 | 3.93 | +3.93 | |
Total formal votes | 26,608 | 96.66 | −1.21 | ||
Informal votes | 918 | 3.34 | +1.21 | ||
Turnout | 27,526 | 93.45 | −0.73 | ||
Two-party-preferred result | |||||
Labor | Steve Crabb | 14,896 | 55.99 | −4.63 | |
Liberal | Bruce Bingham | 11,709 | 44.01 | +4.63 | |
Labor hold | Swing | -4.63 | |||
Party | Candidate | Votes | % | ±% | |
---|---|---|---|---|---|
National | Bill McGrath | 16,468 | 61.03 | −2.13 | |
Liberal | Roderick Coutts | 6,003 | 22.25 | +4.03 | |
Labor | Robert Luciani | 4,511 | 16.72 | −1.90 | |
Total formal votes | 26,982 | 98.62 | −0.29 | ||
Informal votes | 377 | 1.38 | +0.29 | ||
Turnout | 27,359 | 95.42 | −0.41 | ||
Two-party-preferred result | |||||
National | Bill McGrath | 22,134 | 82.04 | +2.17 | |
Labor | Robert Luciani | 4,845 | 17.96 | −2.17 | |
National hold | Swing | +2.17 | |||
Party | Candidate | Votes | % | ±% | |
---|---|---|---|---|---|
Liberal | Geoff Leigh | 15,429 | 61.95 | +2.14 | |
Labor | Philip Cottier | 9,478 | 38.05 | −2.14 | |
Total formal votes | 24,907 | 96.81 | −0.90 | ||
Informal votes | 820 | 3.19 | +0.90 | ||
Turnout | 25,727 | 89.91 | −1.05 | ||
Liberal hold | Swing | +2.14 | |||
Party | Candidate | Votes | % | ±% | |
---|---|---|---|---|---|
Labor | Neil Cole | 15,270 | 68.03 | +7.07 | |
Liberal | Catherine Dossetor | 7,177 | 31.97 | −0.19 | |
Total formal votes | 22,447 | 93.47 | −2.22 | ||
Informal votes | 1,569 | 6.53 | +2.22 | ||
Turnout | 24,016 | 84.87 | −0.61 | ||
Labor hold | Swing | +4.71 | |||
Party | Candidate | Votes | % | ±% | |
---|---|---|---|---|---|
Labor | Peter Spyker | 12,971 | 48.58 | −3.39 | |
Liberal | Maxwell Read | 11,976 | 44.85 | −3.18 | |
Democrats | Sarah Austin | 1,240 | 4.64 | +4.64 | |
Independent | John Murray | 515 | 1.93 | +1.93 | |
Total formal votes | 26,702 | 97.00 | −0.43 | ||
Informal votes | 825 | 3.00 | +0.43 | ||
Turnout | 27,527 | 93.02 | −0.66 | ||
Two-party-preferred result | |||||
Labor | Peter Spyker | 13,989 | 52.40 | +0.43 | |
Liberal | Maxwell Read | 12,707 | 47.60 | −0.43 | |
Labor hold | Swing | +0.43 | |||
Party | Candidate | Votes | % | ±% | |
---|---|---|---|---|---|
National | John Arnold | 10,594 | 38.26 | −20.43 | |
Liberal | Craig Bildstien | 8,849 | 31.96 | +13.54 | |
Labor | Lindsay Leake | 5,962 | 21.53 | −1.36 | |
Independent | David Caccianiga | 2,287 | 8.26 | +8.26 | |
Total formal votes | 27,692 | 97.52 | −0.37 | ||
Informal votes | 703 | 2.48 | +0.37 | ||
Turnout | 28,395 | 92.52 | −0.08 | ||
Two-candidate-preferred result | |||||
Liberal | Craig Bildstien | 14,096 | 50.96 | +50.96 | |
National | John Arnold | 13,565 | 49.04 | −26.55 | |
Liberal gain from National | Swing | N/A | |||
Party | Candidate | Votes | % | ±% | |
---|---|---|---|---|---|
Labor | John Harrowfield | 12,380 | 45.98 | −7.73 | |
Liberal | Matthew Starr | 11,548 | 42.89 | −3.40 | |
Democrats | Louise Enders | 1,830 | 6.80 | +6.80 | |
Call to Australia | Johan Elsmann | 1,164 | 4.32 | +4.32 | |
Total formal votes | 26,922 | 97.10 | −0.42 | ||
Informal votes | 805 | 2.90 | +0.42 | ||
Turnout | 27,727 | 93.72 | −0.71 | ||
Two-party-preferred result | |||||
Labor | John Harrowfield | 14,247 | 52.95 | −0.76 | |
Liberal | Matthew Starr | 12,661 | 47.05 | +0.76 | |
Labor hold | Swing | -0.76 | |||
Party | Candidate | Votes | % | ±% | |
---|---|---|---|---|---|
Labor | Neil Pope | 14,384 | 51.89 | −1.82 | |
Liberal | Nola Vulling | 12,167 | 43.89 | −2.40 | |
Call to Australia | Christopher Shirreff | 1,168 | 4.21 | +4.21 | |
Total formal votes | 27,719 | 97.26 | −0.50 | ||
Informal votes | 781 | 2.74 | +0.50 | ||
Turnout | 28,500 | 92.77 | +0.14 | ||
Two-party-preferred result | |||||
Labor | Neil Pope | 14,840 | 53.54 | −0.17 | |
Liberal | Nola Vulling | 12,879 | 46.46 | +0.17 | |
Labor hold | Swing | -0.17 | |||
Party | Candidate | Votes | % | ±% | |
---|---|---|---|---|---|
Liberal | Robin Cooper | 16,363 | 49.93 | −2.06 | |
Labor | Barry Smith | 14,017 | 42.77 | −5.24 | |
Democrats | Peter Carroll | 2,393 | 7.30 | +7.30 | |
Total formal votes | 32,773 | 96.77 | −0.95 | ||
Informal votes | 1,093 | 3.23 | +0.95 | ||
Turnout | 33,866 | 92.49 | +0.11 | ||
Two-party-preferred result | |||||
Liberal | Robin Cooper | 17,050 | 52.03 | +0.04 | |
Labor | Barry Smith | 15,719 | 47.97 | −0.04 | |
Liberal hold | Swing | +0.04 | |||
Party | Candidate | Votes | % | ±% | |
---|---|---|---|---|---|
Labor | Keith Hamilton | 11,675 | 42.03 | −10.68 | |
Liberal | Norman Olsen | 5,577 | 20.08 | −5.53 | |
Independent | Barry Murphy | 3,687 | 13.27 | +13.27 | |
National | Alan Witchell | 3,507 | 12.63 | +4.23 | |
Independent | Geoffrey Francis | 2,597 | 9.35 | +9.35 | |
Democrats | James Richards | 733 | 2.64 | +2.64 | |
Total formal votes | 27,776 | 96.61 | −1.20 | ||
Informal votes | 975 | 3.39 | +1.20 | ||
Turnout | 28,751 | 94.28 | +0.65 | ||
Two-party-preferred result | |||||
Labor | Keith Hamilton | 14,654 | 52.79 | −6.08 | |
Liberal | Norman Olsen | 13,105 | 47.21 | +6.08 | |
Labor hold | Swing | -6.08 | |||
Party | Candidate | Votes | % | ±% | |
---|---|---|---|---|---|
National | Ken Jasper | 17,354 | 58.17 | −0.84 | |
Labor | Jill Milthorpe | 7,813 | 26.19 | −0.49 | |
Liberal | Diane Mathieson | 4,664 | 15.63 | +1.32 | |
Total formal votes | 29,831 | 98.09 | −0.10 | ||
Informal votes | 581 | 1.91 | +0.10 | ||
Turnout | 30,412 | 92.53 | −1.57 | ||
Two-party-preferred result | |||||
National | Ken Jasper | 21,286 | 71.37 | −0.76 | |
Labor | Jill Milthorpe | 8,539 | 28.63 | +0.76 | |
National hold | Swing | -0.76 | |||
Party | Candidate | Votes | % | ±% | |
---|---|---|---|---|---|
Labor | Neil Young | 12,281 | 44.14 | −2.18 | |
Liberal | John Delzoppo | 11,612 | 41.73 | −1.87 | |
National | Kenneth Ipsen | 2,783 | 10.00 | +3.01 | |
Democrats | David White | 1,148 | 4.13 | +4.13 | |
Total formal votes | 27,824 | 97.50 | −0.47 | ||
Informal votes | 713 | 2.50 | +0.47 | ||
Turnout | 28,537 | 93.85 | −0.63 | ||
Two-party-preferred result | |||||
Liberal | John Delzoppo | 14,371 | 51.67 | +1.31 | |
Labor | Neil Young | 13,443 | 48.33 | −1.31 | |
Liberal hold | Swing | +1.31 | |||
Party | Candidate | Votes | % | ±% | |
---|---|---|---|---|---|
Labor | Bob Sercombe | 14,717 | 54.23 | −8.76 | |
Liberal | Susan Feltham | 10,336 | 38.09 | +1.08 | |
Independent | Lance Hutchinson | 2,083 | 7.68 | +7.68 | |
Total formal votes | 27,136 | 94.35 | −2.06 | ||
Informal votes | 1,625 | 5.65 | +2.06 | ||
Turnout | 28,761 | 93.91 | −1.27 | ||
Two-party-preferred result | |||||
Labor | Bob Sercombe | 15,763 | 58.11 | −4.88 | |
Liberal | Susan Feltham | 11,365 | 41.89 | +4.88 | |
Labor hold | Swing | -4.88 | |||
Party | Candidate | Votes | % | ±% | |
---|---|---|---|---|---|
Labor | Tony Sheehan | 17,900 | 71.67 | −0.17 | |
Liberal | Ross Lane | 7,075 | 28.33 | +0.17 | |
Total formal votes | 24,975 | 93.10 | −2.41 | ||
Informal votes | 1,851 | 6.90 | +2.41 | ||
Turnout | 26,826 | 89.73 | −1.02 | ||
Labor hold | Swing | -0.17 | |||
Party | Candidate | Votes | % | ±% | |
---|---|---|---|---|---|
Labor | Race Mathews | 12,645 | 50.41 | −3.40 | |
Liberal | Ian Pope | 9,560 | 38.11 | −4.91 | |
Independent | Heather Norling | 1,736 | 6.92 | +6.92 | |
Independent | Antonis Pashos | 919 | 3.66 | +0.49 | |
Independent | Philip Mitchell | 225 | 0.90 | +0.90 | |
Total formal votes | 25,085 | 95.33 | −1.82 | ||
Informal votes | 1,228 | 4.67 | +1.82 | ||
Turnout | 26,313 | 91.54 | −0.26 | ||
Two-party-preferred result | |||||
Labor | Race Mathews | 14,353 | 57.26 | +2.37 | |
Liberal | Ian Pope | 10,715 | 42.74 | −2.37 | |
Labor hold | Swing | +2.37 | |||
Party | Candidate | Votes | % | ±% | |
---|---|---|---|---|---|
Labor | Kelvin Thomson | 12,846 | 50.64 | −10.71 | |
Liberal | Geoff Lutz | 9,013 | 35.53 | −3.12 | |
Independent | Cath Price | 2,251 | 8.87 | +8.87 | |
Democratic Labor | Mark Beshara | 1,255 | 4.95 | +4.95 | |
Total formal votes | 25,365 | 96.08 | −0.36 | ||
Informal votes | 1,035 | 3.92 | +0.36 | ||
Turnout | 26,400 | 92.10 | −2.16 | ||
Two-party-preferred result | |||||
Labor | Kelvin Thomson | 13,803 | 54.44 | −6.91 | |
Liberal | Geoff Lutz | 11,551 | 45.56 | +6.91 | |
Labor hold | Swing | -6.91 | |||
Party | Candidate | Votes | % | ±% | |
---|---|---|---|---|---|
Liberal | Ian Smith | 15,716 | 54.04 | −0.42 | |
Labor | Paul Kennelly | 8,799 | 30.26 | +0.89 | |
National | Michael Evans | 4,565 | 15.70 | −0.47 | |
Total formal votes | 29,080 | 97.88 | −0.56 | ||
Informal votes | 630 | 2.12 | +0.56 | ||
Turnout | 29,710 | 94.64 | −1.34 | ||
Two-party-preferred result | |||||
Liberal | Ian Smith | 19,213 | 66.07 | −1.60 | |
Labor | Paul Kennelly | 9,867 | 33.93 | +1.60 | |
Liberal hold | Swing | -1.60 | |||
Party | Candidate | Votes | % | ±% | |
---|---|---|---|---|---|
Liberal | Denis Napthine | 12,451 | 46.10 | −4.16 | |
Labor | Bill Sharrock | 9,359 | 34.65 | +0.39 | |
National | Graeme Dawson | 5,197 | 19.24 | +3.76 | |
Total formal votes | 27,007 | 98.36 | −0.22 | ||
Informal votes | 451 | 1.64 | +0.22 | ||
Turnout | 27,458 | 93.56 | −1.29 | ||
Two-party-preferred result | |||||
Liberal | Denis Napthine | 16,527 | 61.22 | −1.69 | |
Labor | Bill Sharrock | 9,359 | 38.78 | +1.69 | |
Liberal hold | Swing | -1.69 | |||
Party | Candidate | Votes | % | ±% | |
---|---|---|---|---|---|
Liberal | Don Hayward | 13,531 | 56.05 | +2.62 | |
Labor | Roman Jade | 10,020 | 41.50 | +0.28 | |
Call to Australia | Neil Baluch | 592 | 2.45 | +2.45 | |
Total formal votes | 24,143 | 95.91 | −1.28 | ||
Informal votes | 1,029 | 4.09 | +1.28 | ||
Turnout | 25,172 | 86.46 | −1.80 | ||
Two-party-preferred result | |||||
Liberal | Don Hayward | 13,864 | 57.42 | +0.48 | |
Labor | Roman Jade | 10,279 | 42.58 | −0.48 | |
Liberal hold | Swing | +0.48 | |||
Party | Candidate | Votes | % | ±% | |
---|---|---|---|---|---|
Labor | Michael Leighton | 18,026 | 71.07 | +1.50 | |
Liberal | Peter Papaemmanouil | 7,336 | 28.93 | −1.50 | |
Total formal votes | 25,362 | 92.94 | −2.84 | ||
Informal votes | 1,928 | 7.06 | +2.84 | ||
Turnout | 27,290 | 90.40 | −0.91 | ||
Labor hold | Swing | +1.50 | |||
Party | Candidate | Votes | % | ±% | |
---|---|---|---|---|---|
Labor | Jim Simmonds | 14,352 | 55.49 | −13.17 | |
Liberal | Richard Michelsons | 7,163 | 27.69 | −3.65 | |
Independent | Alan Hogan | 4,350 | 16.82 | +16.82 | |
Total formal votes | 25,865 | 93.13 | −2.65 | ||
Informal votes | 1,908 | 6.87 | +2.65 | ||
Turnout | 27,773 | 92.36 | −1.47 | ||
Two-party-preferred result | |||||
Labor | Jim Simmonds | 17,174 | 66.41 | −2.25 | |
Liberal | Richard Michelsons | 8,688 | 33.59 | +2.25 | |
Labor hold | Swing | -2.25 | |||
Party | Candidate | Votes | % | ±% | |
---|---|---|---|---|---|
Labor | Demetri Dollis | 14,630 | 60.42 | −10.99 | |
Liberal | David Monk | 5,452 | 22.51 | −6.08 | |
Democratic Labor | John Mulholland | 1,626 | 6.71 | +6.71 | |
Independent | Bill Hampson | 1,395 | 5.76 | +5.76 | |
Independent | Steve Florin | 1,112 | 4.59 | +4.59 | |
Total formal votes | 24,215 | 92.43 | −2.80 | ||
Informal votes | 1,984 | 7.57 | +2.80 | ||
Turnout | 26,199 | 86.11 | −0.96 | ||
Two-party-preferred result | |||||
Labor | Demetri Dollis | 16,273 | 67.28 | −4.13 | |
Liberal | David Monk | 7,915 | 32.72 | +4.13 | |
Labor hold | Swing | -4.13 | |||
Party | Candidate | Votes | % | ±% | |
---|---|---|---|---|---|
Labor | Kay Setches | 13,203 | 46.90 | −5.80 | |
Liberal | Bruce Camfield | 12,383 | 43.98 | −3.32 | |
Democrats | Sid Spindler | 1,270 | 4.51 | +4.51 | |
Call to Australia | Mark Ansell | 783 | 2.78 | +2.78 | |
Independent | James Cockell | 515 | 1.83 | +1.83 | |
Total formal votes | 28,154 | 97.10 | −0.79 | ||
Informal votes | 842 | 2.90 | +0.79 | ||
Turnout | 28,996 | 92.94 | −0.94 | ||
Two-party-preferred result | |||||
Labor | Kay Setches | 14,358 | 51.66 | −1.04 | |
Liberal | Bruce Camfield | 13,606 | 48.34 | +1.04 | |
Labor hold | Swing | -1.04 | |||
Party | Candidate | Votes | % | ±% | |
---|---|---|---|---|---|
Liberal | Tom Austin | 16,120 | 56.90 | +0.38 | |
Labor | John McQuilten | 12,208 | 43.10 | −0.38 | |
Total formal votes | 28,328 | 97.59 | −0.66 | ||
Informal votes | 699 | 2.41 | +0.66 | ||
Turnout | 29,027 | 94.62 | −0.88 | ||
Liberal hold | Swing | +0.38 | |||
Party | Candidate | Votes | % | ±% | |
---|---|---|---|---|---|
National | Eddie Hann | 19,330 | 66.57 | −3.87 | |
Labor | Leonard Blair | 5,795 | 19.96 | +0.73 | |
Liberal | Margarita Dale | 3,913 | 13.48 | +3.15 | |
Total formal votes | 29,038 | 98.32 | −0.31 | ||
Informal votes | 496 | 1.68 | +0.31 | ||
Turnout | 29,534 | 94.57 | −0.05 | ||
Two-party-preferred result | |||||
National | Eddie Hann | 22,823 | 78.62 | −1.30 | |
Labor | Leonard Blair | 6,208 | 21.38 | +1.30 | |
National hold | Swing | -1.30 | |||
Party | Candidate | Votes | % | ±% | |
---|---|---|---|---|---|
Labor | Alex Andrianopoulos | 16,296 | 59.94 | −11.03 | |
Liberal | George Korytsky | 7,582 | 27.89 | −1.14 | |
Independent | Peter Portelli | 3,308 | 12.17 | +12.17 | |
Total formal votes | 27,186 | 90.28 | −3.54 | ||
Informal votes | 2,928 | 9.72 | +3.54 | ||
Turnout | 30,114 | 92.07 | −1.35 | ||
Two-party-preferred result | |||||
Labor | Alex Andrianopoulos | 17,041 | 62.71 | −8.26 | |
Liberal | George Korytsky | 10,132 | 37.29 | +8.26 | |
Labor hold | Swing | -8.26 | |||
Party | Candidate | Votes | % | ±% | |
---|---|---|---|---|---|
Labor | Andrew McCutcheon | 11,652 | 49.83 | −2.82 | |
Liberal | John Callanan | 9,988 | 42.72 | −4.63 | |
Democrats | Geoffrey Brooks | 1,742 | 7.45 | +7.45 | |
Total formal votes | 23,382 | 95.33 | −1.12 | ||
Informal votes | 1,146 | 4.67 | +1.12 | ||
Turnout | 24,528 | 87.10 | −1.81 | ||
Two-party-preferred result | |||||
Labor | Andrew McCutcheon | 12,993 | 55.57 | +2.92 | |
Liberal | John Callanan | 10,389 | 44.43 | −2.92 | |
Labor hold | Swing | +2.92 | |||
Party | Candidate | Votes | % | ±% | |
---|---|---|---|---|---|
Liberal | David Lea | 14,476 | 54.78 | −0.10 | |
Labor | Ian Pugh | 11,296 | 42.75 | −2.37 | |
Call to Australia | John Minty | 652 | 2.47 | +2.47 | |
Total formal votes | 26,424 | 97.53 | −0.23 | ||
Informal votes | 669 | 2.47 | +0.23 | ||
Turnout | 27,093 | 92.11 | −0.66 | ||
Two-party-preferred result | |||||
Liberal | David Lea | 14,891 | 56.36 | +1.48 | |
Labor | Ian Pugh | 11,532 | 43.64 | −1.48 | |
Liberal hold | Swing | +1.48 | |||
Party | Candidate | Votes | % | ±% | |
---|---|---|---|---|---|
National | Peter Ross-Edwards | 15,570 | 54.68 | −1.96 | |
Labor | David Wauchope | 7,581 | 26.62 | +0.59 | |
Liberal | John Menzies | 5,323 | 18.69 | +1.36 | |
Total formal votes | 28,474 | 97.56 | −0.48 | ||
Informal votes | 711 | 2.44 | +0.48 | ||
Turnout | 29,185 | 93.95 | +0.15 | ||
Two-party-preferred result | |||||
National | Peter Ross-Edwards | 20,353 | 71.50 | −1.03 | |
Labor | David Wauchope | 8,112 | 28.50 | +1.03 | |
National hold | Swing | -1.03 | |||
Party | Candidate | Votes | % | ±% | |
---|---|---|---|---|---|
Liberal | Harley Dickinson | 14,821 | 52.11 | −1.29 | |
Labor | George Williams | 11,848 | 41.66 | −4.94 | |
Call to Australia | Terry Winter | 1,774 | 6.24 | +6.24 | |
Total formal votes | 28,443 | 97.63 | −0.40 | ||
Informal votes | 690 | 2.37 | +0.40 | ||
Turnout | 29,133 | 93.47 | −2.35 | ||
Two-party-preferred result | |||||
Liberal | Harley Dickinson | 15,590 | 54.82 | +1.42 | |
Labor | George Williams | 12,848 | 45.18 | −1.42 | |
Liberal hold | Swing | +1.42 | |||
Party | Candidate | Votes | % | ±% | |
---|---|---|---|---|---|
Labor | Eddie Micallef | 14,900 | 52.86 | −4.15 | |
Liberal | Kieran Magee | 10,479 | 39.68 | −3.31 | |
Call to Australia | Jodie Rickard | 1,320 | 5.00 | +5.00 | |
National | Wernfried Klimek | 650 | 2.46 | +2.46 | |
Total formal votes | 26,409 | 92.73 | −3.21 | ||
Informal votes | 2,071 | 7.27 | +3.21 | ||
Turnout | 28,480 | 93.20 | −0.57 | ||
Two-party-preferred result | |||||
Labor | Eddie Micallef | 14,900 | 56.42 | −0.59 | |
Liberal | Kieran Magee | 11,509 | 43.38 | +0.59 | |
Labor hold | Swing | -0.59 | |||
Party | Candidate | Votes | % | ±% | |
---|---|---|---|---|---|
Labor | Ian Baker | 16,285 | 66.40 | −4.67 | |
Liberal | Julie Reid | 6,423 | 26.19 | −2.74 | |
Independent | Alan Finch | 1,817 | 7.41 | +7.41 | |
Total formal votes | 24,525 | 92.39 | −3.15 | ||
Informal votes | 2,020 | 7.61 | +3.15 | ||
Turnout | 26,545 | 90.71 | −1.65 | ||
Two-party-preferred result | |||||
Labor | Ian Baker | 17,513 | 71.49 | +0.42 | |
Liberal | Julie Reid | 6,984 | 28.51 | −0.42 | |
Labor hold | Swing | +0.42 | |||
Party | Candidate | Votes | % | ±% | |
---|---|---|---|---|---|
National | Barry Steggall | 15,539 | 60.74 | +2.38 | |
Labor | Ronald Stanton | 5,132 | 20.06 | −0.64 | |
Liberal | Daphne Wilkins | 4,912 | 19.20 | −1.74 | |
Total formal votes | 25,583 | 98.20 | −0.29 | ||
Informal votes | 468 | 1.80 | +0.29 | ||
Turnout | 26,051 | 92.99 | −1.25 | ||
Two-party-preferred result | |||||
National | Barry Steggall | 19,940 | 77.96 | +2.17 | |
Labor | Ronald Stanton | 5,638 | 22.04 | +22.04 | |
National hold | Swing | +2.17 | |||
Party | Candidate | Votes | % | ±% | |
---|---|---|---|---|---|
Liberal | Geoff Coleman | 11,905 | 46.23 | −3.51 | |
Labor | James Claven | 11,241 | 43.65 | −3.76 | |
Democrats | Martin Maguire | 1,575 | 6.12 | +6.12 | |
Call to Australia | Ronald Marshman | 1,032 | 4.01 | +4.01 | |
Total formal votes | 25,753 | 96.54 | −0.96 | ||
Informal votes | 922 | 3.46 | +0.96 | ||
Turnout | 26,675 | 93.24 | −2.10 | ||
Two-party-preferred result | |||||
Liberal | Geoff Coleman | 13,044 | 50.66 | −0.69 | |
Labor | James Claven | 12,704 | 49.34 | +0.69 | |
Liberal hold | Swing | -0.69 | |||
Party | Candidate | Votes | % | ±% | |
---|---|---|---|---|---|
Labor | Beth Gleeson | 21,324 | 72.37 | −1.53 | |
Liberal | Michael Fusco | 8,141 | 27.63 | +1.53 | |
Total formal votes | 29,465 | 91.91 | −3.45 | ||
Informal votes | 2,595 | 8.09 | +3.45 | ||
Turnout | 32,060 | 92.66 | −1.83 | ||
Labor hold | Swing | -1.53 | |||
Party | Candidate | Votes | % | ±% | |
---|---|---|---|---|---|
Labor | Carolyn Hirsh | 14,696 | 51.70 | −3.56 | |
Liberal | Rob Llewellyn | 12,585 | 44.27 | −0.47 | |
Call to Australia | John Taylor | 1,144 | 4.02 | +4.02 | |
Total formal votes | 28,425 | 96.72 | −0.62 | ||
Informal votes | 965 | 3.28 | +0.62 | ||
Turnout | 29,390 | 94.67 | −0.69 | ||
Two-party-preferred result | |||||
Labor | Carolyn Hirsh | 15,048 | 52.94 | −2.32 | |
Liberal | Rob Llewellyn | 13,374 | 47.06 | +2.32 | |
Labor hold | Swing | -2.32 | |||
Party | Candidate | Votes | % | ±% | |
---|---|---|---|---|---|
Liberal | Phil Honeywood | 14,268 | 47.22 | +0.79 | |
Labor | Lou Hill | 13,007 | 43.04 | −5.70 | |
Democrats | David Ball | 1,391 | 4.60 | +4.60 | |
Call to Australia | Nelleke Arnold | 820 | 2.71 | +2.71 | |
Independent | Harold Collins | 375 | 1.24 | +1.24 | |
Independent | Joy Lane | 358 | 1.18 | +1.18 | |
Total formal votes | 30,219 | 97.25 | −0.95 | ||
Informal votes | 854 | 2.75 | +0.95 | ||
Turnout | 31,073 | 93.93 | −0.46 | ||
Two-party-preferred result | |||||
Liberal | Phil Honeywood | 15,555 | 51.49 | +1.65 | |
Labor | Lou Hill | 14,655 | 48.51 | −1.65 | |
Liberal gain from Labor | Swing | +1.65 | |||
Party | Candidate | Votes | % | ±% | |
---|---|---|---|---|---|
National | John McGrath | 14,838 | 52.44 | +20.25 | |
Liberal | Eda Ritchie | 7,244 | 25.60 | −15.84 | |
Labor | Peter Steele | 6,213 | 21.96 | −4.41 | |
Total formal votes | 28,295 | 98.62 | −0.35 | ||
Informal votes | 397 | 1.38 | +0.35 | ||
Turnout | 28,692 | 94.94 | +0.21 | ||
Two-party-preferred result | |||||
National | John McGrath | 21,866 | 77.28 | ||
Labor | Peter Steele | 6,429 | 22.72 | ||
National hold | Swing | ||||
Party | Candidate | Votes | % | ±% | |
---|---|---|---|---|---|
Labor | Ken Coghill | 18,788 | 56.21 | +2.42 | |
Liberal | Alexander Mather | 10,509 | 31.44 | −6.98 | |
Independent | John Gibbons | 4,125 | 12.34 | +12.34 | |
Total formal votes | 33,421 | 96.22 | −1.71 | ||
Informal votes | 1,350 | 3.88 | +1.71 | ||
Turnout | 34,772 | 94.10 | +1.25 | ||
Two-party-preferred result | |||||
Labor | Ken Coghill | 20,204 | 60.51 | +4.05 | |
Liberal | Alexander Mather | 13,187 | 39.49 | −4.05 | |
Labor hold | Swing | +4.05 | |||
Party | Candidate | Votes | % | ±% | |
---|---|---|---|---|---|
Labor | Max McDonald | 18,279 | 54.70 | +0.09 | |
Liberal | Geoffrey Parsons | 15,139 | 45.30 | −0.09 | |
Total formal votes | 33,418 | 96.57 | −1.14 | ||
Informal votes | 1,186 | 3.43 | +1.14 | ||
Turnout | 34,604 | 93.84 | −0.54 | ||
Labor hold | Swing | +0.09 | |||
Party | Candidate | Votes | % | ±% | |
---|---|---|---|---|---|
Labor | Joan Kirner | 17,154 | 63.29 | −5.48 | |
Liberal | Stuart Mackley | 8,181 | 30.18 | −1.05 | |
Independent | Richard Kirby | 1,770 | 6.53 | +6.53 | |
Total formal votes | 27,105 | 93.92 | −2.27 | ||
Informal votes | 1,756 | 6.08 | +2.27 | ||
Turnout | 28,861 | 92.41 | −0.87 | ||
Two-party-preferred result | |||||
Labor | Joan Kirner | 18,338 | 67.72 | −1.05 | |
Liberal | Stuart Mackley | 8,743 | 32.28 | +1.05 | |
Labor hold | Swing | -1.05 | |||
The 2002 Victorian state election, held on Saturday, 30 November 2002, was for the 55th Parliament of Victoria. It was held to elect the 88 members of Victorian Legislative Assembly and 22 members of the 44-member Legislative Council.
The 1999 Victorian state election, held on Saturday, 18 September 1999, was for the 54th Parliament of Victoria. It was held in the Australian state of Victoria to elect the 88 members of the state's Legislative Assembly and 22 members of the 44-member Legislative Council. The Liberal–National Coalition led by Jeff Kennett and Pat McNamara, which had held majority government since the 1996 election, lost 15 seats and its majority due mainly to a swing against it in rural and regional Victoria.
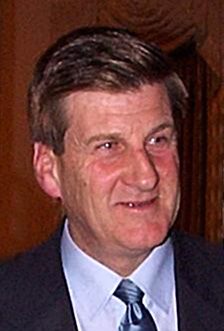
The 1996 Victorian state election, held on Saturday, 30 March 1996, was for the 53rd Parliament of Victoria. It was held in the Australian state of Victoria to elect all 88 members of the state's Legislative Assembly and 22 members of the 44-member Legislative Council. The election took place four weeks after the 1996 federal election which swept the Labor Party from power nationally.
The 1992 Victoria state election, held on Saturday, October 3. was for the 52nd Parliament of Victoria. It was held in the Australian state of Victoria to elect all 88 members of the state's Legislative Assembly and 22 members of the 44-member Legislative Council.
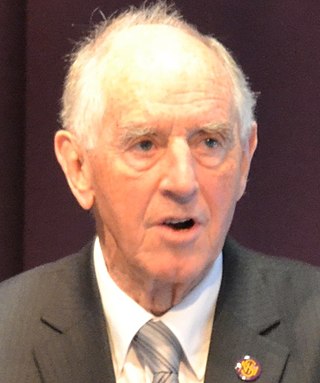
The 1988 Victorian state election, held on Saturday, 1 October 1988, was for the 51st Parliament of Victoria. It was held in the Australian state of Victoria to elect all 88 members of the state's Legislative Assembly and 22 members of the 44-member Legislative Council.
The 2006 Victorian state election, held on Saturday, 25 November 2006, was for the 56th Parliament of Victoria. Just over 3 million Victorians registered to vote elected 88 members to the Legislative Assembly and, for the first time, 40 members to the Legislative Council under a proportional representation system. The election was conducted by the independent Victorian Electoral Commission.
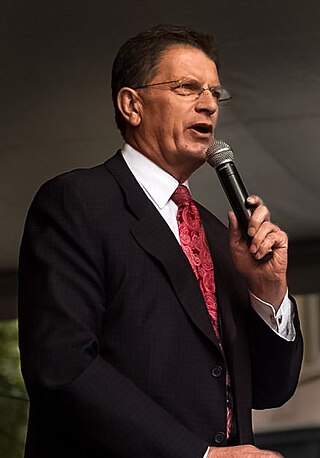
The 2010 Victorian state election, held on Saturday, 27 November 2010, was for the 57th Parliament of Victoria. The election was to elect all 88 members of the Legislative Assembly and all 40 members of the Legislative Council. The incumbent centre-left Labor Party government, led by John Brumby, was defeated by the centre-right Liberal/National Coalition opposition, led by Ted Baillieu. The election gave the Coalition a one-seat majority in both houses of parliament.
Elections were held in the Australian state of Victoria on 27 June 1964 to elect the 66 members of the state's Legislative Assembly and 17 members of the 34-member Legislative Council. The Liberal and Country Party (LCP) government of Premier Henry Bolte won a fourth term in office.
This is a list of electoral results for the Electoral district of Albert Park in Victorian state elections from 1889 to the present.
The 1955 Victorian state election was held in the Australian State of Victoria on Saturday, 28 May 1955 to elect 65 members of the state's Legislative Assembly.
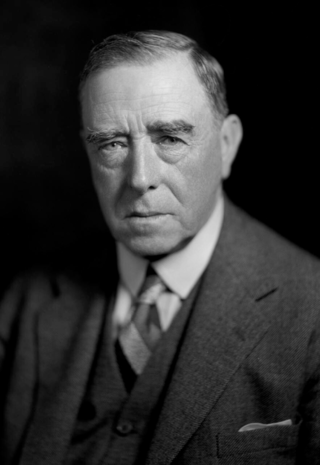
The 1932 Victorian state election was held in the Australian state of Victoria on Saturday 14 May 1932 to elect 44 of the 65 members of the state's Legislative Assembly. The other 21 seats were uncontested.
The 1927 Victorian state election was held in the Australian state of Victoria on Saturday, 9 April 1927, to elect the 65 members of the state's Legislative Assembly.
The 2018 Victorian state election was held on Saturday, 24 November 2018 to elect the 59th Parliament of Victoria. All 88 seats in the Legislative Assembly and all 40 seats in the Legislative Council were up for election. The first-term incumbent Labor government, led by Premier Daniel Andrews, won a second four-year term, defeating the Liberal/National Coalition opposition, led by Opposition Leader Matthew Guy in a landslide victory. Minor party the Greens led by Samantha Ratnam also contested the election.
The 2021 Western Australian state election was held on Saturday, March 13, to elect members to the Parliament of Western Australia, where all 59 seats in the Legislative Assembly and all 36 seats in the Legislative Council were up for election.
This is a list of electoral district results for the Victorian 1967 election.
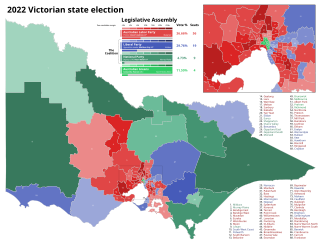
The 2022 Victorian state election was held on Saturday, 26 November 2022 to elect the 60th Parliament of Victoria. All 88 seats in the Legislative Assembly and all 40 seats in the Legislative Council were up for election at the time the writs were issued, however the election in the district of Narracan was deferred due to the death of a candidate.
This is a list of electoral results for the Ballarat Province in Victorian state elections.
This is a list of electoral results for the electoral district of Reservoir in Victorian state elections.
The 2026 Victorian state election is expected to be held on 28 November 2026 to elect the 61st Parliament of Victoria. All 88 seats in the Legislative Assembly and all 40 seats in the Legislative Council will be up for election, presuming there are no new electorates added in a redistribution.