Geology applications of Fourier transform infrared spectroscopy

Last updated
An attenuated total reflectance (ATR)-FTIR spectrometer. SpectrumBX.jpg
An attenuated total reflectance (ATR)-FTIR spectrometer.

Fourier transform infrared spectroscopy (FTIR) is a spectroscopic technique that has been used for analyzing the fundamental molecular structure of geological samples in recent decades. As in other infrared spectroscopy, the molecules in the sample are excited to a higher energy state due to the absorption of infrared (IR) radiation emitted from the IR source in the instrument, which results in vibrations of molecular bonds. The intrinsic physicochemical property of each particular molecule determines its corresponding IR absorbance peak, and therefore can provide characteristic fingerprints of functional groups (e.g. C-H, O-H, C=O, etc.). [1]

Contents

In geosciences research, FTIR is applied extensively in the following applications:

These applications are discussed in details in the later sections. Most of the geology applications of FTIR focus on the mid-infrared range, which is approximately 4000 to 400 cm−1. [4]

Instrumentation

The basic components of a Michelson Interferometer: a coherent light source, a detector, a beam splitter, a stationary mirror and a movable mirror. FTIR Interferometer.png
The basic components of a Michelson Interferometer: a coherent light source, a detector, a beam splitter, a stationary mirror and a movable mirror.

The fundamental components of a Fourier transform spectrometer include a polychromatic light source and a Michelson Interferometer with a movable mirror. When light goes into the interferometer, it is separated into two beams. 50% of the light reaches the static mirror and the other half reaches the movable mirror. [1] [8] The two light beams reflect from the mirrors and combine as a single beam again at the beam splitter. The combined beam travels through the sample and is finally collected by the detector. The retardation (total path difference) of the light beams between the static mirror and the movable mirror results in interference patterns. [1] The IR absorption by the sample occurs at many frequencies and the resulting infereogram is composed of all frequencies except for those absorbed. A mathematical approach Fourier Transform converts the raw data into spectrum. [1]

Advantages

Sample characterization

Transmission FTIR, attenuated total reflectance (ATR)-FTIR, Diffuse reflectance infrared Fourier transform (DRIFT) spectroscopy and reflectance micro-FTIR are commonly used for sample analysis .

FTIR modeSample preparationSchematic diagram
Transmission FTIR
  • Transmission mode is the most widely used FTIR technique in geoscience due to its high analysis speed and cost-efficient characteristics. [4]
  • The sample, either a rock or a mineral, is cut into a block and polished on both sides until a thin (typically 300 to 15 µm) wafer is created. To ensure that enough light penetrates through the sample for analysis, the range of maximum thickness should be 0.5 to 1 mm [4] [9]
  • The sample is placed along the travel path of IR beam, in which the beam can penetrate through the sample and transmit to the detector. [4] [9]
Transmission FTIR Spectroscopy.png
ATR-FTIR
  • The IR beam interacts with the surface of the sample without penetrating into it. Therefore, sample thickness need not to be thin. [4] [10]
  • ATR-FTIR allows the functional group near the interface of the crystals to be analyzed when the IR radiation is totally internal reflected at the surface. [10]
  • The sample is in direct contact with an ATR crystal. As the IR beam reaches onto the ATR crystal, it extends beyond the crystal surface and protrudes into the sample at a shallow depth (0.5-5 µm). The sample absorbs some of the energy of the IR beam as the wave is internally reflected between the ATR crystal and the sample. The attenuated wave at the exit end is collected by the detector. [4] [10]
  • This technique has an advantage in collecting quality data in the presence of water, therefore it is used to examine the aqueous components sorption at crystal interfaces. [4]
ATR-FTIR Spectroscopy.png
DRIFT spectroscopy
  • Sample powder within KBr is generally used in DRIFT. The powdered specimen can simply be prepared by grinding and then mixed with the IR-transparent KBr powder in the sample cup. [4]
  • The IR beam undergoes mupltiple reflection, i.e. diffuse reflection, that scatter in between the surface of the sample particles in the sample cup. The diffuse radiation is then focused again on a mirror when they exit and the combined IR beam carries the bulk sample information to the detector. [11]
DRIFT Spectroscopy.png
Reflection-absorption FTIR
  • Sample is usually prepared as a thick block and is polished into a smooth surface. [4]
  • As the IR beam strikes the sample surface, some of the energy is absorbed by the top layer (<10 µm) of the bulk sample. The altered incident beam is then reflected and carry the composition information of the targeted surface area. A mathematical correction called the Kramers–Kronig correction is required for generating the final spectrum. [4] [11]
Reflectance-Absorbance FTIR Spectroscopy.png

Applications in geology

Volatiles diagnosis

Example of an FTIR spectrum. The absorbance of some of the molecular structures shown in the spectrum: Total water at 3450cm-1, molecular water at 1630cm-1, carbon dioxide at 2350cm-1 and carbonate molecule at 1430cm-1. FTIR spectrum.jpg
Example of an FTIR spectrum. The absorbance of some of the molecular structures shown in the spectrum: Total water at 3450cm-1, molecular water at 1630cm-1, carbon dioxide at 2350cm-1 and carbonate molecule at 1430cm-1.

The most commonly investigated volatiles are water and carbon dioxide as they are the primary volatiles to drive volcanic and magmatic processes. [4] The absorbance of total water and molecular water is approximately 3450 cm-1 and 1630 cm-1. [2] The peak height of the absorption bands for CO2 and CO32− are 2350 cm−1 and 1430 cm−1 respectively. The phases of volatiles also give different frequency of bond stretch and eventually produce a specific wavenumber. For example, the band of solid and liquid CO2 occurs in between 2336 and 2345 cm−1; and the CO2 gas phase shows two distinctive bands at 2338 cm−1 and 2361 cm−1. This is due to the energy difference under vibrational and rotational motion of gas molecules. [4]

The modified Beer-Lambert Law equation is commonly used in geoscience for converting the absorbance in the IR spectrum into the species concentration:

Where ω is wt. % of the species of interest within the sample; A is the absorbance of the species; M is the molar mass (in g mol−1); ϵ is molar absorptivity (in L mol−1 cm −1); l is sample thickness (in cm); ρ is density (in g mol−1) [4]

There are various applications of identifying the quantitative amount of volatiles by using spectroscopic technology. The following sections provide some of the examples: [4]

Hydrous components in nominally anhydrous minerals

Nominally anhydrous minerals (NAMs) are minerals with only trace to minor amounts of hydrous components. The hydrous material occurs only at crystal defects. NAMs chemical formulas are normally written without hydrogen. NAMs such as olivine and orthopyroxene account for a large proportion in the mantle volume. [12] Individual minerals may contain only a very low content of OH but their total weight can contribute significant as the H2O reservoir on Earth [13] and other terrestrial planets. [14] The low concentration of hydrous components (OH and H2O) can be analyzed with Fourier Transform spectrometer due to its high sensitivity. Water is thought to have significant role in affecting mantle rheology, either by hydrolytic weakening to the mineral structure or by lowering the partial melt temperature. [15] The presence of hydrous components within NAMs can therefore (1) provide information on the crystallization and melting environment in the initial mantle; (2) reconstruct the paleoenvironment of early terrestrial planet. [4]

Fluid and melt inclusions

Multiple melt inclusions in olivine crystal Melt inclusions 2.jpg
Multiple melt inclusions in olivine crystal

Inclusion refers to the small mineral crystals and foreign fluids within a crystal. Melt inclusions and fluid inclusions can provide physical and chemical information of the geological environment in which the melt or fluid are trapped within the crystal. Fluid inclusion refers to the bubble within a mineral trapping volatiles or microscopic minerals within it. For melt inclusions, it refers to the parent melt of the initial crystallization environment being held as melt parcel within a mineral. [4] The inclusions preserved original melt and therefore can provide the magmatic condition where the melt is near liquidus. Inclusions can be particularly useful in the petrological and volcanological studies. [3]

The size of inclusions is usually microscopic (μm) with a very low concentration of volatile species. [9] By coupling a synchrotron light source to the FTIR spectrometer, the diameter of the IR beam can be significantly reduced to as small as 3 µm. This allows a higher accuracy in detecting the targeted bubbles or melt parcels only without contamination from the surrounding host mineral. [3]

By incorporating the other parameters, (i.e. temperature, pressure and composition), obtained from micro thermometry, electron and ion microprobe analyzers, it is able to reconstruct the entrapment environment and further infer the magma genesis and crustal storage. The above approach of FTIR has successfully detect the occurrence of H2O and CO2 in numbers of studies nowaday, For examples, the water saturated inclusion in olivine phenocryst erupted at Stromboli (Sicily, Italy) in consequences of depressurization, [3] and the unexpected of occurrence of molecular CO2 in melts inclusion in Phlegraean Volcanic District (Southern Italy) revealed as the presence of a deep, CO2-rich, continuous degassing magma. [3]

Evaluate the explosive potential volcanic dome

Schematic diagram of Water concentration profile across a pumice-obsidian sample. The shape of the profile can be translate into a diffusion timescale. Schematic diagram of Water concentration profile.png
Schematic diagram of Water concentration profile across a pumice-obsidian sample. The shape of the profile can be translate into a diffusion timescale.

Vesiculation, i.e. the nucleation and growth of bubbles commonly initiates eruptions in volcanic domes. The evolution of vesiculation can be summarized in these steps: [16]

  1. The magma becomes progressively saturated with volatiles when water and carbon dioxide dissolves in it. Nucleation of bubbles start when then magma is supersaturated with these volatiles. [16]
  2. Bubbles continue to grow by diffusive transfer of water gases from the magma. Stresses buildup inside the volcanic dome. [16]
  3. The bubbles expand in consequence to the decompression of magma and explosions occur eventually. This terminates the vesiculation. [16]

In order to understand the eruption process and evaluate the explosive potential, FTIR spectromicroscopy is used to measure millimeter-scale variations in H2O on obsidian samples near the pumice outcrop. [16] The diffusive transfer of water from the magma host has already completed in the highly vesicular pumice which volatiles escapes during explosion. On the other hand, water diffusion has not yet completed in the glassy obsidian formed from cooling lava and therefore the evolution of volatiles diffusion is recorded within these samples. The H2O concentration in obsidian measured by FTIR across the samples increase away from the vesicular pumice boundary. [16] The shape of the curve in the water concentration profile represent a volatile-diffusion timescale. The vesiculation initiation and termination is thus recorded in the obsidian sample. The diffusion rate of H2O can be estimated based on the following 1D diffusion equation. [16] [17]

D(C, T, P): the Diffusivity of H2O in melt, which has an Arrhenian dependence on Temperature (T), Pressure (P) and H2O Content (C).

When generating the diffusion model with the diffusion equation, the temperature and pressure can be fixed to a high-temperature and low-pressure condition which resemble the lava dome eruption environment. [16] The maximum H2O content measured from FTIR spectrometer is substituted into the diffusion equation as the initial value that resembles a volatile supersaturated condition. The duration of the vesiculation event can be controlled by the decrease of water content across a distance in the sample as the volatiles escape into the bubbles. The more gradual change of the water content curve represents a longer vesiculation event. [16] Therefore, the explosive potential of volcanic dome can be estimated from the water content profile derived from the diffusive model. [16]

Establishing taxonomy of early life

For the large fossil with well-preserved morphology, paleontologists might be able to recognize it relatively easily with their distinctive anatomy. However, for microfossils that has simple morphology, compositional analysis by FTIR is an alternative way to better identify the biological affinities of these species. [4] [5] The highly sensitive FTIR spectrometer can be used to study microfossils which only have small amount of specimens available in nature. FTIR result can also assist the development of plant fossil chemotaxonomy. [4]

Aliphatic C-H stretching bands in the 2900 cm−1, aromatic C-Cring stretching band at 1600 cm−1, C=O bands at 1710 cm−1 are some of the common target functional groups examined by the paleontologists. CH3/CH2 is useful for distinguishing different groups of organism (e.g. Archea, bacteria and eucarya), or even the species among the same group (i.e. different plant species). [4]

Linkage between acritarchs and microfossil taxa

Acritarchs are microorganism characterized by their acid-resistant organic-walled morphology and they existed from Proterozoic to the present. There is no consensus on the common descent, the evolutionary history and the evolutionary relationship of acritarchs. [5] They share similarity to cells or organelles with different origins listed below:

  • Cysts of eukaryotes: [5] Eukaryotes are by definition organisms with cells that consists of a nucleus and other cellular organelles enclosed within a membrane. [18] The cysts is a dominant stage in many microeukaryotes such as bacterium, that consists of a strengthened wall to protect the cell under unfavorable environment. [17]
  • Prokaryotic sheath: the cell wall of the single-celled organism that lacks all the membrane-bounded organelles such as the nucleus; [19]
  • Algae and other vegetative parts of multicellular organisms; [5]
  • Crustacean egg cases. [20]

Acritarchs samples are collected from drill core in places where Proterozoic microfossils have been reported, e.g. Roper Group (1.5–1.4 Ga) and Tanana Formation (ca. 590–565 Ma) in Australia, Ruyang Group, China (around 1.4–1.3 Ga). [4] [5] Comparison of the chain length and presence of structure in modern eukaryotic microfossil and the acritarchs suggests possible affinities between some of the species. For example, the composition and structure of the Neoproterozoic acritarch Tanarium conoideum is consistent with algaenans, i.e. the resistant wall of green algae made up of long-chained methylenic-polymer that can withstand changing temperature and pressure throughout the geological history. [5] [21] Both of the FTIR spectra obtained from Tanarium conoideum and algaenans exhibit IR absorbance peaks at methylene CH2 bend (c. 1400 cm−1 and 2900 cm−1). [5]

Chemotaxonomy of plant fossils

The micro-structural analysis is a common way to complement with the conventional morphology taxonomy for plant fossils classification. [4] FTIR spectroscopy can provide insightful information in the microstructure for different plant taxa. Cuticles is a waxy protective layer that covers plant leaves and stems to prevent loss of water. Its constituted waxy polymers are generally well-preserved in plant fossil, which can be used for functional group analysis. [6] [7] For example, the well-preserved cuticle of cordaitales fossils, an extinct order of plant, found in Sydney, Stellarton and Bay St. George shows similar FTIR spectra. This result confirms the previous morphological-based studies that all these morphologic similar cordaitales are originated from one single taxon. [7]

Related Research Articles

<span class="mw-page-title-main">Infrared spectroscopy</span> Interaction of infrared radiation with matter

Infrared spectroscopy is the measurement of the interaction of infrared radiation with matter by absorption, emission, or reflection. It is used to study and identify chemical substances or functional groups in solid, liquid, or gaseous forms. It can be used to characterize new materials or identify and verify known and unknown samples. The method or technique of infrared spectroscopy is conducted with an instrument called an infrared spectrometer which produces an infrared spectrum. An IR spectrum can be visualized in a graph of infrared light absorbance on the vertical axis vs. frequency, wavenumber or wavelength on the horizontal axis. Typical units of wavenumber used in IR spectra are reciprocal centimeters, with the symbol cm−1. Units of IR wavelength are commonly given in micrometers, symbol μm, which are related to the wavenumber in a reciprocal way. A common laboratory instrument that uses this technique is a Fourier transform infrared (FTIR) spectrometer. Two-dimensional IR is also possible as discussed below.

Fourier-transform spectroscopy is a measurement technique whereby spectra are collected based on measurements of the coherence of a radiative source, using time-domain or space-domain measurements of the radiation, electromagnetic or not. It can be applied to a variety of types of spectroscopy including optical spectroscopy, infrared spectroscopy, nuclear magnetic resonance (NMR) and magnetic resonance spectroscopic imaging (MRSI), mass spectrometry and electron spin resonance spectroscopy.

<span class="mw-page-title-main">Acritarch</span> Microfossils

Acritarchs are organic microfossils, known from approximately 1800 million years ago to the present. The classification is a catch all term used to refer to any organic microfossils that cannot be assigned to other groups. Their diversity reflects major ecological events such as the appearance of predation and the Cambrian explosion.

<span class="mw-page-title-main">Microfossil</span> Fossil that requires the use of a microscope to see it

A microfossil is a fossil that is generally between 0.001 mm and 1 mm in size, the visual study of which requires the use of light or electron microscopy. A fossil which can be studied with the naked eye or low-powered magnification, such as a hand lens, is referred to as a macrofossil.

<span class="mw-page-title-main">Lunar water</span> Presence of water on the moon

Lunar water is water that is present on the Moon. Diffuse water molecules can persist at the Moon's sunlit surface, as discovered by NASA's SOFIA observatory in 2020. Gradually water vapor is decomposed by sunlight, leaving hydrogen and oxygen lost to outer space. Scientists have found water ice in the cold, permanently shadowed craters at the Moon's poles. Water molecules are also present in the extremely thin lunar atmosphere.

Photoacoustic spectroscopy is the measurement of the effect of absorbed electromagnetic energy on matter by means of acoustic detection. The discovery of the photoacoustic effect dates to 1880 when Alexander Graham Bell showed that thin discs emitted sound when exposed to a beam of sunlight that was rapidly interrupted with a rotating slotted disk. The absorbed energy from the light causes local heating, generating a thermal expansion which creates a pressure wave or sound. Later Bell showed that materials exposed to the non-visible portions of the solar spectrum can also produce sounds.

<span class="mw-page-title-main">Forensic chemistry</span> Forensic application of the study of chemistry

Forensic chemistry is the application of chemistry and its subfield, forensic toxicology, in a legal setting. A forensic chemist can assist in the identification of unknown materials found at a crime scene. Specialists in this field have a wide array of methods and instruments to help identify unknown substances. These include high-performance liquid chromatography, gas chromatography-mass spectrometry, atomic absorption spectroscopy, Fourier transform infrared spectroscopy, and thin layer chromatography. The range of different methods is important due to the destructive nature of some instruments and the number of possible unknown substances that can be found at a scene. Forensic chemists prefer using nondestructive methods first, to preserve evidence and to determine which destructive methods will produce the best results.

<span class="mw-page-title-main">Volcanic gas</span> Gases given off by active volcanoes

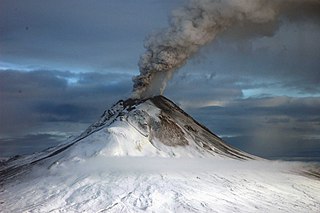
Volcanic gases are gases given off by active volcanoes. These include gases trapped in cavities (vesicles) in volcanic rocks, dissolved or dissociated gases in magma and lava, or gases emanating from lava, from volcanic craters or vents. Volcanic gases can also be emitted through groundwater heated by volcanic action.

<span class="mw-page-title-main">Attenuated total reflectance</span> Infrared spectroscopy sampling technique

Attenuated total reflection (ATR) is a sampling technique used in conjunction with infrared spectroscopy which enables samples to be examined directly in the solid or liquid state without further preparation.

Chemical imaging is the analytical capability to create a visual image of components distribution from simultaneous measurement of spectra and spatial, time information. Hyperspectral imaging measures contiguous spectral bands, as opposed to multispectral imaging which measures spaced spectral bands.

Vibrational circular dichroism (VCD) is a spectroscopic technique which detects differences in attenuation of left and right circularly polarized light passing through a sample. It is the extension of circular dichroism spectroscopy into the infrared and near infrared ranges.

<span class="mw-page-title-main">Evolved gas analysis</span>

Evolved gas analysis (EGA) is a method used to study the gas evolved from a heated sample that undergoes decomposition or desorption. It is either possible just to detect evolved gases using evolved gas detection (EGD) or to analyse explicitly which gases evolved using evolved gas analysis (EGA). Therefore different analytical methods can be employed such as mass spectrometry, Fourier transform spectroscopy, gas chromatography, or optical in-situ evolved gas analysis.

Photothermal microspectroscopy (PTMS), alternatively known as photothermal temperature fluctuation (PTTF), is derived from two parent instrumental techniques: infrared spectroscopy and atomic force microscopy (AFM). In one particular type of AFM, known as scanning thermal microscopy (SThM), the imaging probe is a sub-miniature temperature sensor, which may be a thermocouple or a resistance thermometer. This same type of detector is employed in a PTMS instrument, enabling it to provide AFM/SThM images: However, the chief additional use of PTMS is to yield infrared spectra from sample regions below a micrometer, as outlined below.

<span class="mw-page-title-main">Melt inclusion</span>

A melt inclusion is a small parcel or "blobs" of melt(s) that is entrapped by crystals growing in magma and eventually forming igneous rocks. In many respects it is analogous to a fluid inclusion within magmatic hydrothermal systems. Melt inclusions tend to be microscopic in size and can be analyzed for volatile contents that are used to interpret trapping pressures of the melt at depth.

<span class="mw-page-title-main">Fourier-transform infrared spectroscopy</span> Technique to analyze the infrared spectrum of matter

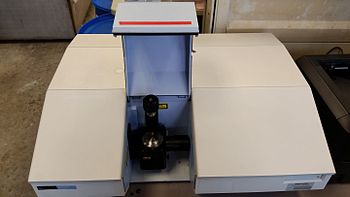
Fourier-transform infrared spectroscopy (FTIR) is a technique used to obtain an infrared spectrum of absorption or emission of a solid, liquid, or gas. An FTIR spectrometer simultaneously collects high-resolution spectral data over a wide spectral range. This confers a significant advantage over a dispersive spectrometer, which measures intensity over a narrow range of wavelengths at a time.

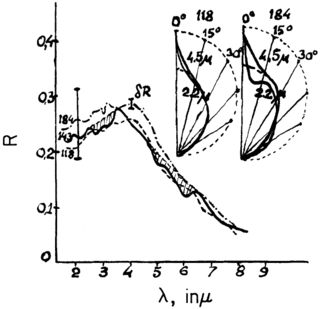
Magmatic water, also known as juvenile water, is an aqueous phase in equilibrium with minerals that have been dissolved by magma deep within the Earth's crust and is released to the atmosphere during a volcanic eruption. It plays a key role in assessing the crystallization of igneous rocks, particularly silicates, as well as the rheology and evolution of magma chambers. Magma is composed of minerals, crystals and volatiles in varying relative abundance. Magmatic differentiation varies significantly based on various factors, most notably the presence of water. An abundance of volatiles within magma chambers decreases viscosity and leads to the formation of minerals bearing halogens, including chloride and hydroxide groups. In addition, the relative abundance of volatiles varies within basaltic, andesitic, and rhyolitic magma chambers, leading to some volcanoes being exceedingly more explosive than others. Magmatic water is practically insoluble in silicate melts but has demonstrated the highest solubility within rhyolitic melts. An abundance of magmatic water has been shown to lead to high-grade deformation, altering the amount of δ18O and δ2H within host rocks.

The technique of vibrational analysis with scanning probe microscopy allows probing vibrational properties of materials at the submicrometer scale, and even of individual molecules. This is accomplished by integrating scanning probe microscopy (SPM) and vibrational spectroscopy. This combination allows for much higher spatial resolution than can be achieved with conventional Raman/FTIR instrumentation. The technique is also nondestructive, requires non-extensive sample preparation, and provides more contrast such as intensity contrast, polarization contrast and wavelength contrast, as well as providing specific chemical information and topography images simultaneously.

<span class="mw-page-title-main">Infrared Nanospectroscopy (AFM-IR)</span> Infrared microscopy technique

AFM-IR or infrared nanospectroscopy is one of a family of techniques that are derived from a combination of two parent instrumental techniques. AFM-IR combines the chemical analysis power of infrared spectroscopy and the high-spatial resolution of scanning probe microscopy (SPM). The term was first used to denote a method that combined a tuneable free electron laser with an atomic force microscope equipped with a sharp probe that measured the local absorption of infrared light by a sample with nanoscale spatial resolution.

<span class="mw-page-title-main">Nano-FTIR</span> Infrared microscopy technique

Nano-FTIR is a scanning probe technique that utilizes as a combination of two techniques: Fourier transform infrared spectroscopy (FTIR) and scattering-type scanning near-field optical microscopy (s-SNOM). As s-SNOM, nano-FTIR is based on atomic-force microscopy (AFM), where a sharp tip is illuminated by an external light source and the tip-scattered light is detected as a function of tip position. A typical nano-FTIR setup thus consists of an atomic force microscope, a broadband infrared light source used for tip illumination, and a Michelson interferometer acting as Fourier-transform spectrometer. In nano-FTIR, the sample stage is placed in one of the interferometer arms, which allows for recording both amplitude and phase of the detected light. Scanning the tip allows for performing hyperspectral imaging with nanoscale spatial resolution determined by the tip apex size. The use of broadband infrared sources enables the acquisition of continuous spectra, which is a distinctive feature of nano-FTIR compared to s-SNOM. Nano-FTIR is capable of performing infrared (IR) spectroscopy of materials in ultrasmall quantities and with nanoscale spatial resolution. The detection of a single molecular complex and the sensitivity to a single monolayer has been shown. Recording infrared spectra as a function of position can be used for nanoscale mapping of the sample chemical composition, performing a local ultrafast IR spectroscopy and analyzing the nanoscale intermolecular coupling, among others. A spatial resolution of 10 nm to 20 nm is routinely achieved.

Asteroidal water is water or water precursor deposits such as hydroxide (OH) that exist in asteroids. The "snow line" of the Solar System lies outside of the main asteroid belt, and the majority of water is expected in minor planets. Nevertheless, a significant amount of water is also found inside the snow line, including in near-earth objects (NEOs).

References

  1. 1 2 3 4 Åmand, L. E.; Tullin, C. J. (1997). The Theory Behind FTIR analysis. Göteborg, Sweden: Department of Energy Conversion Chalmers University of Technology. S2CID   16247962.
  2. 1 2 Lowenstern, J. B.; Pitcher, B. W. (2013). "Analysis of H2O in silicate glass using attenuated total reflectance (ATR) micro-FTIR spectroscopy". American Mineralogist. 98 (10): 1660. Bibcode:2013AmMin..98.1660L. doi:10.2138/am.2013.4466. S2CID   93410810.
  3. 1 2 3 4 5 Mormone, A.; Piochi, M.; Bellatreccia, F.; De Astis, G.; Moretti, R.; Ventura, G. Della; Cavallo, A.; Mangiacapra, A. (2011). "A CO2-rich magma source beneath the Phlegraean Volcanic District (Southern Italy): Evidence from a melt inclusion study". Chemical Geology. 287 (1–2): 66–80. Bibcode:2011ChGeo.287...66M. doi:10.1016/j.chemgeo.2011.05.019.
  4. 1 2 3 4 5 6 7 8 9 10 11 12 13 14 15 16 17 18 19 20 21 22 Chen, Y; Zou, C; Mastalerz, M; Hu, S; Gasaway, C; Tao, X (2015). "Applications of Micro-Fourier Transform Infrared Spectroscopy (FTIR) in the Geological Sciences—A Review". International Journal of Molecular Sciences. 16 (12): 30223–50. doi: 10.3390/ijms161226227 . PMC   4691169 . PMID   26694380.
  5. 1 2 3 4 5 6 7 8 Marshall, C; Javaux, E; Knoll, A; Walter, M (2005). "Combined micro-Fourier transform infrared (FTIR) spectroscopy and micro-Raman spectroscopy of Proterozoic acritarchs: a new approach to palaeobiology". Precambrian Research. 138 (3–4): 208. Bibcode:2005PreR..138..208M. doi:10.1016/j.precamres.2005.05.006.
  6. 1 2 Zodrow, Erwin L.; d'Angelo, José A.; Mastalerz, Maria; Keefe, Dale (2009). "Compression–cuticle relationship of seed ferns: Insights from liquid–solid states FTIR (Late Palaeozoic–Early Mesozoic, Canada–Spain–Argentina)". International Journal of Coal Geology. 79 (3): 61. doi:10.1016/j.coal.2009.06.001.
  7. 1 2 3 Zodrow, Erwin L; Mastalerz, Maria; Orem, William H; s̆Imůnek, Zbynĕk; Bashforth, Arden R (2000). "Functional groups and elemental analyses of cuticular morphotypes of Cordaites principalis (Germar) Geinitz, Carboniferous Maritimes Basin, Canada". International Journal of Coal Geology. 45: 1–19. doi:10.1016/S0166-5162(00)00018-5.
  8. 1 2 3 4 "Technical Note 50674: Advantages of a Fourier Transform Infrared Spectrometer" (PDF). Thermo Scientific. 2015.
  9. 1 2 3 Nieuwoudt, Michél K.; Simpson, Mark P.; Tobin, Mark; Puskar, Ljiljana (2014). "Synchrotron FTIR microscopy of synthetic and natural CO2–H2O fluid inclusions". Vibrational Spectroscopy. 75: 136–148. doi:10.1016/j.vibspec.2014.08.003.
  10. 1 2 3 Perkin Elmer Life and Analytical Sciences. (2005). "FT-IR Spectroscopy—Attenuated Total Reflectance (ATR)" (PDF). Perkin Elmer Life and Analytical Sciences. Archived from the original (PDF) on 2007-02-16. Retrieved 2016-11-17.
  11. 1 2 Thermo Fisher Scientific (2015). "FTIR Sample Handling Techniques". Thermo Fisher Scientific.
  12. Duffy, Thomas S.; Anderson, Don L. (1989). "Seismic velocities in mantle minerals and the mineralogy of the upper mantle" (PDF). Journal of Geophysical Research. 94 (B2): 1895. Bibcode:1989JGR....94.1895D. doi:10.1029/JB094iB02p01895. Archived from the original (PDF) on 2017-01-08.
  13. Bell, D.R.; Rossman, G.R. (1992) "Water in earth's mantle; the role of nominally anhydrous minerals". Science. 255: 1391-1397. doi:10.1126/science.255.5050.1391
  14. Hui, Hejiu; Peslier, Anne H.; Zhang, Youxue; Neal, Clive R. (2013). "Water in lunar anorthosites and evidence for a wet early Moon". Nature Geoscience. 6 (3): 177. Bibcode:2013NatGe...6..177H. doi:10.1038/ngeo1735.
  15. Green, David H.; Hibberson, William O.; Kovács, István; Rosenthal, Anja (2010). "Water and its influence on the lithosphere–asthenosphere boundary". Nature. 467 (7314): 448–51. Bibcode:2010Natur.467..448G. doi:10.1038/nature09369. PMID   20865000. S2CID   4393352.
  16. 1 2 3 4 5 6 7 8 9 10 Castro, Jonathan M.; Manga, Michael; Martin, Michael C. (2005). "Vesiculation rates of obsidian domes inferred from H2O concentration profiles". Geophysical Research Letters. 32 (21): L21307. Bibcode:2005GeoRL..3221307C. doi: 10.1029/2005GL024029 .
  17. 1 2 Zhang, Youxue; Behrens, Harald (2000). "H2O diffusion in rhyolitic melts and glasses" (PDF). Chemical Geology. 169 (1–2): 243–262. Bibcode:2000ChGeo.169..243Z. doi:10.1016/S0009-2541(99)00231-4.
  18. Nelson, David L.; Cox, Michael M. (2008). Lehninger principles of biochemistry. New York: W.H. Freeman. ISBN   978-0-7167-7108-1.
  19. Konstantinidis, K. T.; Tiedje, J. M. (2005). "Genomic insights that advance the species definition for prokaryotes". Proceedings of the National Academy of Sciences. 102 (7): 2567–2572. Bibcode:2005PNAS..102.2567K. doi: 10.1073/pnas.0409727102 . PMC   549018 . PMID   15701695.
  20. van Waveren, I. M. (1992). Morphology of probable planktonic crustacean eggs from the Holocene of the Banda Sea (Indonesia).
  21. Versteegh, Gerard J. M.; Blokker, Peter (2004). "Resistant macromolecules of extant and fossil microalgae". Phycological Research. 52 (4): 325. doi:10.1111/j.1440-183.2004.00361.x. S2CID   84939480.