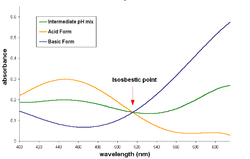
This article needs additional citations for verification .(March 2022) |
In spectroscopy, an isosbestic point is a specific wavelength, wavenumber or frequency at which the total absorbance of a sample does not change during a chemical reaction or a physical change of the sample. The word derives from two Greek words: "iso", meaning "equal", and "sbestos", meaning "extinguishable". [1]
An isosbestic point corresponds to an absorbance at a fixed wavelength that remains fixed [1] . The absorbance can be written as sum of absorbances of each species (Beer–Lambert law) where the concentration of species i, the optical path length. By definition, an isosbestic point can be interpreted as a fixed linear combination of species concentrations, i.e. an isobestic point is a conservation law. [2]
The IUPAC gold book [1] provides as an example the reaction which will lead to an isosbestic point if
Isosbestic points can be observed in a variety of techniques [3] (for instance UV-VIS, IR, NMR). In UV-VIS, an isosbestic point is often interpreted as implying the occurrence of a single linearly independent reaction.
The simplest examples of isosbestic points involve only two species, but isosbestic points do not imply the participation of only two species (e.g. the IUPAC example involves 5 species), which is a common misconception [1] .
When an isosbestic plot is constructed by the superposition of the absorption spectra of two species (whether by using molar absorptivity for the representation, or by using absorbance and keeping the same molar concentration for both species), the isosbestic point corresponds to a wavelength at which these spectra cross each other.
A pair of substances can have several isosbestic points in their spectra.
When a 1-to-1 (one mole of reactant gives one mole of product) chemical reaction (including equilibria) involves a pair of substances with an isosbestic point, the absorbance of the reaction mixture at this wavelength remains invariant, regardless of the extent of reaction (or the position of the chemical equilibrium). This occurs because the two substances absorb light of that specific wavelength to the same extent, and the analytical concentration remains constant.
For the reaction:
the analytical concentration is the same at any point in the reaction:
The absorbance of the reaction mixture (assuming it depends only on X and Y) is:
But at the isosbestic point, both molar absorptivities are the same:
Hence, the absorbance
does not depend on the extent of reaction (i.e., on the particular concentrations of X and Y)
The requirement for an isosbestic point to occur in this example is that the two species involved are related linearly by stoichiometry, such that the absorbance is invariant at a certain wavelength. It can now also readily be seen that one should not expect an isosbestic point for two successive reactions:
As we then would need there to be a wavelength at which all three spectra intersect simultaneously:
It would be very unlikely for three compounds to have extinction coefficients that are linearly related in this way by chance [4] .
In chemical kinetics, isosbestic points are used as reference points in the study of reaction rates, as the absorbance at those wavelengths remains constant throughout the whole reaction. [1]
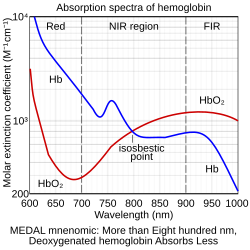
Isosbestic points are used in medicine in a laboratory technique called oximetry to determine hemoglobin concentration, regardless of its saturation. Oxyhaemoglobin and deoxyhaemoglobin have (not exclusively) isosbestic points at 586 nm and near 808 nm.
Isosbestic points are also used in clinical chemistry, as a quality assurance method, to verify the accuracy in the wavelength of a spectrophotometer. This is done by measuring the spectra of a standard solution at two different pH conditions (above and below the pKa of the substance). The standards used include potassium dichromate (isosbestic points at 339 and 445 nm), bromothymol blue (325 and 498 nm) and congo red (541 nm). The wavelength of the isosbestic point determined does not depend on the concentration of the substance used, and so it becomes a very reliable reference.
One example of the use of isosbestic points in organic synthesis is seen in the photochemical A/D-corrin cycloisomerization ring closure reaction, which was the key step in the Eschenmoser / ETH Zürich vitamin B12 total synthesis. [5] [6] The isosbestic points provide proof for a direct conversion of the seco-corrin complex to the metal-free corrin ligand without intermediary or side products (within the detection limits of UV/VIS spectroscopy). [5]
The Beer–Bouguer–Lambert (BBL) extinction law is an empirical relationship describing the attenuation in intensity of a radiation beam passing through a macroscopically homogenous medium with which it interacts. Formally, it states that the intensity of radiation decays exponentially in the absorbance of the medium, and that said absorbance is proportional to the length of beam passing through the medium, the concentration of interacting matter along that path, and a constant representing said matter's propensity to interact.
Circular dichroism (CD) is dichroism involving circularly polarized light, i.e., the differential absorption of left- and right-handed light. Left-hand circular (LHC) and right-hand circular (RHC) polarized light represent two possible spin angular momentum states for a photon, and so circular dichroism is also referred to as dichroism for spin angular momentum. This phenomenon was discovered by Jean-Baptiste Biot, Augustin Fresnel, and Aimé Cotton in the first half of the 19th century. Circular dichroism and circular birefringence are manifestations of optical activity. It is exhibited in the absorption bands of optically active chiral molecules. CD spectroscopy has a wide range of applications in many different fields. Most notably, UV CD is used to investigate the secondary structure of proteins. UV/Vis CD is used to investigate charge-transfer transitions. Near-infrared CD is used to investigate geometric and electronic structure by probing metal d→d transitions. Vibrational circular dichroism, which uses light from the infrared energy region, is used for structural studies of small organic molecules, and most recently proteins and DNA.
In mathematical optimization, the method of Lagrange multipliers is a strategy for finding the local maxima and minima of a function subject to equation constraints. It is named after the mathematician Joseph-Louis Lagrange.
Thermal radiation is electromagnetic radiation emitted by the thermal motion of particles in matter. All matter with a temperature greater than absolute zero emits thermal radiation. The emission of energy arises from a combination of electronic, molecular, and lattice oscillations in a material. Kinetic energy is converted to electromagnetism due to charge-acceleration or dipole oscillation. At room temperature, most of the emission is in the infrared (IR) spectrum, though above around 525 °C (977 °F) enough of it becomes visible for the matter to visibly glow. This visible glow is called incandescence. Thermal radiation is one of the fundamental mechanisms of heat transfer, along with conduction and convection.
In physics, Planck's law describes the spectral density of electromagnetic radiation emitted by a black body in thermal equilibrium at a given temperature T, when there is no net flow of matter or energy between the body and its environment.
Absorbance is defined as "the logarithm of the ratio of incident to transmitted radiant power through a sample ". Alternatively, for samples which scatter light, absorbance may be defined as "the negative logarithm of one minus absorptance, as measured on a uniform sample". The term is used in many technical areas to quantify the results of an experimental measurement. While the term has its origin in quantifying the absorption of light, it is often entangled with quantification of light which is "lost" to a detector system through other mechanisms. What these uses of the term tend to have in common is that they refer to a logarithm of the ratio of a quantity of light incident on a sample or material to that which is detected after the light has interacted with the sample.
In optical physics, transmittance of the surface of a material is its effectiveness in transmitting radiant energy. It is the fraction of incident electromagnetic power that is transmitted through a sample, in contrast to the transmission coefficient, which is the ratio of the transmitted to incident electric field.
In optics, the Airy disk and Airy pattern are descriptions of the best-focused spot of light that a perfect lens with a circular aperture can make, limited by the diffraction of light. The Airy disk is of importance in physics, optics, and astronomy.
In particle physics, the Klein–Nishina formula gives the differential cross section of photons scattered from a single free electron, calculated in the lowest order of quantum electrodynamics. It was first derived in 1928 by Oskar Klein and Yoshio Nishina, constituting one of the first successful applications of the Dirac equation. The formula describes both the Thomson scattering of low energy photons and the Compton scattering of high energy photons, showing that the total cross section and expected deflection angle decrease with increasing photon energy.
The spectrum of a linear operator that operates on a Banach space is a fundamental concept of functional analysis. The spectrum consists of all scalars such that the operator does not have a bounded inverse on . The spectrum has a standard decomposition into three parts:
Photosynthetically active radiation (PAR) designates the spectral range of solar radiation from 400 to 700 nanometers that photosynthetic organisms are able to use in the process of photosynthesis. This spectral region corresponds more or less with the range of light visible to the human eye. Photons at shorter wavelengths tend to be so energetic that they can be damaging to cells and tissues, but are mostly filtered out by the ozone layer in the stratosphere. Photons at longer wavelengths do not carry enough energy to allow photosynthesis to take place.
In quantum field theory and statistical mechanics, loop integrals are the integrals which appear when evaluating the Feynman diagrams with one or more loops by integrating over the internal momenta. These integrals are used to determine counterterms, which in turn allow evaluation of the beta function, which encodes the dependence of coupling for an interaction on an energy scale .
In mathematics, the pseudospectrum of an operator is a set containing the spectrum of the operator and the numbers that are "almost" eigenvalues. Knowledge of the pseudospectrum can be particularly useful for understanding non-normal operators and their eigenfunctions.
In the mathematical theory of bifurcations, a Hopfbifurcation is a critical point where, as a parameter changes, a system's stability switches and a periodic solution arises. More accurately, it is a local bifurcation in which a fixed point of a dynamical system loses stability, as a pair of complex conjugate eigenvalues—of the linearization around the fixed point—crosses the complex plane imaginary axis as a parameter crosses a threshold value. Under reasonably generic assumptions about the dynamical system, the fixed point becomes a small-amplitude limit cycle as the parameter changes.
In mathematics and physics, the Kadomtsev–Petviashvili equation is a partial differential equation to describe nonlinear wave motion. Named after Boris Borisovich Kadomtsev and Vladimir Iosifovich Petviashvili, the KP equation is usually written as where . The above form shows that the KP equation is a generalization to two spatial dimensions, x and y, of the one-dimensional Korteweg–de Vries (KdV) equation. To be physically meaningful, the wave propagation direction has to be not-too-far from the x direction, i.e. with only slow variations of solutions in the y direction.
Equilibrium constants are determined in order to quantify chemical equilibria. When an equilibrium constant K is expressed as a concentration quotient,
A locally decodable code (LDC) is an error-correcting code that allows a single bit of the original message to be decoded with high probability by only examining a small number of bits of a possibly corrupted codeword. This property could be useful, say, in a context where information is being transmitted over a noisy channel, and only a small subset of the data is required at a particular time and there is no need to decode the entire message at once. Locally decodable codes are not a subset of locally testable codes, though there is some overlap between the two.
The near-infrared (NIR) window defines the range of wavelengths from 650 to 1350 nanometre (nm) where light has its maximum depth of penetration in tissue. Within the NIR window, scattering is the most dominant light-tissue interaction, and therefore the propagating light becomes diffused rapidly. Since scattering increases the distance travelled by photons within tissue, the probability of photon absorption also increases. Because scattering has weak dependence on wavelength, the NIR window is primarily limited by the light absorption of blood at short wavelengths and water at long wavelengths. The technique using this window is called NIRS. Medical imaging techniques such as fluorescence image-guided surgery often make use of the NIR window to detect deep structures.
In chemistry, the molar absorption coefficient or molar attenuation coefficient is a measurement of how strongly a chemical species absorbs, and thereby attenuates, light at a given wavelength. It is an intrinsic property of the species. The SI unit of molar absorption coefficient is the square metre per mole, but in practice, quantities are usually expressed in terms of M−1⋅cm−1 or L⋅mol−1⋅cm−1. In older literature, the cm2/mol is sometimes used; 1 M−1⋅cm−1 equals 1000 cm2/mol. The molar absorption coefficient is also known as the molar extinction coefficient and molar absorptivity, but the use of these alternative terms has been discouraged by the IUPAC.
There is a strong scientific consensus that greenhouse effect due to carbon dioxide is a main driver of climate change. Following is an illustrative model meant for a pedagogical purpose, showing the main physical determinants of the effect.