Laholm Municipality

Last updated
Laholm Municipality
Laholms kommun
Laholms stadshus och bibliotek.jpg
Laholm town hall
Laholm vapen.svg
Laholm CMYK.jpg
Laholm Municipality in Halland County.png
Coordinates: 56°31′N13°02′E / 56.517°N 13.033°E / 56.517; 13.033
Country Sweden
County Halland County
Seat Laholm
Area
[1]
  Total
963.38 km2 (371.96 sq mi)
  Land882.96 km2 (340.91 sq mi)
  Water80.42 km2 (31.05 sq mi)
 Area as of 1 January 2014.
Population
 (31 December 2024) [2]
  Total
26,595
  Density28/km2 (71/sq mi)
Time zone UTC+1 (CET)
  Summer (DST) UTC+2 (CEST)
ISO 3166 code SE
Province Halland
Municipal code 1381
Website www.laholm.se

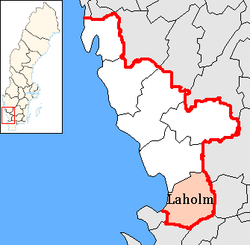
Laholm Municipality (Swedish : Laholms kommun) is a municipality in Halland County in southwest Sweden. The seat is located in Laholm.

Contents

The amalgamation process during the local government reform in the 1970s took place in two steps. In 1971 the City of Laholm merged with two rural municipalities forming the unitary municipality and three years later four more units were added.

Localities

There are 14 urban areas (also called a Tätort or locality) in Laholm Municipality.

In the table the localities are listed according to the size of the population as of December 31, 2010. [3] The municipal seat is in bold characters.

#LocalityPopulation
1 Laholm 6,150
2 Mellbystrand 1,619
3 Veinge 1,190
4 Knäred 1,088
5 Våxtorp 970
6 Lilla Tjärby 914
7 Vallberga 657
8 Genevad 565
9 Skummeslövsstrand 491
10 Skottorp 475
11 Ränneslöv 413
12 Hishult 332
13 Ysby 260
14 Hasslöv 228

Demographics

This is a demographic table based on Laholm Municipality's electoral districts in the 2022 Swedish general election sourced from SVT's election platform, in turn taken from SCB official statistics. [4]

In total there were 26,276 residents, including 20,080 Swedish citizens of voting age. [4] 38.3% voted for the left coalition and 60.6% for the right coalition. Indicators are in percentage points except population totals and income.

Elections

Below are the results listed since the 1973 municipal reform. Between 1988 and 1998 the Sweden Democrats' results were not published by the SCB due to the party's small size nationwide. "Turnout" denotes the percentage of the electorate casting a ballot, but "Votes" only applies to valid ballots cast.

Riksdag

YearTurnoutVotes V S MP C L KD M SD ND
1973 [5] 91.912,7141.227.40.054.15.00.511.50.00.0
1976 [6] 92.513,7921.226.80.051.17.20.513.20.00.0
1979 [7] 91.514,1031.927.90.041.57.70.520.20.00.0
1982 [8] 91.614,2702.130.21.337.44.31.223.20.00.0
1985 [9] 89.614,1081.931.11.731.011.40.022.80.00.0
1988 [10] 85.913,6662.532.25.630.09.41.918.30.00.0
1991 [11] 86.114,2031.927.13.422.16.56.622.80.08.6
1994 [12] 85.914,4443.535.15.321.34.43.623.80.01.8
1998 [13] 81.113,5447.128.74.113.32.913.723.40.00.0
2002 [14] 79.013,4044.732.93.516.310.211.416.61.20.0
2006 [15] 81.414,1803.728.73.415.95.56.427.96.10.0
2010 [16] 84.015,1353.225.34.612.95.74.733.48.70.0
2014 [17] 86.015,6613.027.05.111.33.93.924.818.30.0

Blocs

This lists the relative strength of the socialist and centre-right blocs since 1973, but parties not elected to the Riksdag are inserted as "other", including the Sweden Democrats results from 1988 to 2006, but also the Christian Democrats pre-1991 and the Greens in 1982, 1985 and 1991. The sources are identical to the table above. The coalition or government mandate marked in bold formed the government after the election. New Democracy got elected in 1991 but are still listed as "other" due to the short lifespan of the party. "Elected" is the total number of percentage points from the municipality that went to parties who were elected to the Riksdag.

YearTurnoutVotesLeftRight SD OtherElected
1973 91.912,71428.670.60.00.899.2
1976 92.513,79228.071.50.00.599.5
1979 91.514,10329.869.40.00.899.2
1982 91.614,27032.364.90.02.997.1
1985 89.614,10833.065.20.01.898.2
1988 85.913,66640.357.70.02.098.0
1991 86.114,20329.058.00.013.095.6
1994 85.914,44443.953.10.03.097.0
1998 81.113,54439.953.30.06.893.2
2002 79.013,40441.154.50.04.495.6
2006 81.414,18035.855.70.08.591.5
2010 84.015,13533.156.78.71.598.5
2014 86.015,66135.143.918.32.797.3

Pictures

References

  1. "Statistiska centralbyrån, Kommunarealer den 1 januari 2014" (in Swedish). Statistics Sweden. 2014-01-01. Archived from the original (Microsoft Excel) on 2016-09-27. Retrieved 2014-04-18.
  2. "Folkmängd och befolkningsförändringar - Kvartal 4, 2024" (in Swedish). Statistics Sweden. 21 February 2025. Retrieved 22 February 2025.
  3. "Statistikdatabasen". www.statistikdatabasen.scb.se. Retrieved 2016-05-28.
  4. 1 2 3 "Valresultat 2022 för Laholm i riksdagsvalet" (in Swedish). SVT. 11 September 2022. Retrieved 21 January 2024.
  5. "Riksdagsvalet 1973 (page 164)" (PDF) (in Swedish). SCB. Retrieved 24 August 2017.
  6. "Riksdagsvalet 1976 (page 158)" (PDF) (in Swedish). SCB. Retrieved 24 August 2017.
  7. "Riksdagsvalet 1979 (page 183)" (PDF) (in Swedish). SCB. Retrieved 24 August 2017.
  8. "Riksdagsvalet 1982 (page 183)" (PDF) (in Swedish). SCB. Retrieved 24 August 2017.
  9. "Riksdagsvalet 1985 (page 185" (PDF) (in Swedish). SCB. Retrieved 24 August 2017.
  10. "Riksdagsvalet 1988 (page 166)" (PDF) (in Swedish). SCB. Retrieved 24 August 2017.
  11. "Riksdagsvalet 1991 (page 26)" (PDF) (in Swedish). SCB. Retrieved 24 August 2017.
  12. "Riksdagsvalet 1994 (page 41)" (PDF) (in Swedish). SCB. Retrieved 24 August 2017.
  13. "Riksdagsvalet 1998 (page 37)" (PDF) (in Swedish). SCB. Retrieved 24 August 2017.
  14. "Valresultat Riksdag Laholms kommun 2002" (in Swedish). Valmyndigheten. Retrieved 24 August 2017.
  15. "Valresultat Riksdag Laholms kommun 2006" (in Swedish). Valmyndigheten. Retrieved 25 August 2017.
  16. "Valresultat Riksdag Laholms kommun 2010" (in Swedish). Valmyndigheten. Retrieved 25 August 2017.
  17. "Valresultat Riksdag Laholms kommun 2014" (in Swedish). Valmyndigheten. Retrieved 25 August 2017.