Las Palmas II | |
|---|---|
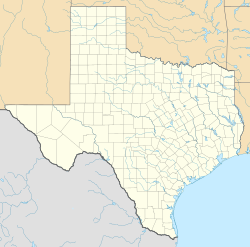 Las Palmas II Location within the state of Texas | |
| Coordinates: 26°12′12″N97°44′23″W / 26.20333°N 97.73972°W | |
| Country | United States |
| State | Texas |
| County | Cameron |
| Area | |
• Total | 0.31 sq mi (0.79 km2) |
| • Land | 0.30 sq mi (0.78 km2) |
| • Water | 0.0039 sq mi (0.01 km2) |
| Elevation | 45 ft (14 m) |
| Population (2020) | |
• Total | 891 |
| • Density | 3,000/sq mi (1,100/km2) |
| Time zone | UTC-6 (Central (CST)) |
| • Summer (DST) | UTC-5 (CDT) |
| FIPS code | 48-41580 [1] |
Las Palmas II is a census-designated place (CDP) in Cameron County, in the U.S. state of Texas. [2] (The "II" distinguishes the CDP from Las Palmas, a CDP in Zapata County.) The population was 1,605 at the 2010 census. [1] Prior to the 2010 census, the community was part of the Las Palmas-Juarez CDP. It is part of the Brownsville – Harlingen Metropolitan Statistical Area.
