Lubusz and West Pomeranian (European Parliament constituency)

Last updated

Lubusz and West Pomeranian
European Parliament constituency
EP-constituency-PL-13.svg
Location among the current constituencies
European Parliament constituencies Poland (13).png
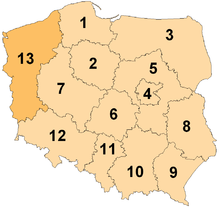
13th constituency in Poland
Member state Poland
Created 2004
MEPs 2 (since 2024, 2004-2009)
4 (2019-2024, 2009-2014)
3 (2014-2019)
Sources

Lubusz and West Pomeranian (Polish : lubuskie i zachodniopomorskie) is a constituency represented in the European Parliament. The constituency is composed of Lubusz and West Pomeranian Voivodeships.

Contents

Nomenclature

The relevant Polish legislation ("The Act of 23 January 2004 on Elections to the European Parliament" [1] ) establishing the constituencies does not give the constituencies formal names. Instead, each constituency has a number, territorial description, and location of the Constituency Electoral Commission. The 2004 Polish National Election Commission [2] and the 2004 European Parliament Election website [3] uses the territorial description when referring to the constituency, not the electoral commission location.

Members of the European Parliament

ElectionMEP
(party)
MEP
(party)
MEP
(party)
MEP
(party)
2004 Zdzisław Chmielewski
(PO)
Bogusław Liberadzki
(SLD-UP)
(L)
2 seats
2004-2009
2009 Sławomir Nitras
(PO)
Marek Gróbarczyk
(PiS)
Artur Zasada
(PO)
2014 Dariusz Rosati
(PO)
3 seats
2014-2019
2015 Czesław Hoc
(PiS)
2019 Bartosz Arłukowicz
(KO)
Joachim Brudziński
(PiS)
Elżbieta Rafalska
(PiS)
2023 Witold Pahl
(KO)
2024 Bartosz Arłukowicz
(KO)
2 seats
since 2024
2 seats
since 2024

Election results

2004

2004 European Parliament election
Electoral committee Votes%Seats
Civic Platform 96,85825.971
Self-Defence of the Republic of Poland 49,87613.38
League of Polish Families 45,06412.08
Law and Justice 44,23611.86
Democratic Left Alliance – Labour Union 43,32811.621
Social Democracy of Poland 23,6516.34
Freedom Union 22,2355.96
Polish People's Party 13,2173.54
Real Politics Union 6,3671.71
Democratic Left Party 5,5131.48
Konfederacja Ruch Obrony Bezrobotnych 5,1031.37
National Electoral Committee 5,0561.36
Initiative for Poland 3,9051.05
KPEiRPLD 3,8191.02
All-Poland Civic Coalition 2,6450.71
Polish Labour Party 2,0220.54
Total372,895100.002
Valid votes372,89597.01
Invalid/blank votes11,5102.99
Total votes384,405100.00
Registered voters/turnout2,128,79818.06
Source: PKW

2009

2009 European Parliament election
Electoral committee Votes%Seats
Civic Platform 203,03845.882
Law and Justice 89,60520.251
Democratic Left Alliance – Labour Union 89,47120.221
Polish People's Party 22,2905.04
Libertas Poland 8,1121.83
Self-Defence of the Republic of Poland 7,7691.76
Agreement for the Future – CenterLeft 6,2691.42
Right Wing of the Republic 5,8441.32
Real Politics Union 5,6091.27
Polish Labour Party 4,5531.03
Total442,560100.004
Valid votes442,56097.94
Invalid/blank votes9,3012.06
Total votes451,861100.00
Registered voters/turnout2,168,66720.84
Source: National Electoral Commission [4]

2014

2014 European Parliament election
Electoral committee Votes%Seats
Civic Platform 159,57937.491
Law and Justice 108,97225.601
Democratic Left Alliance – Labour Union 63,34714.881
Congress of the New Right 29,3536.90
Polish People's Party 21,8085.12
Europa PlusYour Movement 12,9143.03
Poland Together 10,3472.43
United Poland 9,7702.30
National Movement 5,5171.30
The Greens 4,1010.96
Total425,708100.003
Valid votes425,70896.50
Invalid/blank votes15,4483.50
Total votes441,156100.00
Registered voters/turnout2,160,78620.42
Source: National Electoral Commission [5]

2019

2019 European Parliament election
Electoral committee Votes%Seats
European Coalition 419,81947.762
Law and Justice 323,92936.852
Spring 65,5567.46
Confederation 34,0713.88
Kukiz'15 25,9412.95
Lewica Razem 9,7891.11
Total879,105100.004
Valid votes879,10599.19
Invalid/blank votes7,1770.81
Total votes886,282100.00
Registered voters/turnout2,105,34242.10
Source: National Electoral Commission [6] [7]

2024

2024 European Parliament election
Electoral committee Votes%Seats
Civic Coalition 337,82044.491
Law and Justice 226,08629.771
The Left 71,9169.47
Confederation 70,1389.24
Third Way 44,1905.82
Bezpartyjni Samorządowcy 7,2750.96
PolExit 1,9480.26
Total759,373100.002
Valid votes759,37399.33
Invalid/blank votes5,1480.67
Total votes764,521100.00
Registered voters/turnout2,018,55437.87
Source: National Electoral Commission [8]

References

  1. The Act of 23 January 2004 on Elections to the European Parliament Archived 16 July 2011 at the Wayback Machine
  2. Polish National Election Commission 2004
  3. European Parliament Election website 2004
  4. "Voting Results - Gorzów Wielkopolski, okr. 13". pkw.gov.pl. National Electoral Commission . Retrieved 25 December 2023.
  5. "Wyniki głosowania w podziale na komitety wyborcze". pkw.gov.pl. National Electoral Commission. Retrieved 25 December 2023.
  6. "Voting results - Constituency no. 13 [Gorzów Wielkopolski]". pkw.gov.pl. National Electoral Commission. Retrieved 16 December 2023.
  7. "Turnout - Constituency no. 13 [Gorzów Wielkopolski]". pkw.gov.pl. National Electoral Commission. Retrieved 16 December 2023.
  8. "Voting results - Constituency no. 13 [Gorzów Wielkopolski]". pkw.gov.pl. National Electoral Commission. Retrieved 2 March 2025.