| Mannargudi | |
|---|---|
| Constituency No. 167 for the Tamil Nadu Legislative Assembly | |
 | |
| Constituency details | |
| Country | India |
| Region | South India |
| State | Tamil Nadu |
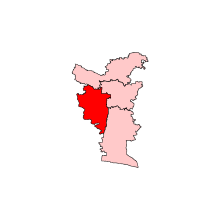
| District | Tiruvarur |
| Lok Sabha constituency | Thanjavur |
| Established | 1951 |
| Total electors | 2,60,042 [1] |
| Reservation | None |
| Member of Legislative Assembly | |
| 16th Tamil Nadu Legislative Assembly | |
| Incumbent | |
| Party | DMK |
| Elected year | 2021 |
Mannargudi is a legislative assembly constituency in Thiruvarur district in the Indian state of Tamil Nadu. [2] It is one of the 234 State Legislative Assembly Constituencies in Tamil Nadu, in India.
Contents
- Members of Legislative Assembly
- Madras State
- Tamil Nadu
- Election results
- 2021
- 2016
- 2011
- 2006
- 2001
- 1996
- 1991
- 1989
- 1984
- 1980
- 1977
- 1971
- 1967
- 1962
- 1957
- 1952
- References
Dr. T. R. B. Rajaa is the current MLA from Mannargudi, having been elected three times consecutively.
Elections and winners from this constituency are listed below.