South Australian state election, 5 April 1924 [1] Contents | ||||||
---|---|---|---|---|---|---|
Enrolled voters | 289,843 | |||||
Votes cast | 161,165 | Turnout | 62.71% | -1.06% | ||
Informal votes | 1,774 | Informal | N/A | |||
Summary of votes by party | ||||||
Party | Primary votes | % | Swing | Seats | Change | |
Labor | 192,256 | 48.35% | +3.73% | 27 | + 11 | |
Liberal Federation | 165,802 | 41.70% | +6.80% | 17 | - 8 | |
Country | 35,551 | 8.94% | +4.85% | 2 | - 2 | |
Protestant Labor | 10,560 | 2.08% | +2.08% | 1 | + 1 | |
Single Tax League | 1,923 | 0.40% | –0.20% | 0 | ± 0 | |
Independent | 20,720 | 5.10% | +4.60% | 1 | + 1 | |
Total | 507,320 | 46 |
This is a list of House of Assembly results for the 1924 South Australian state election. Each district elected multiple members.
Every voter would receive a ballot paper where they would cast 2 or 3 votes for different candidates. In electorates that were not unopposed, the 2 or 3 candidates with the most votes would be elected.
Party | Candidate | Votes | % | ±% | |
---|---|---|---|---|---|
Labor | John Gunn (elected) | 7,013 | 31.2 | +0.1 | |
Labor | Bill Denny (elected) | 6,786 | 30.2 | -0.3 | |
Labor | Bert Edwards (elected) | 6,653 | 29.6 | +1.4 | |
Liberal Federation | Agnes Goode | 1,526 | 6.8 | +6.8 | |
Independent | Joshua Pedlar | 471 | 2.1 | +2.1 | |
Total formal votes | 22,449 8,288 ballots | 98.0 | −0.1 | ||
Informal votes | 167 | 2.0 | +0.1 | ||
Turnout | 8,455 | 50.7 | −0.6 | ||
Party total votes | |||||
Labor | 20,452 | 91.1 | +1.3 | ||
Liberal Federation | 1,526 | 6.8 | +6.8 | ||
Independent | 471 | 2.1 | +2.1 |
Party | Candidate | Votes | % | ±% | |
---|---|---|---|---|---|
Country | Malcolm McIntosh (elected) | 4,929 | 38.2 | +19.5 | |
Country | Frederick McMillan (elected) | 4,822 | 37.4 | +18.8 | |
Liberal Federation | P J Edwards | 1,644 | 12.8 | +12.8 | |
Liberal Federation | F S Wyllie | 1,498 | 11.6 | +11.6 | |
Total formal votes | 12,893 6,473 ballots | 99.4 | +1.3 | ||
Informal votes | 109 | 0.6 | −1.3 | ||
Turnout | 6,510 | 53.3 | −3.0 | ||
Party total votes | |||||
Country | 9,751 | 75.6 | +38.3 | ||
Liberal Federation | 3,142 | 24.4 | -11.8 |
Party | Candidate | Votes | % | ±% | |
---|---|---|---|---|---|
Liberal Federation | Percy Heggaton (elected) | 3,719 | 18.7 | +18.7 | |
Liberal Federation | Herbert Hudd (elected) | 3,671 | 18.5 | -8.3 | |
Liberal Federation | George Laffer (elected) | 3,586 | 18.1 | -9.3 | |
Labor | Albert Davies | 1,914 | 9.6 | +9.6 | |
Labor | Harold Pearce | 1,866 | 9.4 | +9.4 | |
Labor | Harry Newell | 1,841 | 9.3 | +9.3 | |
Country | Frederick Ayers | 1,181 | 6.0 | +6.0 | |
Country | James Cheriton | 1,046 | 5.3 | +5.3 | |
Country | Walter Furler | 1,024 | 5.2 | -2.4 | |
Total formal votes | 19,848 6,743 ballots | 99.3 | +0.5 | ||
Informal votes | 46 | 0.7 | −0.5 | ||
Turnout | 6,789 | 54.6 | +2.7 | ||
Party total votes | |||||
Liberal Federation | 10,976 | 55.3 | -26.6 | ||
Labor | 5,621 | 28.3 | +17.7 | ||
Country | 3,251 | 16.4 | +8.8 |
Party | Candidate | Votes | % | ±% | |
---|---|---|---|---|---|
Labor | George Cooke (elected) | 4,015 | 16.3 | +1.3 | |
Liberal Federation | William Hague (elected) | 4,007 | 16.3 | -2.4 | |
Labor | Leonard Hopkins (elected) | 3,833 | 15.6 | +1.7 | |
Liberal Federation | Henry Crosby | 3,776 | 15.3 | -3.0 | |
Liberal Federation | Richard Butler | 3,574 | 14.5 | -2.3 | |
Labor | Tom Howard | 3,407 | 13.8 | +13.8 | |
Independent | Herbert Basedow | 2,017 | 8.2 | +8.2 | |
Total formal votes | 24,629 8,497 ballots | 98.5 | −0.5 | ||
Informal votes | 133 | 1.5 | +0.5 | ||
Turnout | 8,630 | 70.4 | −4.0 | ||
Party total votes | |||||
Liberal Federation | 11,357 | 46.1 | -7.7 | ||
Labor | 11,255 | 45.7 | +3.8 | ||
Independent | Herbert Basedow | 2,017 | 8.2 | +8.2 |
Party | Candidate | Votes | % | ±% | |
---|---|---|---|---|---|
Labor | Mick O'Halloran (elected) | 4,246 | 16.0 | +1.1 | |
Labor | Sydney McHugh (elected) | 3,972 | 15.0 | +15.0 | |
Labor | Albert Hawke (elected) | 3,915 | 14.8 | +14.8 | |
Liberal Federation | George Jenkins | 3,334 | 12.6 | -3.6 | |
Liberal Federation | Samuel Dickson | 3,313 | 12.5 | -2.8 | |
Liberal Federation | Francis Jettner | 2,900 | 10.9 | +10.9 | |
Country | Thomas Hawke | 1,831 | 6.9 | -9.7 | |
Country | Archibald McDonald | 1,676 | 6.3 | +6.3 | |
Country | Reginald Carter | 1,359 | 5.1 | +5.1 | |
Total formal votes | 26,546 8,964 ballots | 98.0 | −0.6 | ||
Informal votes | 185 | 2.0 | +0.6 | ||
Turnout | 9,149 | 69.0 | +0.1 | ||
Party total votes | |||||
Labor | 12,133 | 45.8 | +2.6 | ||
Liberal Federation | 9,547 | 36.0 | +4.5 | ||
Country | 4,866 | 18.3 | +1.7 |
Party | Candidate | Votes | % | ±% | |
---|---|---|---|---|---|
Labor | Leslie Hunkin (elected) | 10,760 | 18.1 | +5.3 | |
Labor | Harry Kneebone (elected) | 10,173 | 17.1 | +17.1 | |
Liberal Federation | Frederick Coneybeer (elected) | 9,948 | 16.8 | +6.8 | |
Labor | Herbert George | 9,912 | 16.7 | +4.6 | |
Liberal Federation | Walter Hamilton | 9,310 | 15.7 | +1.6 | |
Liberal Federation | Albert Sutton | 9,301 | 15.7 | -3.1 | |
Total formal votes | 59,404 20,122 ballots | 99.0 | +0.1 | ||
Informal votes | 194 | 1.0 | −0.1 | ||
Turnout | 20,316 | 62.7 | −0.5 | ||
Party total votes | |||||
Labor | 30,845 | 51.9 | +15.3 | ||
Liberal Federation | 28,559 | 48.1 | +8.1 |
Party | Candidate | Votes | % | ±% | |
---|---|---|---|---|---|
Liberal Federation | James Moseley (elected) | 1,987 | 17.5 | -8.7 | |
Labor | John O'Connor (elected) | 1,631 | 14.4 | +14.4 | |
Labor | James Pollard | 1,605 | 14.2 | +14.2 | |
Country | John Chapman | 1,458 | 12.9 | -11.7 | |
Country | Edwin Barraud | 1,261 | 11.1 | +11.1 | |
Liberal Federation | Frank Masters | 1,229 | 10.8 | +10.8 | |
Single Tax League | Edward Craigie | 1,176 | 10.4 | +10.4 | |
Single Tax League | Harr Frick | 1,000 | 8.8 | -2.7 | |
Total formal votes | 11,347 5,768 ballots | 98.6 | +0.2 | ||
Informal votes | 83 | 1.4 | −0.2 | ||
Turnout | 5,851 | 63.8 | +2.4 | ||
Party total votes | |||||
Labor | 3,236 | 28.6 | +4.4 | ||
Liberal Federation | 3,216 | 28.3 | +2.1 | ||
Country | 2,719 | 24.0 | -0.6 | ||
Single Tax League | 2,176 | 19.2 | +19.2 |
Party | Candidate | Votes | % | ±% | |
---|---|---|---|---|---|
Labor | Frank Staniford (elected) | 4,212 | 17.7 | +3.9 | |
Liberal Federation | Harry Young (elected) | 4,126 | 17.4 | -1.7 | |
Labor | Clement Collins (elected) | 3,975 | 16.7 | +16.7 | |
Liberal Federation | John Randell | 3,927 | 16.5 | -0.5 | |
Labor | Michael Woods | 3,789 | 15.9 | +15.9 | |
Liberal Federation | Hermann Homburg | 3,745 | 15.8 | +15.8 | |
Total formal votes | 23,774 8,097 ballots | 99.4 | +0.2 | ||
Informal votes | 51 | 0.6 | −0.2 | ||
Turnout | 8,148 | 63.6 | +2.3 | ||
Party total votes | |||||
Labor | 11,976 | 50.3 | +10.0 | ||
Liberal Federation | 11,798 | 49.7 | -3.9 |
Party | Candidate | Votes | % | ±% | |
---|---|---|---|---|---|
Labor | Thomas Butterfield (elected) | 2,905 | 39.9 | +9.5 | |
Labor | William Harvey (elected) | 2,745 | 37.7 | +9.3 | |
Liberal Federation | Charles Butler | 1,627 | 22.4 | +22.4 | |
Total formal votes | 7,277 4,350 ballots | 98.3 | −0.6 | ||
Informal votes | 74 | 1.7 | +0.6 | ||
Turnout | 4,424 | 64.4 | +4.8 | ||
Party total votes | |||||
Labor | 5,650 | 77.6 | +18.8 | ||
Liberal Federation | 1,627 | 22.4 | +0.9 |
Party | Candidate | Votes | % | ±% | |
---|---|---|---|---|---|
Labor | Frederick Birrell (elected) | 6,329 | 27.5 | +4.4 | |
Labor | Stanley Whitford (elected) | 6,229 | 27.1 | +5.0 | |
Liberal Federation | Shirley Jeffries | 5,343 | 23.2 | +23.2 | |
Liberal Federation | William Angus | 5,095 | 22.2 | +22.2 | |
Total formal votes | 22,996 11,678 ballots | 99.0 | +0.4 | ||
Informal votes | 114 | 1.0 | −0.4 | ||
Turnout | 11,792 | 62.6 | −2.8 | ||
Party total votes | |||||
Labor | 12,558 | 54.6 | +9.4 | ||
Liberal Federation | 10,438 | 45.4 | +23.8 |
Party | Candidate | Votes | % | ±% | |
---|---|---|---|---|---|
Labor | John Price (elected) | 11,928 | 44.4 | +8.9 | |
Labor | Frank Condon (elected) | 10,996 | 41.0 | +41.0 | |
Liberal Federation | Joseph Lambert | 3,920 | 14.6 | -1.7 | |
Total formal votes | 26,844 14,954 ballots | 99.0 | −0.1 | ||
Informal votes | 151 | 1.0 | +0.1 | ||
Turnout | 15,105 | 64.1 | +3.0 | ||
Party total votes | |||||
Labor | 22,924 | 85.4 | +16.5 | ||
Liberal Federation | 3,920 | 14.6 | -0.1 |
Party | Candidate | Votes | % | ±% | |
---|---|---|---|---|---|
Labor | John Fitzgerald (elected) | unopposed | |||
Labor | Lionel Hill (elected) | unopposed |
Party | Candidate | Votes | % | ±% | |
---|---|---|---|---|---|
Liberal Federation | Robert Nicholls (elected) | 3,807 | 30.6 | -0.9 | |
Liberal Federation | Henry Barwell (elected) | 3,261 | 26.2 | -4.7 | |
Country | Oliver Badman | 2,349 | 18.9 | +18.9 | |
Country | John Aughey | 1,763 | 14.2 | +8.6 | |
Independent | Duncan Menzies | 1,247 | 10.0 | +10.0 | |
Total formal votes | 12,427 6,450 ballots | 98.2 | +0.6 | ||
Informal votes | 163 | 1.8 | −0.6 | ||
Turnout | 6,566 | 70.0 | −3.0 | ||
Party total votes | |||||
Liberal Federation | 7,068 | 56.9 | -5.5 | ||
Country | 4,112 | 33.1 | +21.3 | ||
Independent | Duncan Menzies | 1,247 | 10.0 | +10.0 |
Party | Candidate | Votes | % | ±% | |
---|---|---|---|---|---|
Liberal Federation | Herbert Richards (elected) | 12,041 | 17.7 | +3.5 | |
Liberal Federation | Ernest Anthoney (elected) | 11,924 | 17.5 | +4.0 | |
Liberal Federation | Edward Vardon (elected) | 11,667 | 17.1 | +17.1 | |
Labor | Thomas Grealy | 11,212 | 16.5 | +6.1 | |
Labor | John Verran | 10,771 | 15.8 | +15.8 | |
Labor | Frank Lundie | 10,516 | 15.4 | +15.4 | |
Total formal votes | 68,131 23,112 ballots | 99.2 | +0.2 | ||
Informal votes | 177 | 0.8 | −0.2 | ||
Turnout | 23,289 | 57.8 | −6.4 | ||
Party total votes | |||||
Liberal Federation | 35,632 | 52.3 | +11.1 | ||
Labor | 32,499 | 47.7 | +16.2 |
Party | Candidate | Votes | % | ±% | |
---|---|---|---|---|---|
Liberal Federation | Peter Reidy (elected) | 4,943 | 27.4 | -0.1 | |
Labor | Eric Shepherd (elected) | 4,655 | 25.8 | +1.8 | |
Liberal Federation | Vernon Petherick | 4,443 | 24.6 | -2.0 | |
Labor | James Connell | 3,994 | 22.2 | +22.2 | |
Total formal votes | 18,035 9,089 ballots | 99.3 | 0.0 | ||
Informal votes | 60 | 0.7 | 0.0 | ||
Turnout | 9,149 | 74.6 | +4.8 | ||
Party total votes | |||||
Liberal Federation | 9,386 | 52.0 | +25.4 | ||
Labor | 8,649 | 48.0 | +2.1 |
Party | Candidate | Votes | % | ±% | |
---|---|---|---|---|---|
Labor | Robert Richards (elected) | 3,256 | 33.0 | -2.2 | |
Labor | John Pedler (elected) | 3,118 | 31.6 | -2.5 | |
Liberal Federation | John Verran | 1,848 | 18.8 | -11.9 | |
Liberal Federation | John Dunstone | 1,526 | 15.5 | +15.5 | |
Independent | Richard Gully | 109 | 1.1 | +1.1 | |
Total formal votes | 9,857 5,003 ballots | 98.9 | −0.6 | ||
Informal votes | 58 | 1.1 | +0.6 | ||
Turnout | 5,061 | 77.1 | −3.0 | ||
Party total votes | |||||
Labor | 6,374 | 64.7 | -4.6 | ||
Liberal Federation | 3,374 | 34.2 | +34.2 | ||
Independent | Richard Gully | 109 | 1.1 | +1.1 |
Party | Candidate | Votes | % | ±% | |
---|---|---|---|---|---|
Labor | Alfred Blackwell (elected) | unopposed | |||
Labor | John McInnes (elected) | unopposed |
Party | Candidate | Votes | % | ±% | |
---|---|---|---|---|---|
Liberal Federation | James McLachlan (elected) | 3,138 | 13.4 | -5.3 | |
Liberal Federation | Richard Butler (elected) | 2,991 | 12.7 | -5.3 | |
Labor | Allan Robertson (elected) | 2,846 | 12.1 | -2.3 | |
Liberal Federation | Albert Robinson | 2,806 | 11.9 | -3.8 | |
Labor | Alfred Tonkin | 2,647 | 11.3 | -1.3 | |
Labor | Horace Bowden | 2,591 | 11.0 | +11.0 | |
Country | Archie Cameron | 2,302 | 9.8 | +9.8 | |
Country | Henry Queale | 2,104 | 9.0 | +9.0 | |
Country | Oscar Duhst | 2,079 | 8.9 | +8.9 | |
Total formal votes | 23,504 7,929 ballots | 99.2 | 0.0 | ||
Informal votes | 67 | 0.8 | 0.0 | ||
Turnout | 7,996 | 72.9 | +1.2 | ||
Party total votes | |||||
Liberal Federation | 8,935 | 38.0 | -14.4 | ||
Labor | 8,084 | 34.4 | -5.5 | ||
Country | 6,485 | 27.6 | +27.6 |
Party | Candidate | Votes | % | ±% | |
---|---|---|---|---|---|
Liberal Federation | Henry Tossell (elected) | 2,689 | 35.1 | ||
Liberal Federation | Peter Allen (elected) | 2,612 | 34.1 | ||
Country | Alfred Rodda | 1,253 | 16.4 | ||
Country | H A Montgomery | 1,097 | 14.3 | ||
Total formal votes | 7,651 3,874 ballots | 98.5 | |||
Informal votes | 61 | 1.5 | |||
Turnout | 3,935 | 56.0 | |||
Party total votes | |||||
Liberal Federation | 5,301 | 69.3 | N/A | ||
Country | 2,350 | 30.7 | N/A |
The electoral system of Australia comprises the laws and processes used for the election of members of the Australian Parliament and is governed primarily by the Commonwealth Electoral Act 1918. The system presently has a number of distinctive features including compulsory enrolment; compulsory voting; majority-preferential instant-runoff voting in single-member seats to elect the lower house, the House of Representatives; and the use of the single transferable vote proportional representation system to elect the upper house, the Senate.
Electoral systems of the Australian states and territories are broadly similar to the electoral system used in federal elections in Australia.
The Legislative Council, or upper house, is one of the two chambers of the Parliament of South Australia. Its central purpose is to act as a house of review for legislation passed through the lower house, the House of Assembly. It sits in Parliament House in the state capital, Adelaide.
The House of Assembly, or lower house; Is one of the two chambers of the Parliament of South Australia. The other is the Legislative Council. It sits in Parliament House in the state capital, Adelaide.
The Parliament of South Australia is the bicameral legislature of the Australian state of South Australia. It consists of the 47-seat House of Assembly and the 22-seat Legislative Council. General elections are held every 4 years, with all of the lower house and half of the upper house filled at each election. It follows a Westminster system of parliamentary government with the executive branch required to both sit in parliament and hold the confidence of the House of Assembly. The parliament is based at Parliament House on North Terrace in the state capital of Adelaide.
Australian Greens SA is a green political party located in the Australian state of South Australia. It is a member of the federation of the Australian Greens party.
State elections were held in South Australia on 17 September 1977. All 47 seats in the South Australian House of Assembly were up for election. The incumbent Australian Labor Party led by Premier of South Australia Don Dunstan won a fourth term in government, defeating the Liberal Party of Australia led by Leader of the Opposition David Tonkin.
This is a list of members of the Western Australian Legislative Assembly between the 1924 election and the 1927 election, together known as the 12th Parliament. During the previous term, the Country Party had split into rival factions, the Ministerial Country Party (MCP) which comprised the bulk of the parliamentary party—many of whom had switched allegiance from other parties since 1919—and the Executive Country Party (ECP), which was loyal to the Primary Producers' Association, which the Country Party was intended to represent in Parliament. After the 1924 election, which significantly strengthened the latter at the expense of the former, the Ministerial arm merged with the Nationalist Party, as did the National Labor Party, which lost most of its representation in the election.
This is a list of members of the Tasmanian House of Assembly between the 10 June 1922 election and the 3 June 1925 election. The fledgling Country Party got five members elected, including two former Nationalists, but by the end of the term the party had all but merged into the Nationalist Party. A new Liberal Party emerged before the 1925 election, counting the support of three MHAs.
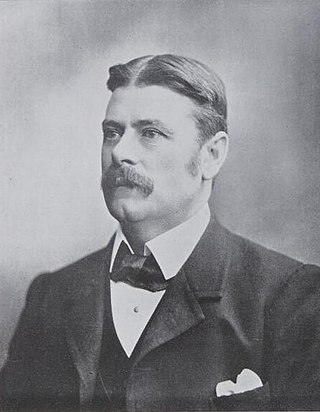
The 1902 South Australian state election was held on 3 May 1902 following the dissolution of both houses. All 42 seats in the South Australian House of Assembly were up for election, and all 18 seats in the Legislative Council. The House had a reduction of 12 seats compared to the previous election. The Council was reduced from 6 members in each of four districts to 6 members from Central District and four from each of North-Eastern, Northern and Southern Districts. The incumbent liberal government led by Premier of South Australia John Jenkins in an informal coalition with the conservatives defeated the United Labor Party (ULP) led by Thomas Price. Each of the 13 districts elected multiple members, with voters casting multiple votes.
State elections were held in South Australia on 9 and 16 April 1921. All 46 seats in the South Australian House of Assembly were up for election. The incumbent Liberal Union government led by Premier of South Australia Henry Barwell defeated the opposition Australian Labor Party led by Leader of the Opposition John Gunn. Each district elected multiple members, with voters casting multiple votes.
State elections were held in South Australia on 5 April 1924. All 46 seats in the South Australian House of Assembly were up for election. The incumbent Liberal Federation government led by Premier of South Australia Henry Barwell was defeated by the opposition Australian Labor Party led by Leader of the Opposition John Gunn. Each district elected multiple members, with voters casting multiple votes.
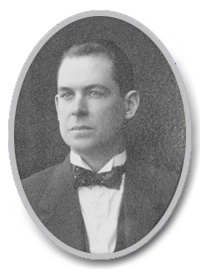
Thomas Butterfield was an Australian politician and minister in the South Australian Parliament.
The Protestant Independent Labour Party, alternatively spelt Protestant Independent Labor and sometimes known as the Protestant Labour Party, was a minor Australian political party that operated mainly in New South Wales, Queensland and South Australia in the 1920s and 1930s. It was formed by Walter Skelton in July 1923 as the Protestant Independent Labour Party. who had stood for the New South Wales Legislative Assembly district of Newcastle at the 1922 election, campaigning as a Protestant Independent Labour candidate, in which he was elected first of five members, receiving 25.19% of the vote. In 1925 he was re-elected to the Assembly under the Protestant Labour label, as the second of five members, receiving 17.70% of the vote. The party stood candidates in 12 of the 24 districts however Skelton was the only one elected, with the next highest candidate receiving 5.10% of the district vote.
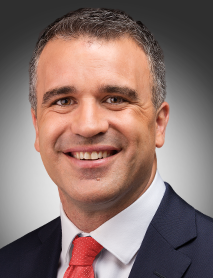
The 2018 South Australian state election to elect members to the 54th Parliament of South Australia was held on 17 March 2018. All 47 seats in the House of Assembly or lower house, whose members were elected at the 2014 election, and 11 of 22 seats in the Legislative Council or upper house, last filled at the 2010 election, were contested. The record-16-year-incumbent Australian Labor Party (SA) government led by Premier Jay Weatherill was seeking a fifth four-year term, but was defeated by the opposition Liberal Party of Australia (SA), led by Opposition Leader Steven Marshall. Nick Xenophon's new SA Best party unsuccessfully sought to obtain the balance of power.
The 2021 Western Australian state election was held on Saturday, March 13, to elect members to the Parliament of Western Australia, where all 59 seats in the Legislative Assembly and all 36 seats in the Legislative Council were up for election.
SA-Best, formerly known as Nick Xenophon's SA-BEST, is a political party in South Australia. It was founded in 2017 by Nick Xenophon as a state-based partner to his Nick Xenophon Team party. After an unsuccessful 2022 South Australian state election, the party has one representative in the South Australian Legislative Council, Connie Bonaros, whose term expires in 2026.
The 2022 South Australian state election was held on 19 March 2022 to elect members to the 55th Parliament of South Australia. All 47 seats in the House of Assembly, and half the seats in the Legislative Council were up for re-election.
This is a list of House of Assembly results for the 1921 South Australian state election. Each district elected multiple members.
This is a list of House of Assembly results for the 1918 South Australian state election. Each district elected multiple members.