| |||||||||||||||||||||||||||||||||||||||||||||
All 46 seats in the South Australian House of Assembly 24 seats were needed for a majority | |||||||||||||||||||||||||||||||||||||||||||||
|---|---|---|---|---|---|---|---|---|---|---|---|---|---|---|---|---|---|---|---|---|---|---|---|---|---|---|---|---|---|---|---|---|---|---|---|---|---|---|---|---|---|---|---|---|---|
| |||||||||||||||||||||||||||||||||||||||||||||
| |||||||||||||||||||||||||||||||||||||||||||||
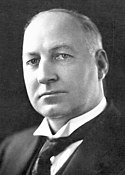
State elections were held in South Australia on 26 March 1927. All 46 seats in the South Australian House of Assembly were up for election. The incumbent Australian Labor Party government led by Premier of South Australia Lionel Hill was defeated by the opposition Liberal Federation led by Leader of the Opposition Richard L. Butler, and the Country Party (SA) led by Archie Cameron. Each district elected multiple members, with voters casting multiple votes.
Contents
Before the election, the Liberal Federation attempted to enter in to a formal coalition with the Country Party, but when this was rejected, Country Party candidates were given no Liberal opposition in six seats in five rural electorates. [1]


