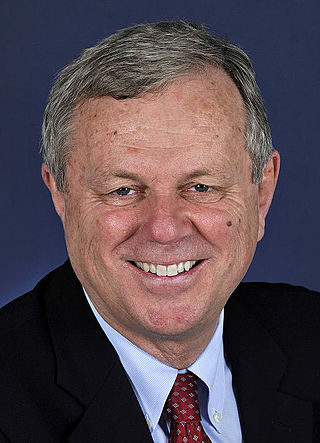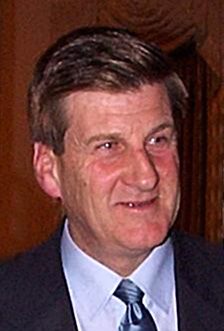
The state election for the 51st Parliament of South Australia was held in the Australian state of South Australia on 18 March 2006 to elect all members of the South Australian House of Assembly and 11 members of the South Australian Legislative Council. The election was conducted by the independent State Electoral Office.

State elections were held in South Australia on 9 February 2002. All 47 seats in the South Australian House of Assembly were up for election, along with half of the 22 seats in the South Australian Legislative Council. The incumbent Liberal Party of Australia led by Premier of South Australia Rob Kerin was defeated by the Australian Labor Party led by Leader of the Opposition Mike Rann. The Labor Party won 23 out of 47 seats, and then secured the one more seat it needed for a majority by gaining the support of independent Peter Lewis.

State elections were held in South Australia on 11 October 1997. All 47 seats in the South Australian House of Assembly were up for election. The incumbent Liberal Party of Australia led by Premier of South Australia John Olsen defeated the Australian Labor Party led by Leader of the Opposition Mike Rann, forming a minority government with the SA Nationals and independent MPs.
State elections were held in South Australia on 11 December 1993. All 47 seats in the South Australian House of Assembly were up for election. The incumbent Labor government, led by Premier Lynn Arnold, was defeated by the Liberal Opposition, led by Dean Brown, in a landslide victory. The Liberals won what is still the largest majority government in South Australian history.

The 1992 Victoria state election, held on Saturday, October 3. was for the 52nd Parliament of Victoria. It was held in the Australian state of Victoria to elect all 88 members of the state's Legislative Assembly and 22 members of the 44-member Legislative Council.

State elections were held in South Australia on 25 November 1989. All 47 seats in the South Australian House of Assembly were up for election. The incumbent Australian Labor Party led by Premier of South Australia John Bannon defeated the Liberal Party of Australia led by Leader of the Opposition John Olsen. Labor won 22 out of 47 seats, and secured a majority of 24 with the support of two Independent Labor members.

State elections were held in South Australia on 6 November 1982. All 47 seats in the South Australian House of Assembly were up for election. The incumbent Liberal Party of Australia led by Premier of South Australia David Tonkin was defeated by the Australian Labor Party led by Leader of the Opposition John Bannon.

State elections were held in South Australia on 15 September 1979. All 47 seats in the South Australian House of Assembly were up for election. The incumbent Australian Labor Party led by Premier of South Australia Des Corcoran was defeated by the Liberal Party of Australia led by Leader of the Opposition David Tonkin.

State elections were held in South Australia on 17 September 1977. All 47 seats in the South Australian House of Assembly were up for election. The incumbent Australian Labor Party led by Premier of South Australia Don Dunstan won a fourth term in government, defeating the Liberal Party of Australia led by Leader of the Opposition David Tonkin.

State elections were held in South Australia on 12 July 1975. All 47 seats in the South Australian House of Assembly were up for election. The incumbent Australian Labor Party led by Premier of South Australia Don Dunstan won a third term in government, defeating the Liberal Party of Australia led by Leader of the Opposition Bruce Eastick.

State elections were held in South Australia on 10 March 1973. All 47 seats in the South Australian House of Assembly were up for election. The incumbent Australian Labor Party led by Premier of South Australia Don Dunstan won a second term in government, defeating the Liberal and Country League led by Leader of the Opposition Bruce Eastick.

The 2010 South Australian state election elected members to the 52nd Parliament of South Australia on 20 March 2010. All seats in the House of Assembly or lower house, whose current members were elected at the 2006 election, and half the seats in the Legislative Council or upper house, last filled at the 2002 election, became vacant.

The 2014 South Australian state election elected members to the 53rd Parliament of South Australia on 15 March 2014, to fill all 47 seats in the House of Assembly and 11 of 22 seats in the Legislative Council. The 12-year-incumbent Australian Labor Party (SA) government, led by Premier Jay Weatherill, won its fourth consecutive four-year term in government, a record 16 years of Labor government, defeating the opposition Liberal Party of Australia (SA), led by Opposition Leader Steven Marshall.

The 2018 South Australian state election to elect members to the 54th Parliament of South Australia was held on 17 March 2018. All 47 seats in the House of Assembly or lower house, whose members were elected at the 2014 election, and 11 of 22 seats in the Legislative Council or upper house, last filled at the 2010 election, were contested. The record-16-year-incumbent Australian Labor Party (SA) government led by Premier Jay Weatherill was seeking a fifth four-year term, but was defeated by the opposition Liberal Party of Australia (SA), led by Opposition Leader Steven Marshall. Nick Xenophon's new SA Best party unsuccessfully sought to obtain the balance of power.
The 1993 South Australian state election was held on 11 December 1993.

The South Australian Labor Party, officially known as the Australian Labor Party (South Australian Branch) and commonly referred to simply as South Australian Labor, is the South Australian Branch of the Australian Labor Party, originally formed in 1891 as the United Labor Party of South Australia. It is one of two major parties in the bicameral Parliament of South Australia, the other being the Liberal Party of Australia (SA Division).

The South Australian Liberal Party, officially known as the Liberal Party of Australia (South Australian Division), and often shortened to SA Liberals, is the South Australian Division of the Liberal Party of Australia. It was formed as the Liberal and Country League (LCL) in 1932 and became the South Australian Division of the Liberal Party when the Liberal Party was formed in 1945. It retained its Liberal and Country League name before changing to its current name in 1974. It is one of two major parties in the bicameral Parliament of South Australia, the other being the Australian Labor Party (SA Branch). The party is led by Vincent Tarzia since 12 August 2024.

SA-Best, formerly known as Nick Xenophon's SA-BEST, is a political party in South Australia. It was founded in 2017 by Nick Xenophon as a state-based partner to his Nick Xenophon Team party. After an unsuccessful 2022 South Australian state election, the party has one representative in the South Australian Legislative Council, Connie Bonaros, whose term expires in 2026.

The 2022 South Australian state election was held on 19 March 2022 to elect members to the 55th Parliament of South Australia. All 47 seats in the House of Assembly, and half the seats in the Legislative Council were up for re-election.

The 2026 South Australian state election will be held on 21 March 2026 to elect members to the 56th Parliament of South Australia. All 47 seats in the House of Assembly, and half the seats in the Legislative Council are up for re-election.


