1993 South Australian state election

Last updated

1993 South Australian state election
Flag of South Australia.svg
  1989 11 December 1993 (1993-12-11) 1997  

All 47 seats in the House of Assembly
24 seats needed for a majority
11 of 22 seats in the Legislative Council
 First partySecond partyThird party
  Liberal Placeholder.png Labor Placeholder.png Nationals Placeholder.png
Leader Dean Brown Lynn Arnold Peter Blacker
Party Liberal Labor National
Leader since11 May 19924 September 199210 March 1973
Leader's seat Finniss Taylor Flinders
(lost seat)
Last election22 seats22 seats1 seat
Seats before22221
Seats won37100
Seat changeIncrease2.svg 15Decrease2.svg 12Decrease2.svg 1
Popular vote481,623277,03810,217
Percentage52.8%30.4%1.1%
SwingIncrease2.svg 8.6 pp Decrease2.svg 9.7 ppDecrease2.svg 0.1 pp

Premier before election

Lynn Arnold
Labor

Elected Premier

Dean Brown
Liberal

The 1993 South Australian state election was held on Saturday, 11 December 1993, to elect members of the Parliament of South Australia. All 47 seats in the House of Assembly were up for election, along with 11 of the 22 seats in the Legislative Council. The three-term incumbent Arnold Labor government were defeated in a landslide victory for the opposition Liberal Party, led by Dean Brown. The Liberals won 37 seats in the House of Assembly, the highest number of seats ever won by a single party in a South Australian election, and reduced Labor to 10 seats in opposition, their lowest amount since 1938.

Contents

This marked the Liberal's first election win since 1979, and only their second since the end of the Playmander after the 1968 election. It brought to an end a decade of Labor governance, led by John Bannon for nine of those years. It was also the first time since 1970 that no crossbenchers were elected to the House of Assembly.

Labor's historic defeat was largely attributed to the collapse of the State Bank of South Australia in 1991, which led to the resignation of Premier John Bannon the next year.

Background

The campaign was dominated by the issue of the collapse of the State Bank of South Australia in 1991. The State Bank's deposits were legally underwritten by the Government of South Australia, putting South Australia into billions of dollars of debt. Labor premier John Bannon had resigned over the issue in 1992, being replaced by Lynn Arnold just over a year before the election. The Liberals also changed leaders in 1992, switching from Dale Baker to Dean Brown. Following the Labor leadership change and by early 1993, Newspoll had recorded a total rise of 13 percent in the Labor primary vote. [1] However, the gains did not last. A warning sign of things to come came with the March 1993 federal election, which saw two of Labor's longest-held seats in South Australia, Hindmarsh and Grey, fall to the Liberals. Hindmarsh had been in Labor hands without interruption since 1919, while Grey had been in Labor hands for all but one term since 1943.

Key dates

Results

House of Assembly

South Australian state election, 11 December 1993 [2]
House of Assembly
<< 19891997 >>

Enrolled voters1,006,035
Votes cast941,301 Turnout 93.57-0.86
Informal votes29,206Informal3.10+0.27
Summary of votes by party
PartyPrimary votes %SwingSeatsChange
  Liberal 481,62352.80+8.6037+ 15
  Labor 277,03830.37–9.7210– 12
  Democrats 82,9429.09–1.180± 0
  National 10,1571.11–0.070– 1
  Natural Law 9,3861.03+1.030± 0
  Independent 28,4983.12+1.890± 0
  Independent Labor 6,2250.68–0.830– 2
 Other16,2261.78*0± 0
Total912,095  47 
Two-party-preferred
  Liberal 555,53460.91+8.87
  Labor 356,56139.09–8.87
Popular vote
Liberal
52.80%
Labor
30.37%
Democrats
9.09%
Independents
3.81%
National
1.11%
Natural Law
1.03%
Others
1.78%
Two-party-preferred vote
Liberal
60.91%
Labor
39.09%
Seats
Liberal
78.72%
Labor
21.28%

The Liberals under Dean Brown went into the election as unbackable favourites, and swept the 11-year Labor government from power in a massive landslide. They won 37 of 47 seats (78.7 percent of the available seats, a majority of 14) in the South Australian House of Assembly from a 15-seat swing − in terms of seat count and percentage of seats won, the largest majority government in the state's history. By comparison, Sir Thomas Playford never governed with more than 23 seats in a 39-seat legislature during his record 27 years as Premier, and Don Dunstan never governed with more than 27 seats in a 47-seat legislature.

The Liberals won 60.9 percent of the two-party vote, the largest two-party preferred vote in South Australian state history (dating back to the first statewide two-party calculations from 1944). Labor fell to just 39.1 percent of the two-party vote from a two-party swing of 8.9 percent—at the time, the largest two-party swing in South Australian state history (second only to the 9.4 percent swing at the following 1997 election, and still the largest that resulted in a change of government. The 15-seat swing is still the largest in South Australian state history.

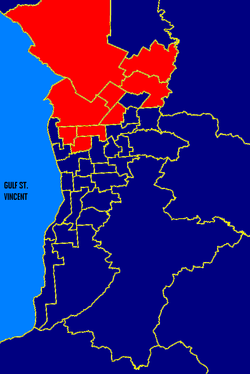
Adelaide, which had been Labor's power base in the state for decades, swung over dramatically to support the Liberals. Labor lost seats in several parts of Adelaide where it had not been seriously threatened in memory, and was cut down to only nine seats in the capital. Additionally, Labor suffered what proved to be permanent swings in much of country South Australia; it was cut down to only one seat outside of Adelaide, the Whyalla-based seat of Giles.

The stratospheric records for seat count and percentage of seats in the House led to predictions of a generation of Liberal government. However, the Liberal gains were short lived. Factional stoushes between the moderate and conservative wings of the Liberal Party led to Brown's factional rival, John Olsen, successfully challenging Brown for the Liberal leadership in 1996. In turn, the Liberals were reduced to a minority government as a result of the 1997 election, following another record two-party swing in the other direction of 9.5 percent.

A 1994 Torrens by-election saw Labor take the seat from the Liberals. The 1994 Elizabeth by-election and 1994 Taylor by-election saw Labor retain both seats.

Legislative Council

South Australian state election, 11 December 1993 [3]
Legislative Council
<< 19891997 >>

Enrolled voters1,006,035
Votes cast941,864 Turnout 93.62–0.91
Informal votes33,338Informal3.54–0.35
Summary of votes by party
PartyPrimary votes %SwingSeats
won
Seats
held
  Liberal 470,67551.81+10.71611
  Labor 248,97027.40–12.3549
  Democrats 73,0518.04–2.6512
  HEMP 16,3531.80+1.8000
  Grey Power 14,5601.60–0.6800
  Greens 11,8531.30+1.3000
  Shooters 10,6221.17+1.1700
  Call to Australia 9,3171.03–1.5000
  National 6,5160.72–0.0600
 Green Alliance3,9600.44+0.4400
 Independent Alliance3,5330.39+0.3900
  Natural Law 3,4210.38+0.3800
 Other35,6953.93*00
Total908,526  1122

Seats changing hands

SeatPre-1993SwingPost-1993
PartyMemberMarginMarginMemberParty
Elder  LaborNotional - New Seat4.68.03.4 David Wade Liberal 
Elizabeth  Independent Martyn Evans*N/AN/A7.6 Martyn Evans Labor 
Flinders  National SA Peter Blacker 6.814.67.8 Liz Penfold Liberal 
Florey  Labor Bob Gregory 1.812.210.4 Sam Bass Liberal 
Hart  Independent Norm Peterson *N/AN/A8.5 Kevin Foley Labor 
Kaurna  Labor Don Hopgood *3.66.42.8 Lorraine Rosenberg Liberal 
Lee  Labor Kevin Hamilton*8.19.21.1 Joe Rossi Liberal 
Mawson  Labor Susan Lenehan *2.612.29.6 Robert Brokenshire Liberal 
Mitchell  Labor Paul Holloway *3.613.09.4 Colin Caudell Liberal 
Norwood  Labor Greg Crafter 3.010.47.4 John Cummins Liberal 
Peake  Labor Vic Heron 4.09.65.6 Heini Becker Liberal 
Reynell  LaborNotional - New Seat9.010.21.2 Julie Greig Liberal 
Torrens  Labor John Klunder*4.511.06.5 Joe Tiernan Liberal 
Unley  Labor Kym Mayes 0.612.111.5 Mark Brindal Liberal 
Wright  Labor Mike Rann *5.29.24.0 Scott Ashenden Liberal 

Redistribution affected seats

Seat1989 election1991 redistributionSwing1993 election
PartyMemberMarginPartyMemberMarginMarginMemberParty
Hanson  Liberal Heini Becker *6.1 LaborNotional4.9-6.11.2 Stewart Leggett Liberal 
Hartley  Labor Terry Groom *4.5 LiberalNotional1.4+11.813.2 Joe Scalzi Liberal 
Newland  Liberal Dorothy Kotz 0.1 LaborNotional0.4-17.817.4 Dorothy Kotz Liberal 

Post-election pendulum

Liberal seats (37)
Marginal
Lee Joe Rossi LIB1.1%
Hanson Stewart Leggett LIB1.2%
Reynell Julie Greig LIB1.2%
Kaurna Lorraine Rosenberg LIB2.8%
Elder David Wade LIB3.4%
Wright Scott Ashenden LIB4.0%
Peake Heini Becker LIB5.6%
Frome Rob Kerin LIB5.7%
Fairly safe
Chaffey Kent Andrew LIB6.3% vs NAT
Eyre Graham Gunn LIB6.5%
Torrens Joe Tiernan LIB6.5%
Norwood John Cummins LIB7.4%
Flinders Liz Penfold LIB7.8% vs NAT
Mitchell Colin Caudell LIB9.4%
Mawson Robert Brokenshire LIB9.6%
Safe
Davenport Iain Evans LIB10.2% vs AD
Florey Sam Bass LIB10.4%
Colton Steve Condous LIB10.5%
Unley Mark Brindal LIB11.5%
Hartley Joe Scalzi LIB13.2%
Adelaide Michael Armitage LIB14.1%
Coles Joan Hall LIB15.9%
Light Malcolm Buckby LIB16.4%
Newland Dorothy Kotz LIB17.4%
Bright Wayne Matthew LIB19.0%
Fisher Bob Such LIB20.7%
Morphett John Oswald LIB21.9%
Gordon Harold Allison LIB22.2%
Goyder John Meier LIB23.3%
Waite Stephen Baker LIB23.3% vs AD
Kavel John Olsen LIB24.3%
Finniss Dean Brown LIB24.4%
Heysen David Wotton LIB24.5%
Custance Ivan Venning LIB24.5%
Ridley Peter Lewis LIB25.1%
MacKillop Dale Baker LIB27.7%
Bragg Graham Ingerson LIB28.7%
Labor seats (10)
Marginal
Napier Annette Hurley ALP1.1%
Ross Smith Ralph Clarke ALP2.1%
Giles Frank Blevins ALP2.4%
Playford John Quirke ALP2.7%
Fairly safe
Elizabeth Martyn Evans ALP7.6%
Spence Michael Atkinson ALP7.7%
Taylor Lynn Arnold ALP8.0%
Hart Kevin Foley ALP8.5%
Ramsay Mike Rann ALP9.9%
Safe
Price Murray De Laine ALP11.0%
Metro SA: ALP in red, Liberal in blue. These boundaries are based on the 2006 electoral redistribution. Sametro93.png
Metro SA: ALP in red, Liberal in blue. These boundaries are based on the 2006 electoral redistribution.
Rural SA: ALP in red, Liberal in blue. These boundaries are based on the 2006 electoral redistribution. Sastate93.png
Rural SA: ALP in red, Liberal in blue. These boundaries are based on the 2006 electoral redistribution.

See also

Notes

  1. "SA voting intention and leader ratings: Newspoll/The Australian". Archived from the original on 6 February 2012. Retrieved 21 January 2012.
  2. "Details of SA 1993 Election". Australian Politics and Elections Database.
  3. Green, Antony. "South Australian 1993 Election Results" (PDF). ABC Election Archives. Retrieved 11 April 2016.

References

Political parties