This was the first election since Labor narrowly lost as opposition in the 1997 election, doing much better than most analysts predicted, forcing the Liberals to minority government after their comprehensive loss in the 1993 election where Labor were reduced to just ten seats. Coming into the 2002 election, the Liberal Government had faced a number of scandals including the Motorola affair, over which Premier John Olsen was forced to resign in October 2001. He was succeeded by Rob Kerin, who had less than three months to govern before the election was called.
Key dates
Issue of writ: 15 January 2002
Close of electoral rolls: 22 January 2002
Close of nominations: Friday 25 January 2002, at noon
Polling day: 9 February 2002
Return of writ: On or before 15 March 2002 (actually returned 26 February)
Bob Such and Peter Lewis were elected at the 1997 election as Liberals, but quit the party and recontested their seats as Independents and won. Pre-election margins are vs Labor, After margins are against Liberal.
Mitch Williams was elected at the 1997 election as an Independent, but joined the Liberal party and recontested his seat as a Liberal. Margin is against Independent candidate Bill Hender.
Formation of Government
Labor won two seats from the Liberals, the districts of Adelaide (Jane Lomax-Smith) and Colton (Paul Caica). This gave Labor 23 seats, Liberals 20 seats, SA Nationals one seat, and three seats to independents. To form majority government, a party needed 24 seats out of 47. Most analysts expected Kerin to form a minority government with the support of Nationals MP Karlene Maywald, and the three independents, who were all former Liberal party members.
On 13 February, one of those crossbenchers, former Liberal Peter Lewis, announced that he had signed an agreement with Labor leader Mike Rann to support a Labor Government in exchange for holding a constitutional convention, making him speaker of the House of Assembly, and concessions for his electorate including the phasing out of commercial fishing in the River Murray, prioritising the eradication of the branched broomrape weed, changing water rates for irrigation, fast-tracking a feasibility study for a weir and lock at Wellington, and improving rural roads. This agreement effectively made Rann premier-elect by one seat.
However, following parliamentary precedent established by Don Dunstan following the 1968 election, Kerin refused to resign until Rann and Labor demonstrated that they had majority support on the floor of the House of Assembly. Kerin claimed to be within this rights to take this course, as longstanding precedent in the Westminster system holds that the incumbent premier should have the first opportunity to form a government if no party has a majority.[citation needed]
After three weeks of stalemate, the House of Assembly was called into session several weeks earlier than usual. With Lewis in the speaker's chair, the Kerin Government was defeated on the floor of the House of Assembly on 5 March 2002, after Kerin moved a confidence motion in his own government and lost. Rann then advised GovernorMarjorie Jackson-Nelson that he could form a government, which was duly sworn in the following day.
Rann later shored up his government's majority by reaching agreements with crossbenchers Maywald and McEwen, giving them cabinet posts in exchange for their support of the government.
This left the overall numbers in the Legislative Council at: Liberal 9, Labor 7, Democrats 3, Family First 1, No Pokies 1, and 1 independent (Terry Cameron).
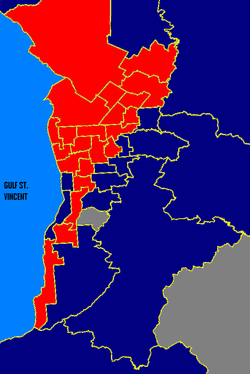
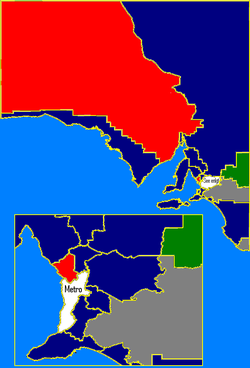
Metro SA: ALP in red, Liberal in blue, Independents in white. These boundaries are based on the 2006 electoral redistribution.Rural SA: ALP in red, Liberal in blue, Independents in white, Nationals in green. These boundaries are based on the 2006 electoral redistribution.
This page is based on this Wikipedia article Text is available under the CC BY-SA 4.0 license; additional terms may apply. Images, videos and audio are available under their respective licenses.