This is a list of electoral district results of the 1924 Western Australian election.
Party | Candidate | Votes | % | ±% | |
---|---|---|---|---|---|
Nationalist | Robert Robinson | 1,035 | 35.4 | +35.4 | |
Labor | Washington Mather | 648 | 22.2 | −20.8 | |
Labor | Arthur Wansbrough | 644 | 22.1 | +22.1 | |
Independent | William Redman | 211 | 7.2 | +7.2 | |
Country | Percy Lambert | 201 | 6.9 | −50.2 | |
Country | Cuthbert McKenzie | 182 | 6.2 | +6.2 | |
Total formal votes | 2,921 | 97.9 | −1.2 | ||
Informal votes | 63 | 2.1 | +1.2 | ||
Turnout | 2,984 | 64.6 | −1.6 | ||
Two-party-preferred result | |||||
Labor | Arthur Wansbrough | 1,501 | 51.4 | +8.5 | |
Nationalist | Robert Robinson | 1,420 | 48.6 | +48.6 | |
Labor gain from Country | Swing | +8.5 |
Party | Candidate | Votes | % | ±% | |
---|---|---|---|---|---|
Labor | Patrick Coffey | 1,199 | 44.9 | −0.6 | |
Executive Country | Harry Griffiths | 657 | 24.6 | +24.6 | |
Country | Tom Harrison | 504 | 18.9 | −30.6 | |
Executive Country | Tom Bolton | 311 | 11.6 | +11.6 | |
Total formal votes | 2,671 | 98.3 | +0.2 | ||
Informal votes | 46 | 1.7 | −0.2 | ||
Turnout | 2,717 | 61.0 | +4.3 | ||
Two-party-preferred result | |||||
Executive Country | Harry Griffiths | 1,350 | 50.5 | +50.5 | |
Labor | Patrick Coffey | 1,321 | 49.5 | +2.2 | |
Executive Country gain from Country | Swing | N/A |
Party | Candidate | Votes | % | ±% | |
---|---|---|---|---|---|
Country | James Mann | 506 | 44.2 | −55.8 | |
Executive Country | Charles Wansbrough | 469 | 41.0 | +41.0 | |
Executive Country | Henry Clemens | 170 | 14.8 | +14.8 | |
Total formal votes | 1,145 | 98.7 | |||
Informal votes | 15 | 1.3 | |||
Turnout | 1,160 | 57.3 | |||
Two-party-preferred result | |||||
Executive Country | Charles Wansbrough | 580 | 50.7 | +50.7 | |
Country | James Mann | 565 | 49.3 | −50.7 | |
Executive Country gain from Country | Swing | N/A |
Party | Candidate | Votes | % | ±% | |
---|---|---|---|---|---|
Labor | Philip Collier | unopposed | |||
Labor hold | Swing |
Party | Candidate | Votes | % | ±% | |
---|---|---|---|---|---|
Labor | John Lutey | 1,318 | 74.6 | +17.9 | |
National Labor | George Holmes | 259 | 14.7 | −28.6 | |
Ind. Nationalist | Elliot Brown | 190 | 10.8 | +10.8 | |
Total formal votes | 1,767 | 98.4 | −0.9 | ||
Informal votes | 29 | 1.6 | +0.9 | ||
Turnout | 1,796 | 66.8 | −9.6 | ||
Labor hold | Swing | N/A |
Party | Candidate | Votes | % | ±% | |
---|---|---|---|---|---|
Labor | Frederick Withers | 1,251 | 46.8 | −2.4 | |
Nationalist | Griffin Money | 1,021 | 38.2 | −12.6 | |
Ind. Nationalist | Hannah Thomas | 399 | 14.9 | +14.9 | |
Total formal votes | 2,671 | 98.4 | −1.1 | ||
Informal votes | 44 | 1.6 | +1.1 | ||
Turnout | 2,715 | 74.2 | +6.0 | ||
Two-party-preferred result | |||||
Labor | Frederick Withers | 1,346 | 50.4 | +1.2 | |
Nationalist | Griffin Money | 1,325 | 49.6 | −1.2 | |
Labor gain from Nationalist | Swing | +1.2 |
Party | Candidate | Votes | % | ±% | |
---|---|---|---|---|---|
Labor | Alec Clydesdale | 3,976 | 69.8 | +21.9 | |
Nationalist | Peter Wedd | 1,719 | 30.2 | −8.1 | |
Total formal votes | 5,695 | 99.3 | +1.3 | ||
Informal votes | 41 | 0.7 | −1.3 | ||
Turnout | 5,736 | 49.7 | −20.0 | ||
Labor hold | Swing | +14.9 |
Party | Candidate | Votes | % | ±% | |
---|---|---|---|---|---|
Labor | George Dennis | 2,086 | 36.6 | +15.0 | |
Nationalist | Charles North | 1,933 | 33.9 | +3.8 | |
Ind. Nationalist | John Thomson | 1,686 | 29.5 | +29.5 | |
Total formal votes | 5,705 | 98.6 | +0.6 | ||
Informal votes | 78 | 1.4 | −0.6 | ||
Turnout | 5,783 | 68.0 | −10.4 | ||
Two-party-preferred result | |||||
Nationalist | Charles North | 3,356 | 58.8 | +2.4 | |
Labor | George Dennis | 2,349 | 41.2 | −2.4 | |
Nationalist hold | Swing | +2.4 |
Party | Candidate | Votes | % | ±% | |
---|---|---|---|---|---|
Labor | Arthur Wilson | unopposed | |||
Labor hold | Swing |
Party | Candidate | Votes | % | ±% | |
---|---|---|---|---|---|
Labor | George Lambert | unopposed | |||
Labor hold | Swing |
Party | Candidate | Votes | % | ±% | |
---|---|---|---|---|---|
Labor | Thomas Chesson | unopposed | |||
Labor hold | Swing |
Party | Candidate | Votes | % | ±% | |
---|---|---|---|---|---|
Labor | Thomas Hughes | 2,528 | 54.9 | +7.1 | |
Nationalist | Jack Simons | 1,335 | 29.0 | +10.0 | |
Nationalist | Thomas Ferguson | 746 | 16.2 | 0.0 | |
Total formal votes | 4,609 | 98.8 | +0.8 | ||
Informal votes | 54 | 1.2 | −0.8 | ||
Turnout | 4,663 | 61.3 | −9.2 | ||
Labor hold | Swing | N/A |
Party | Candidate | Votes | % | ±% | |
---|---|---|---|---|---|
Labor | John Holman | unopposed | |||
Labor hold | Swing |
Party | Candidate | Votes | % | ±% | |
---|---|---|---|---|---|
Labor | Joseph Sleeman | 1,601 | 57.9 | +12.8 | |
Nationalist | Frank Gibson | 1,164 | 42.1 | +6.1 | |
Total formal votes | 2,765 | 98.4 | +1.2 | ||
Informal votes | 44 | 1.6 | −1.2 | ||
Turnout | 2,809 | 63.8 | −12.8 | ||
Labor gain from Nationalist | Swing | +11.6 |
Party | Candidate | Votes | % | ±% | |
---|---|---|---|---|---|
Country | Edward Angelo | 490 | 55.6 | −5.1 | |
Labor | William Willesee | 391 | 44.4 | +17.9 | |
Total formal votes | 881 | 99.3 | +0.3 | ||
Informal votes | 6 | 0.7 | −0.3 | ||
Turnout | 887 | 68.2 | +7.3 | ||
Country hold | Swing | N/A |
Party | Candidate | Votes | % | ±% | |
---|---|---|---|---|---|
Labor | John Willcock | unopposed | |||
Labor hold | Swing |
Party | Candidate | Votes | % | ±% | |
---|---|---|---|---|---|
Labor | Maurice Kennedy | 861 | 44.1 | +6.0 | |
Country | Henry Maley | 705 | 36.1 | −25.8 | |
Executive Country | William Patrick | 387 | 19.8 | +19.8 | |
Total formal votes | 1,953 | 99.1 | −0.3 | ||
Informal votes | 17 | 0.9 | +0.3 | ||
Turnout | 1,970 | 67.1 | −2.3 | ||
Two-party-preferred result | |||||
Labor | Maurice Kennedy | 989 | 50.6 | +12.5 | |
Country | Henry Maley | 964 | 49.4 | −12.5 | |
Labor gain from Country | Swing | +12.5 |
Party | Candidate | Votes | % | ±% | |
---|---|---|---|---|---|
Labor | William Johnson | 3,552 | 55.8 | +9.8 | |
National Labor | Joseph Davies | 2,814 | 44.2 | −5.0 | |
Total formal votes | 6,366 | 99.5 | +1.3 | ||
Informal votes | 32 | 0.5 | −1.3 | ||
Turnout | 6,398 | 71.2 | +1.3 | ||
Labor gain from National Labor | Swing | +8.7 |
Party | Candidate | Votes | % | ±% | |
---|---|---|---|---|---|
Labor | Selby Munsie | unopposed | |||
Labor hold | Swing |
Party | Candidate | Votes | % | ±% | |
---|---|---|---|---|---|
Country | Charles Maley | 796 | 45.6 | +17.3 | |
Executive Country | John Stratton | 534 | 30.6 | +30.6 | |
Country | William Mitchell | 355 | 20.3 | −7.3 | |
Executive Country | George Matthews | 62 | 3.5 | +3.5 | |
Total formal votes | 1,747 | 98.2 | +1.8 | ||
Informal votes | 32 | 1.8 | −1.8 | ||
Turnout | 1,779 | 60.0 | +12.3 | ||
Two-candidate-preferred result | |||||
Country | Charles Maley | 1,071 | 61.3 | +8.2 | |
Executive Country | John Stratton | 676 | 38.7 | +38.7 | |
Country hold | Swing | N/A |
Party | Candidate | Votes | % | ±% | |
---|---|---|---|---|---|
Labor | James Cunningham | 1,805 | 62.7 | +16.5 | |
Ind. Nationalist | Henry Raven | 839 | 29.2 | +29.2 | |
National Labor | Charles Elliott | 234 | 8.1 | +3.2 | |
Total formal votes | 2,878 | 99.6 | +0.3 | ||
Informal votes | 11 | 0.4 | −0.3 | ||
Turnout | 2,889 | 64.8 | −10.9 | ||
Labor hold | Swing | N/A |
Party | Candidate | Votes | % | ±% | |
---|---|---|---|---|---|
Labor | Thomas Walker | 700 | 72.3 | +9.0 | |
Executive Country | Neville Heenan | 174 | 18.0 | +18.0 | |
Nationalist | Charles Dempster | 94 | 9.7 | −27.0 | |
Total formal votes | 700 | 98.6 | −1.1 | ||
Informal votes | 14 | 1.4 | +1.1 | ||
Turnout | 982 | 69.3 | +9.3 | ||
Labor hold | Swing | N/A |
Party | Candidate | Votes | % | ±% | |
---|---|---|---|---|---|
Executive Country | Alexander Thomson | 1,634 | 65.2 | +65.2 | |
Country | George McLeod | 873 | 34.8 | −39.8 | |
Total formal votes | 2,507 | 99.4 | −0.2 | ||
Informal votes | 16 | 0.6 | +0.2 | ||
Turnout | 2,523 | 64.1 | +9.1 | ||
Executive Country gain from Country | Swing | N/A |
Party | Candidate | Votes | % | ±% | |
---|---|---|---|---|---|
Labor | Aubrey Coverley | 234 | 33.5 | +0.2 | |
Nationalist | George Foley | 174 | 24.9 | +24.9 | |
Ind. Nationalist | Ancell Gregory | 155 | 22.2 | +22.2 | |
Ind. Nationalist | William Chalmers | 104 | 14.9 | +14.9 | |
Independent | Walter Brown | 32 | 4.6 | +4.6 | |
Total formal votes | 699 | 98.3 | −1.0 | ||
Informal votes | 12 | 1.7 | +1.0 | ||
Turnout | 711 | 67.5 | +2.3 | ||
Two-party-preferred result | |||||
Labor | Aubrey Coverley | 404 | 57.8 | ||
Nationalist | George Foley | 295 | 42.2 | ||
Labor gain from Country | Swing | N/A |
Party | Candidate | Votes | % | ±% | |
---|---|---|---|---|---|
Labor | Harry Millington | 3,177 | 53.2 | +16.5 | |
Nationalist | Lionel Carter | 2,793 | 46.8 | +20.8 | |
Total formal votes | 5,970 | 99.3 | +2.1 | ||
Informal votes | 42 | 0.7 | −2.1 | ||
Turnout | 6,012 | 57.7 | −4.6 | ||
Labor gain from Nationalist | Swing | +10.1 |
Party | Candidate | Votes | % | ±% | |
---|---|---|---|---|---|
Labor | Alexander Panton | 254 | 60.3 | +12.3 | |
National Labor | John Mullany | 167 | 39.7 | −12.3 | |
Total formal votes | 421 | 99.8 | +0.8 | ||
Informal votes | 1 | 0.2 | −0.8 | ||
Turnout | 422 | 87.4 | +8.0 | ||
Labor gain from National Labor | Swing | +12.3 |
Party | Candidate | Votes | % | ±% | |
---|---|---|---|---|---|
Country | James Denton | 911 | 53.1 | +6.2 | |
Executive Country | Victor Spencer | 388 | 22.6 | +0.9 | |
Executive Country | Alexander Stone | 172 | 10.0 | +10.0 | |
Independent | George Welch | 139 | 8.1 | +8.1 | |
Executive Country | James Jones | 105 | 6.1 | +6.1 | |
Total formal votes | 1,715 | 97.7 | +0.4 | ||
Informal votes | 41 | 2.3 | −0.4 | ||
Turnout | 1,756 | 54.0 | +8.1 | ||
Country hold | Swing | N/A |
Party | Candidate | Votes | % | ±% | |
---|---|---|---|---|---|
Labor | Thomas Heron | 408 | 73.3 | +15.4 | |
Independent | George Wilson | 149 | 26.7 | +26.7 | |
Total formal votes | 557 | 97.7 | −1.7 | ||
Informal votes | 13 | 2.3 | +1.7 | ||
Turnout | 570 | 73.0 | −6.2 | ||
Labor hold | Swing | N/A |
Party | Candidate | Votes | % | ±% | |
---|---|---|---|---|---|
Labor | Michael Troy | unopposed | |||
Labor hold | Swing |
Party | Candidate | Votes | % | ±% | |
---|---|---|---|---|---|
National Labor | George Taylor | 207 | 54.9 | −45.1 | |
Labor | Patrick Maher | 170 | 45.1 | +45.1 | |
Total formal votes | 377 | 99.7 | |||
Informal votes | 1 | 0.3 | |||
Turnout | 378 | 75.0 | |||
National Labor hold | Swing | N/A |
Party | Candidate | Votes | % | ±% | |
---|---|---|---|---|---|
Labor | William Marshall | unopposed | |||
Labor hold | Swing |
Party | Candidate | Votes | % | ±% | |
---|---|---|---|---|---|
Nationalist | William George | 1,138 | 45.8 | −10.5 | |
Labor | Thomas Butler | 1,100 | 44.3 | +44.3 | |
Executive Country | Hugh MacDonald | 244 | 9.8 | +9.8 | |
Total formal votes | 2,482 | 98.0 | −0.4 | ||
Informal votes | 50 | 2.0 | +0.4 | ||
Turnout | 2,532 | 63.7 | +3.7 | ||
Two-party-preferred result | |||||
Nationalist | William George | 1,266 | 51.0 | ||
Labor | Thomas Butler | 1,216 | 49.0 | ||
Nationalist hold | Swing | N/A |
Party | Candidate | Votes | % | ±% | |
---|---|---|---|---|---|
Country | John Smith | 1,322 | 51.6 | +16.5 | |
Labor | Thomas Anthony | 986 | 38.5 | +14.3 | |
Ind. Nationalist | Edwin Ellis | 144 | 5.6 | +5.6 | |
Independent | Thomas Ladhams | 112 | 4.4 | +4.4 | |
Total formal votes | 2,564 | 98.6 | +0.8 | ||
Informal votes | 35 | 1.4 | −0.8 | ||
Turnout | 2,599 | 59.5 | −3.6 | ||
Country gain from Independent Country | Swing | N/A |
Party | Candidate | Votes | % | ±% | |
---|---|---|---|---|---|
Nationalist | James Smith | 1,986 | 47.0 | −10.5 | |
Labor | Frank Darcey | 1,707 | 40.4 | −2.1 | |
Independent | Richard White | 535 | 12.6 | +12.6 | |
Total formal votes | 4,228 | 98.8 | +0.2 | ||
Informal votes | 53 | 1.2 | −0.2 | ||
Turnout | 4,281 | 56.5 | −7.5 | ||
Two-party-preferred result | |||||
Nationalist | James Smith | 2,265 | 53.6 | −3.9 | |
Labor | Frank Darcey | 1,963 | 46.4 | +3.9 | |
Nationalist hold | Swing | −3.9 |
Party | Candidate | Votes | % | ±% | |
---|---|---|---|---|---|
Labor | William Angwin | unopposed | |||
Labor hold | Swing |
Party | Candidate | Votes | % | ±% | |
---|---|---|---|---|---|
Nationalist | James Mitchell | 1,296 | 53.0 | −5.1 | |
Labor | Louis Grieve | 1,149 | 47.0 | +5.1 | |
Total formal votes | 2,445 | 99.2 | 0.0 | ||
Informal votes | 20 | 0.8 | 0.0 | ||
Turnout | 2,465 | 75.5 | +2.3 | ||
Nationalist hold | Swing | −5.1 |
Party | Candidate | Votes | % | ±% | |
---|---|---|---|---|---|
Nationalist | Harry Mann | 1,395 | 52.0 | +2.3 | |
Labor | Richard Lane | 1,288 | 48.0 | +18.5 | |
Total formal votes | 2,683 | 99.0 | +1.9 | ||
Informal votes | 26 | 1.0 | −1.9 | ||
Turnout | 2,709 | 48.2 | −14.7 | ||
Nationalist hold | Swing | N/A |
Party | Candidate | Votes | % | ±% | |
---|---|---|---|---|---|
Labor | Alfred Lamond | 195 | 45.7 | +10.1 | |
National Labor | Henry Underwood | 165 | 38.6 | +38.6 | |
Executive Country | Arthur Brown | 67 | 15.7 | +15.7 | |
Total formal votes | 427 | 95.1 | −3.6 | ||
Informal votes | 22 | 4.9 | +3.6 | ||
Turnout | 449 | 56.3 | −1.8 | ||
Two-party-preferred result | |||||
Labor | Alfred Lamond | 225 | 52.7 | +17.1 | |
National Labor | Henry Underwood | 202 | 47.3 | +47.3 | |
Labor gain from Independent | Swing | N/A |
Party | Candidate | Votes | % | ±% | |
---|---|---|---|---|---|
Country | Henry Hickmott | 425 | 29.0 | −40.0 | |
Executive Country | Henry Brown | 242 | 16.5 | +16.5 | |
Executive Country | Joseph Watson | 239 | 16.3 | +16.3 | |
Executive Country | Francis Wake | 194 | 13.2 | +13.2 | |
Executive Country | Edwin Corby | 157 | 10.7 | +10.7 | |
Executive Country | William Vinicombe | 134 | 9.1 | +9.1 | |
Executive Country | Johnson Kennard | 76 | 5.2 | +5.2 | |
Total formal votes | 1,467 | 97.7 | −0.5 | ||
Informal votes | 34 | 2.3 | +0.5 | ||
Turnout | 1,501 | 56.8 | +4.1 | ||
Two-candidate-preferred result | |||||
Executive Country | Henry Brown | 846 | 57.7 | ||
Country | Henry Hickmott | 621 | 42.3 | ||
Executive Country gain from Country | Swing | N/A |
Party | Candidate | Votes | % | ±% | |
---|---|---|---|---|---|
Nationalist | Frederick Teesdale | unopposed | |||
Nationalist hold | Swing |
Party | Candidate | Votes | % | ±% | |
---|---|---|---|---|---|
Labor | Alick McCallum | unopposed | |||
Labor hold | Swing |
Party | Candidate | Votes | % | ±% | |
---|---|---|---|---|---|
Nationalist | Walter Richardson | 2,584 | 43.5 | +18.8 | |
Labor | Ephraim Freedman | 1,963 | 33.0 | −1.2 | |
Nationalist | Clifford Sadlier | 1,395 | 23.5 | +23.5 | |
Total formal votes | 5,942 | 98.7 | +0.2 | ||
Informal votes | 77 | 1.3 | −0.2 | ||
Turnout | 6,019 | 63.8 | 0.0 | ||
Two-party-preferred result | |||||
Nationalist | Walter Richardson | 3,768 | 63.4 | +63.4 | |
Labor | Ephraim Freedman | 2,174 | 36.6 | −2.8 | |
Nationalist gain from National Labor | Swing | N/A |
Party | Candidate | Votes | % | ±% | |
---|---|---|---|---|---|
Nationalist | George Barnard | 1,076 | 41.7 | +17.3 | |
Labor | Thomas Lowry | 767 | 29.7 | +29.7 | |
Executive Country | William Pickering | 739 | 28.6 | +28.6 | |
Total formal votes | 2,582 | 98.6 | +0.5 | ||
Informal votes | 36 | 1.4 | −0.5 | ||
Turnout | 2,618 | 69.7 | −8.7 | ||
Two-party-preferred result | |||||
Nationalist | George Barnard | 1,496 | 57.9 | +13.5 | |
Labor | Thomas Lowry | 1,086 | 42.1 | +42.1 | |
Nationalist gain from Country | Swing | N/A |
Party | Candidate | Votes | % | ±% | |
---|---|---|---|---|---|
Country | Richard Sampson | 1,875 | 57.9 | +27.6 | |
Labor | William Logie | 1,362 | 42.1 | +12.1 | |
Total formal votes | 3,237 | 99.2 | +1.5 | ||
Informal votes | 25 | 0.8 | −1.5 | ||
Turnout | 3,262 | 69.5 | +1.8 | ||
Country hold | Swing | −1.0 |
Party | Candidate | Votes | % | ±% | |
---|---|---|---|---|---|
Country | Alfred Piesse | 645 | 28.6 | −31.1 | |
Executive Country | John Lindsay | 574 | 25.4 | +25.4 | |
Executive Country | Ignatius Boyle | 399 | 17.7 | +17.7 | |
Executive Country | Charles Fraser | 346 | 15.3 | +15.3 | |
Nationalist | Robert Gamble | 293 | 13.0 | +13.0 | |
Total formal votes | 2,257 | 97.8 | +0.1 | ||
Informal votes | 51 | 2.2 | −0.1 | ||
Turnout | 2,308 | 56.4 | +6.0 | ||
Two-candidate-preferred result | |||||
Executive Country | John Lindsay | 1,187 | 52.6 | +52.6 | |
Country | Alfred Piesse | 1,070 | 47.4 | −12.3 | |
Executive Country gain from Country | Swing | N/A |
Party | Candidate | Votes | % | ±% | |
---|---|---|---|---|---|
Country | Sydney Stubbs | 1,110 | 64.1 | −3.5 | |
Executive Country | Norman Harvey | 621 | 35.9 | +35.9 | |
Total formal votes | 1,731 | 99.2 | +0.3 | ||
Informal votes | 13 | 0.8 | −0.3 | ||
Turnout | 1,744 | 61.3 | +3.2 | ||
Country hold | Swing | N/A |
Party | Candidate | Votes | % | ±% | |
---|---|---|---|---|---|
Nationalist | Thomas Davy | 1,250 | 34.8 | +34.8 | |
Labor | Alexander McDougall | 1,233 | 34.3 | +34.3 | |
Nationalist | Edith Cowan | 1,108 | 30.8 | −7.5 | |
Total formal votes | 3,561 | 99.2 | +0.7 | ||
Informal votes | 30 | 0.8 | −0.7 | ||
Turnout | 3,621 | 64.8 | −4.5 | ||
Two-party-preferred result | |||||
Nationalist | Thomas Davy | 2,182 | 60.8 | ||
Labor | Alexander McDougall | 1,409 | 39.2 | ||
Nationalist hold | Swing | N/A |
Party | Candidate | Votes | % | ±% | |
---|---|---|---|---|---|
Executive Country | Edward Johnston | 1,881 | 72.4 | ||
Labor | Cyril Longmore | 717 | 27.6 | ||
Total formal votes | 2,598 | 99.6 | |||
Informal votes | 9 | 0.4 | |||
Turnout | 2,607 | 63.0 | |||
Executive Country gain from Country | Swing | N/A |
Party | Candidate | Votes | % | ±% | |
---|---|---|---|---|---|
Labor | Edwin Corboy | 409 | 58.4 | +10.4 | |
Nationalist | Austin Allom | 134 | 19.1 | +19.1 | |
Executive Country | Thomas Hamerston | 113 | 16.1 | +16.1 | |
Executive Country | Christian Andre | 45 | 6.4 | +6.4 | |
Total formal votes | 701 | 99.6 | +2.5 | ||
Informal votes | 3 | 0.4 | −2.5 | ||
Turnout | 704 | 76.3 | |||
Labor hold | Swing | N/A |
Party | Candidate | Votes | % | ±% | |
---|---|---|---|---|---|
Country | Charles Latham | 1,407 | 60.7 | +6.5 | |
Executive Country | William Burges | 910 | 39.3 | −6.5 | |
Total formal votes | 2,317 | 99.4 | −0.1 | ||
Informal votes | 15 | 0.6 | +0.1 | ||
Turnout | 2,332 | 64.1 | +7.0 | ||
Country hold | Swing | +6.5 |
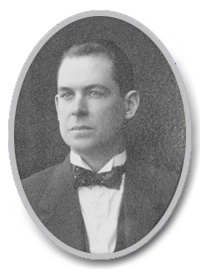
Sir James Mitchell, was an Australian politician. He served as premier of Western Australia from 1919 to 1924 and from 1930 to 1933, as leader of the Nationalist Party. He then held viceregal office from 1933 to 1951, as acting governor from 1933 to 1948 and governor of Western Australia from 1948 until his death in 1951.
The Electoral district of Brown Hill-Ivanhoe was a Legislative Assembly electorate in the state of Western Australia. It covered part of the Goldfields city of Boulder, near Kalgoorlie, and neighbouring mining areas. It was created at the 1911 redistribution out of the former seats of Brown Hill and Ivanhoe, and was first contested at the 1911 election. It was abolished in the 1948 redistribution, with its area split between the neighbouring electorates of Boulder and Hannans, taking effect from the 1950 election. The seat was a very safe one for the Labor Party.
The electoral district of Pilbara is a Legislative Assembly electorate in the state of Western Australia. Pilbara is named for the region of Western Australia in which it is located. It is one of the oldest electorates in Western Australia, with its first member having been elected to the Second Parliament of the Legislative Assembly at the 1894 elections.
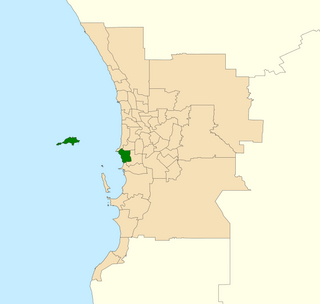
Fremantle is an electoral district of the Legislative Assembly in the Australian state of Western Australia.
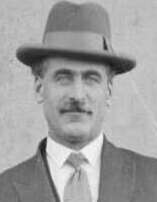
Philip Collier was an Australian politician who served as the 14th Premier of Western Australia from 1924 to 1930 and from 1933 to 1936. He was leader of the Labor Party from 1917 to 1936, and is Western Australia's longest-serving premier from that party.
This is a list of members of the Western Australian Legislative Assembly between the 1921 election and the 1924 election, together known as the 11th Parliament. During the term, the Country Party split into rival factions, the Ministerial Country Party (MCP) which comprised the bulk of the parliamentary party—many of whom had switched allegiance from other parties since 1919—and the Executive Country Party (ECP), which was loyal to the Primary Producers' Association, which the Country Party was intended to represent in Parliament. After the 1924 election, which significantly strengthened the latter at the expense of the former, the Ministerial arm merged with the Nationalist Party.
This is a list of members of the Western Australian Legislative Assembly between the 1924 election and the 1927 election, together known as the 12th Parliament. During the previous term, the Country Party had split into rival factions, the Ministerial Country Party (MCP) which comprised the bulk of the parliamentary party—many of whom had switched allegiance from other parties since 1919—and the Executive Country Party (ECP), which was loyal to the Primary Producers' Association, which the Country Party was intended to represent in Parliament. After the 1924 election, which significantly strengthened the latter at the expense of the former, the Ministerial arm merged with the Nationalist Party, as did the National Labor Party, which lost most of its representation in the election.
State elections were held in South Australia on 9 and 16 April 1921. All 46 seats in the South Australian House of Assembly were up for election. The incumbent Liberal Union government led by Premier of South Australia Henry Barwell defeated the opposition Australian Labor Party led by Leader of the Opposition John Gunn. Each district elected multiple members, with voters casting multiple votes.
State elections were held in South Australia on 5 April 1924. All 46 seats in the South Australian House of Assembly were up for election. The incumbent Liberal Federation government led by Premier of South Australia Henry Barwell was defeated by the opposition Australian Labor Party led by Leader of the Opposition John Gunn. Each district elected multiple members, with voters casting multiple votes.
Northam was an electoral district of the Legislative Assembly in the Australian state of Western Australia from 1890 to 1974.
The First Mitchell Ministry was the 15th Ministry of the Government of Western Australia and was led by Nationalist Premier James Mitchell. It succeeded the Colebatch Ministry on 17 May 1919 after the collapse of Hal Colebatch's brief service as Premier. It assumed a stability which had been absent from Western Australian politics since the 1914 election. The ministry was followed by the Collier Ministry on 15 April 1924 after the Nationalist coalition lost government at the state election held on 22 March.
Guildford was an electoral district of the Legislative Assembly in the Australian state of Western Australia from 1901 to 1962.
The First Collier Ministry was the 16th Ministry of the Government of Western Australia and was led by Labor Premier Philip Collier. It succeeded the First Mitchell Ministry on 16 April 1924, following the defeat of the Nationalist government at the 1924 election on 22 March.
The 1927 Victorian state election was held in the Australian state of Victoria on Saturday, 9 April 1927, to elect the 65 members of the state's Legislative Assembly.
The 1924 Victorian state election was held in the Australian state of Victoria on Thursday 26 June 1924 to elect the 65 members of the state's Legislative Assembly.
Elections were held in the state of Western Australia on 26 March 1927 to elect all 50 members to the Legislative Assembly. The incumbent Labor Party government, led by Premier Philip Collier, won a second term in government against the United-Country opposition, led by Opposition Leader James Mitchell.
Elections were held in the state of Western Australia on 22 March 1924 to elect all 50 members to the Legislative Assembly. The incumbent Nationalist-Majority Country government, led by Premier James Mitchell, was defeated by the Labor Party opposition, led by Opposition Leader Philip Collier.
The Executive Country Party was a splinter group from the Western Australian branch of the Country Party of Australia that was active in the mid-1920s. It was led by the state deputy leader of the Country Party, Alec Thomson. The members of the Executive faction wanted better representation of the Primary Producers' Association by the party, while the remainder chose to primarily support the Nationalist coalition led by then Premier James Mitchell. In 1923, three members of the 16-member Country Party split to form the ECP.
Elections were held in the state of Western Australia on 12 March 1921 to elect all 50 members to the Legislative Assembly. The incumbent government, led by Premier James Mitchell of the Nationalist Party and supported by the Country Party and National Labor Party, won a second term in government against the Labor Party opposition, led by Opposition Leader Philip Collier.